
![]()
Online dating has gone from an awkward niche to a global norm for singles of all ages. Match Group went public at $12 per share in 2015. Today a mere six years later the stock is trading at $159 per share, a 1225% increase and has become a Wall Street darling. Believe it or not MTCH has become a $44 billion company.
Online dating is booming globally. Match is the owner of Match.com, Tinder, Plenty of Fish, OurTime, Hinge, Pairs and OKCupid. Many analysts believe that if Match can retain its unrivaled leadership in the space the company can easily go on to a very bright future. Match offers its customers dating possibilities in 40 different languages to users all over the world.
Skeptics point out that FACEBOOK (FB) is the elephant in the room. Facebook launched Facebook dating in 2019 and the pandemic has curtailed enthusiasm for its attempt to connect singles. It remains to be seen how many people will use Facebook Dating in 2021 — but Facebook does have a massive, big scale and data advantage when it comes to its userbase. Some on Wall Street believe that if Facebook dating does not work, the social media giant will just go and purchase a leading player in the dating niche. Match certainly meets that profile.
MTCH has huge growth potential and very healthy financials. In the last quarter MATCH grew is paying subscriber base by roughly 1.2 million users to over 15 million and only spent 22% of its revenue on marketing. While 2020 was a challenging year for the company, it appears to be growing rapidly. In its first quarter of 2021 it has grown revenue by 27% to $708 million.
The ongoing challenge for MATCH GROUP is its valuation. It is currently trading north of 82 times earnings which is pricey, to say the least. All indications point toward the company aggressively growing its bottom line moving forward. The company plans to integrate its video, audio and a.i. technologies into all its apps. Earnings are estimated to grow by over 25% per year. While this sounds hyperbolic over the last 5 years MTCH has grown earnings by over 32.7% per year.
In this weekly stock study, we will look at and analyze the following indicators and metrics which are our guidelines which dictate our behavior in deciding whether to buy, sell, or stand aside on a particular stock.
- Wall Street Analysts’ Estimates
- 52-week high and low boundaries
- Vantagepoint A.I. Forecast (Predictive Blue Line)
- The Best Case – Worst Case Scenarios
- Neural Network Forecast
- Daily Range Forecast
- Intermarket Analysis
- Our trading suggestion
We don’t base our trading decisions on things like earnings or fundamental cash flow valuations. However, we do look at them to better understand the financial landscape that a company is operating under.
Wall Street Analysts’ Estimates
The 18 analysts offering 12-month price forecasts for Match Group Inc have a median target of $179.00, with a high estimate of $192.00 and a low estimate of $148.00. The median estimate represents a +12.29% increase from the last price of $159.41. For us this means that is still slightly undervalued from a pure fundamental basis.
52-Week High and Low Boundaries
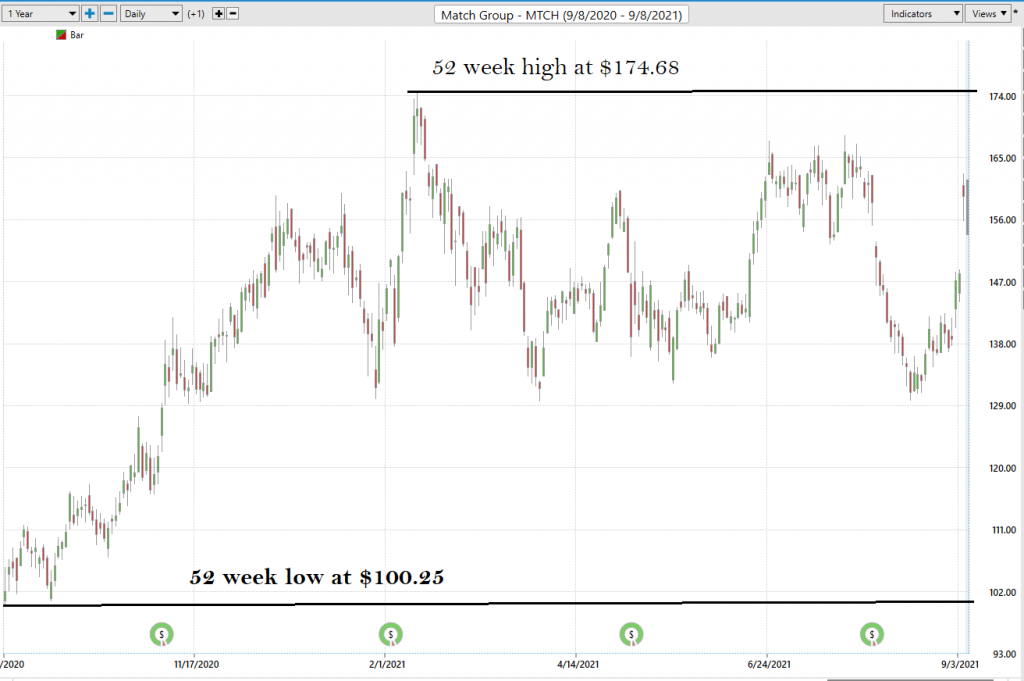
Looking at the Long-Term chart of MTCH provides us with the 52-week high and low boundaries.
Over the past year we have seen MTCH trade as low as $100.25 and as high as $174.68. This tells us that the average weekly trading range for MTCH is $1.43
We look to amplify this value greatly when trading with the artificial intelligence.
When we study the 52-week chart, by simply eyeballing the chart you can quickly see that for the last 8 months MTCH has been is a very broad sideways channel and range.
We like to study the 52-week chart before doing anything else just so that we can get a feel for how the company has performed over the past year and compare that to other opportunities and the broader market indexes.
Over the past year the Dow Jones Industrial is up 27.21%. The S&P 500 Index is UP 35.27% and the NASDAQ Composite is UP 40.75%. MTCH over this same time frame is UP 57.95% and has outperformed the broader market indexes. But as you are tempted by that additional upside gain you also need to look at the DOWNSIDE and MTCH has had numerous pullbacks greater than 15%.
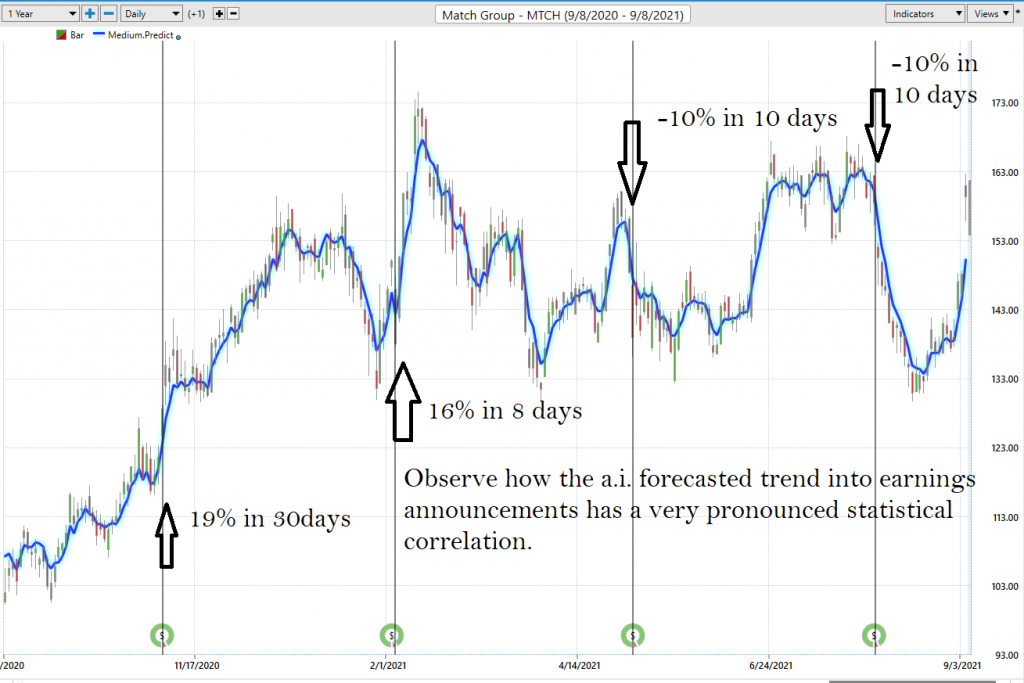
But let’s do some basic trend forecasting analysis based upon looking at the Vantagepoint predictive blue line and MATCH Group’s Earnings announcement. I have taken the liberty of highlighting the areas on the chart below when earnings were announced.
What is immediately visible is that the a.i. trend forecast going into the earnings announcement is very highly statistically correlated to what we can expect in the stock’s performance post earnings.
Vantagepoint A.I. Forecast (Predictive Blue Line)
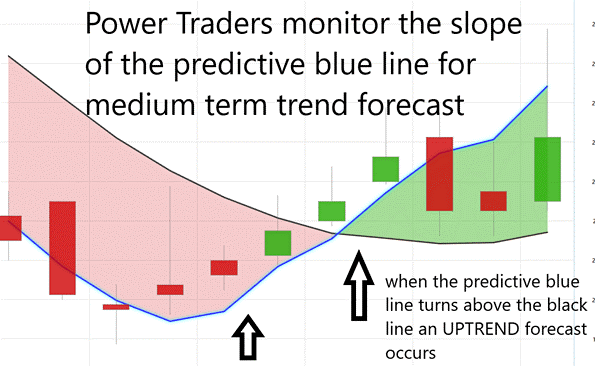
On the following chart you will see the power of the VantagePoint Predictive blue line which determines the medium term trend price forecast.
The guidelines we abide by are as follows:
- The slope of the predictive blue line determines the trend and general direction of MTCH
- Ideally, the VALUE ZONE is determined to try and buy the asset at or below the predictive blue line.
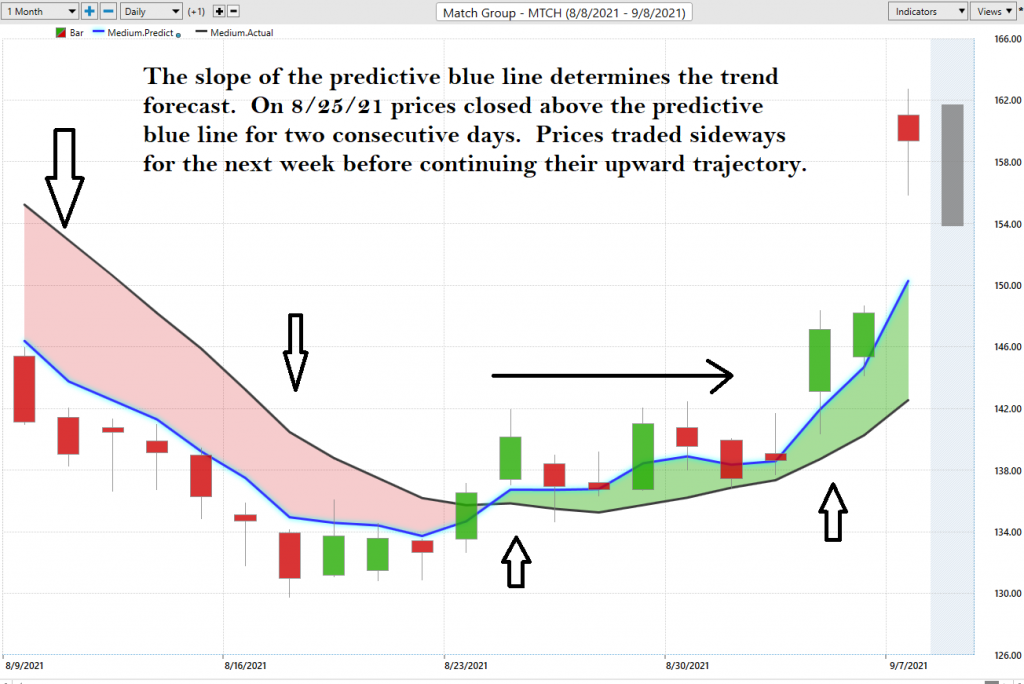
Here is a snapshot of the last months price action in MTCH.
You can quickly see that starting on August 9th the a.i. trend forecast was negative, and prices cratered from the 146 level to as low as $130 over the next 8 trading sessions. However, the trend forecast changed from DOWN to UP on August 24th at $140 a share. Looking only at price and the predictive blue line observe how price closed for two consecutive days above the predictive blue line initiating a change of trend forecast.
Prices traded sideways for the next eight sessions and on September 2, 2021, resumed their upward trajectory to $163.
When you study the chart on MTCH, one of the strategies that Power Traders have been utilizing to trade MTCH is to always trade the slope of the predictive blue line as we enter an earnings announcement.
Over the past year this has been a very effective way for medium term swing traders and longer-term investors to positions themselves on the long OR short side of this asset.
This strategy is not for the risk averse, but you can see price swings of as much as almost 20% in 30 days to the upside and price drops of 10% post earnings in as little as ten trading sessions.
Naturally when the predictive blue line slopes lower traders would be anticipating lower prices and either moving to the sidelines or shorting this asset.
Using VantagePoint Software and the artificial intelligence, traders are alerted to trend forecasts by monitoring the slope of the predictive blue line.
Best Case – Worst Case Scenario $MTCH
The best-case scenario occurred on August 9, 2020, where had you purchased the asset, you would be sitting on gains of 57% at present time.
The worst-case scenario occurred on July 28, 2021. Had you purchased MTCH you would have purchased the 52-week high and would have seen a drawdown of 22% over the next 15 days and would still be sitting on a 4% loss.
The declines ranged from 4 to 8 week and ranged from as little as 17% and as much as 25%.
Market rallies ranged from 3 to 15 weeks and ranged from 23% to as much as 57%.
In other words, the market is quick to rally and slower to fall.
This price volatility is ideal for SWING traders who can exploit the upside without having to experience the steep decline.
Neural Network Indicator (Machine Learning)
At the bottom of the chart is the Neural Network Indicator which predicts future short-term strength and/or weakness in the market. When the Neural Net Indicator is green it communicates strength. When the Neural Net is red it is forecasting short term weakness in the market.
A Neural Net is a computational learning system that uses a network of functions to understand and translate massive amounts of data into a desired output, consistently monitoring itself and improving its performance.
Whenever Power Traders are looking for statistically valid trading setups, they look for a DOUBLE confirmation signal. This signal occurs whenever the blue predictive line and the Neural Net at the bottom of the chart suggest the same future expected outcome.
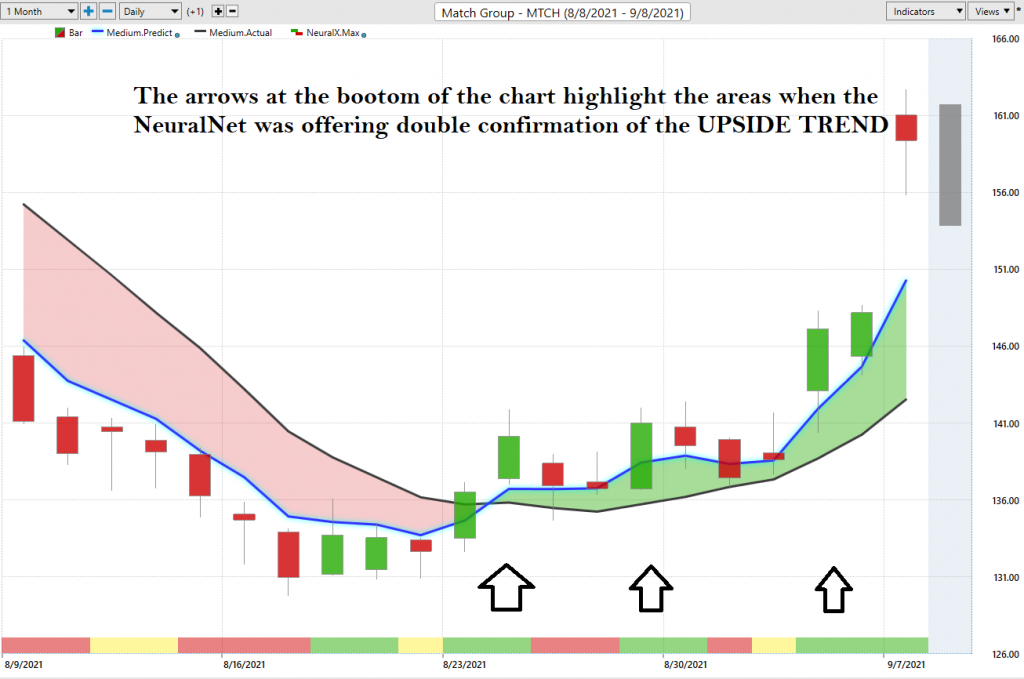
We advocate that Power Traders cross reference the chart with the predictive blue line and neural network indicator to create optimal entry and exit points.
Traders look for confirmation on the NeuralNet to position themselves LONG or SHORT in the market. In other words, when the A.I. forecast is green, and The Neural Net is green, that presents a buying opportunity.
The inverse is also true, when the A.I. forecast is red and the Neural Net is red, that is a SELLING opportunity. The arrows on the chart below highlight the trading zones where Power Traders would’ve been using double confirmation to BUY in cross referencing the A.I. forecast with the NeuralNet.
Power Traders are always looking to apply both the Neural Network and A.I. to the markets to find statistically sound trading opportunities.
VantagePoint Software Daily Price Range Prediction
One of the powerful features in the VantagePoint Software which Power Traders use daily is the Price Range prediction forecast.
This forecast is what permits Power Traders to truly fine-tune their entries and exits into the market.
Every day traders are faced with the anxiety and frustration of wondering where they should be looking to buy and sell the market. VantagePoint’s A.I. makes this decision super easy with the Daily Price Range Forecast.
For short-term traders the important question that they have to confront every day is where should I buy? Where should I place my stop? Where should I sell? The Vantagepoint Daily Price Range forecast answers this question with precision.
Here is the price chart of MTCH during the most recent one-month run-up featuring the Daily Price Range forecast with the Neural Net Indicator.
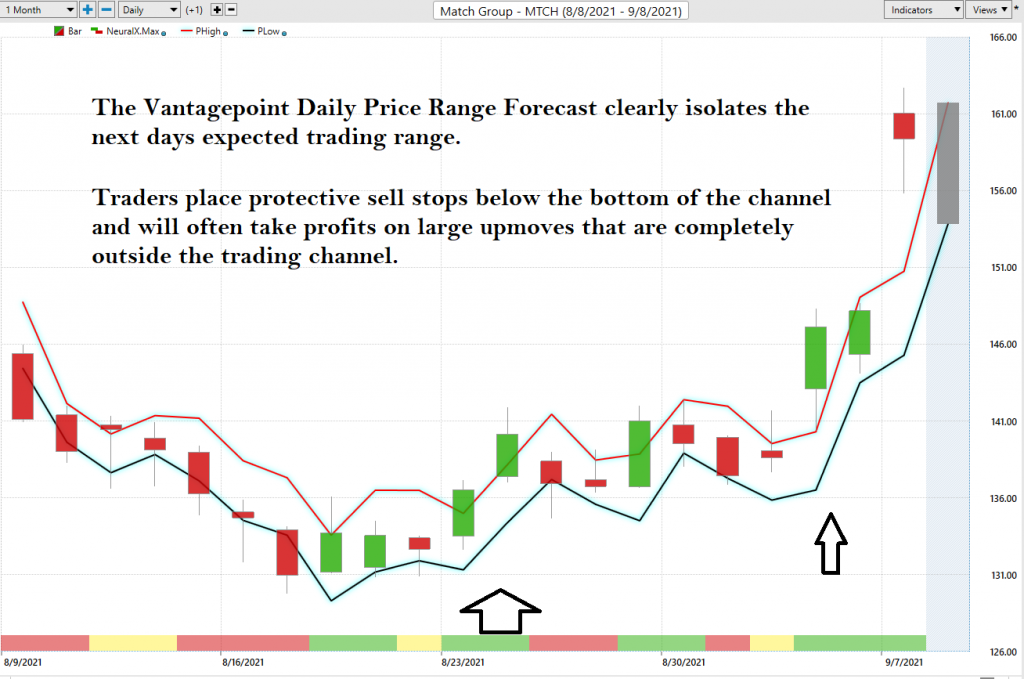
This chart helps traders decide where stop placement should occur. Observe how placing protective sell stops below the dark line on the chart was a powerful way to minimize risk on this trade.
See how the upper and lower bands of the price range forecast for a very clear channel of trading activity as well. Swing traders are always looking for opportunities to buy towards the bottom of the predicted channel and selling opportunities above the top band.
Intermarket Analysis
Power lies in the way we respond to the truth we understand.
MTCH has a great narrative. It has solid earnings, great financials.
One of the supremely important questions in trading is what is driving the price? Headlines often create interesting narratives. But these “stories” only capture the imagination. Traders want and need to understand the cause and effect of price movement.
The only way to get an answer to this important question is through intermarket analysis which looks at statistical price correlations of assets.
We live in a global marketplace.
Everything is interconnected.
Interest rates, Crude Oil Prices, and the volatility of the Dollar amongst thousands of other variables affect the decisions companies must make to flourish and prosper in these very challenging times. Trying to determine what these factors are is one of the huge problems facing investors and traders.
You always have a choice. You can tune in to the talking heads in the media who spin talking points which promote fear. Or you can rely on facts to base your decision making on.
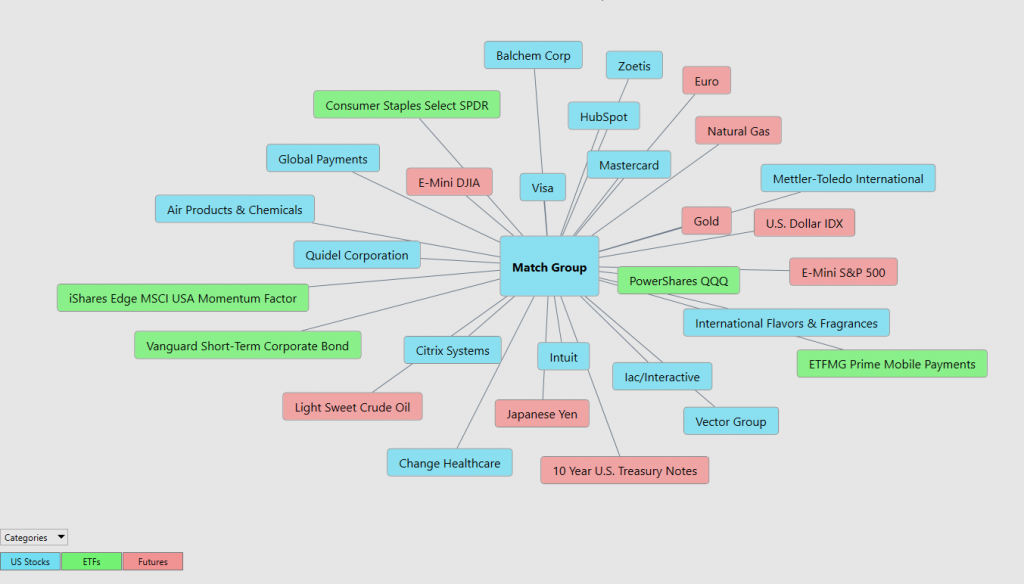
Within the following Intermarket Analysis graphic, you will see the 31 markets that are the key drivers to MTCH’s price.
There is great value to be had in studying and understanding the key drivers of MTCH’s price action. This graphic provides a microcosmic view of what factors have been driving CMG higher.
Trading Suggestion
As I mentioned at the beginning of this Stock Study, Wall Street Analysts has a median target of $148 and a high estimate of $192,
With MTCH trading below its 52-week high and below the 192 high estimate we think we are looking at an asset that will continue to present better than average volatility compared to the broader market indexes.
The next earnings call is scheduled for November 3, 2021. We think that treating MTCH as a short-term swing trading candidate between now and then is the most feasible way to approach this asset. MTCH is currently trading at $159. There is upside to $174.68 which is roughly 10%. But there is also substantial downside.
MTCH has had four major pullbacks of between 16% to 25% in the past year. We think the next 8 weeks before the next earnings call will see the stock build long term foundational support between $146 and $174.
The narrative for MTCH is explosive and will develop as it moves to a new 52-week high. Until that occurs, we think the stock will be rangebound as traders and institutions look to earnings before committing more.
Our suggestion is that there are better risk reward ratios in other markets at the present time. We do think the Match Group (MTCH) has great growth prospects longer term and would certainly entertain getting long again at lower price levels should the a.i, forecast corroborate that opinion.
Aggressive options traders might want to consider SELLING PUT OPTIONS on any sharp pullback and collect premium into your account. Going into the November 3rd earnings call we will be paying very close attention to the a.i. forecast as the predictive blue line has been extremely accurate in anticipating prices post earnings announcement.
Our recommendation is to follow the A.I. trend analysis as outlined in this stock study and practice good money management on all trades.
We will re-evaluate based upon:
- New Wall Street Analysts’ Estimates
- New 52-week high and low boundaries
- Vantagepoint A.I. Forecast (Predictive Blue Line)
- Neural Network Forecast
- Daily Range Forecast
Let’s Be Careful Out There!
Remember, It’s Not Magic.
It’s Machine Learning.

IMPORTANT NOTICE!
THERE IS SUBSTANTIAL RISK OF LOSS ASSOCIATED WITH TRADING. ONLY RISK CAPITAL SHOULD BE USED TO TRADE. TRADING STOCKS, FUTURES, OPTIONS, FOREX, AND ETFs IS NOT SUITABLE FOR EVERYONE.
DISCLAIMER: STOCKS, FUTURES, OPTIONS, ETFs AND CURRENCY TRADING ALL HAVE LARGE POTENTIAL REWARDS, BUT THEY ALSO HAVE LARGE POTENTIAL RISK. YOU MUST BE AWARE OF THE RISKS AND BE WILLING TO ACCEPT THEM IN ORDER TO INVEST IN THESE MARKETS. DON’T TRADE WITH MONEY YOU CAN’T AFFORD TO LOSE. THIS ARTICLE AND WEBSITE IS NEITHER A SOLICITATION NOR AN OFFER TO BUY/SELL FUTURES, OPTIONS, STOCKS, OR CURRENCIES. NO REPRESENTATION IS BEING MADE THAT ANY ACCOUNT WILL OR IS LIKELY TO ACHIEVE PROFITS OR LOSSES SIMILAR TO THOSE DISCUSSED ON THIS ARTICLE OR WEBSITE. THE PAST PERFORMANCE OF ANY TRADING SYSTEM OR METHODOLOGY IS NOT NECESSARILY INDICATIVE OF FUTURE RESULTS. CFTC RULE 4.41 – HYPOTHETICAL OR SIMULATED PERFORMANCE RESULTS HAVE CERTAIN LIMITATIONS. UNLIKE AN ACTUAL PERFORMANCE RECORD, SIMULATED RESULTS DO NOT REPRESENT ACTUAL TRADING. ALSO, SINCE THE TRADES HAVE NOT BEEN EXECUTED, THE RESULTS MAY HAVE UNDER-OR-OVER COMPENSATED FOR THE IMPACT, IF ANY, OF CERTAIN MARKET FACTORS, SUCH AS LACK OF LIQUIDITY. SIMULATED TRADING PROGRAMS IN GENERAL ARE ALSO SUBJECT TO THE FACT THAT THEY ARE DESIGNED WITH THE BENEFIT OF HINDSIGHT. NO REPRESENTATION IS BEING MADE THAT ANY ACCOUNT WILL OR IS LIKELY TO ACHIEVE PROFIT OR LOSSES SIMILAR TO THOSE SHOWN.

