

Hologic, Inc. is a medical technology company primarily focused on women’s health; it sells medical devices for diagnostics, surgery, and medical imaging. HOLX focuses on women’s health products through the early detection of cervical, sexual, and vaginal issues. The company makes a variety of diagnostic, detection, and surgical products, from assays to mammography systems and radiographs. The company’s stock is up over 9% for the year, which lags very far behind the broader market indexes, but despite that, it has a P/E ratio of only 10.2. Most medical equipment manufacturers are trading north of 32 times earnings. With the lockdowns and pandemics some of Wall Streets favorite stocks have been diagnostically related. HOLX is getting a lot of attention from traders, investors, and professional money managers primarily because it is very underpriced. In other words, its share price is lower than its fundamental value.
In the third quarter, HOLX reported revenue of $1.17 billion, up 42% year over year, and earnings per share of $1.04, up 96.2% compared to the third quarter in 2020. What makes the companies financials totally stand out is the fact that it reported revenue of $3.8 billion for the first 9 months, which surpasses last years value by $20 million and promises to make the next earnings call potentially very explosive. This is the 11th straight year that HOLX has grown revenue, which is no small feat based upon what has occurred in the economy over the last 20 months. This factor has made the stock an institutional favorite.
Since the company is trading at roughly 10 times earnings, which is almost unheard of, it is making HOLX very attractive to longer term investors. Add to that feature the reality that it is growing its bottom line very aggressively and it is on the radar of most value-oriented portfolio managers.
On May 15th the company received an Emergency Use Authorization (EUA) for a second COVID-19 molecular test from the Food and Drug Administration. To quickly recap, HOLX has:
- Great Earnings
- Very Low P/E ratio
- Solid Financials
- Favorable Regulatory treatment from the FDA
- The diagnostic niche is quickly become a Wall Street favorite.
In this weekly stock study, we will look at and analyze the following indicators and metrics which are our guidelines which dictate our behavior in deciding whether to buy, sell, or stand aside on a particular stock.
- Wall Street Analysts’ Estimates
- Best Case – Worst Case Scenarios for the past year
- 52-week high and low boundaries
- Vantagepoint A.I. Forecast (Predictive Blue Line)
- Neural Network Forecast
- Daily Range Forecast
- Intermarket Analysis
- Our trading suggestion
We don’t base our trading decisions on things like earnings or fundamental cash flow valuations. However, we do look at them to better understand the financial landscape that a company is operating under.
Analysts Ratings
Based on 8 Wall Street analysts offering 12-month price targets for Hologic in the last 3 months. The average price target is $83.83 with a high forecast of $95.00 and a low forecast of $75.00. The average price target represents a 4.45% change from the last price of $80.26. We find these numbers to be very conservative based upon how undervalued the company is fundamentally and its low P/E ratio.
Commonsense Metrics
Let’s start our analysis with the commonsense metrics. Over the last 52 weeks HOLX has traded as high as $85 and as low as $56.81. This tells us that the annual trading range has been $28.19. The average weekly trading range has been $.54 These values provide baseline metrics which we look to dramatically outperform when we apply artificial intelligence and machine learning to our decision-making process.
Best Case – Worst Case Scenario
The best case for the last year took place when the low for the stock occurred on September 7, 2020 @$56.81. Over the next 43 sessions the stock rallied $19.08 per share or $33%. The worst case for the stock occurred on February 17, 2021, when the stock hit its 52-week high at $85 per share. HOLX immediately sank $17.14 per share over the next 217 trading sessions. Over the next 79 trading sessions, it lost almost 29% before testing its 52-week lows and rallying to its current price level.
When we study the charts, we start by analyzing where the market is in relation to its 52-week high and low. Experience tells us that assets that successfully breach their 52-week highs on strong momentum tend to move higher, and vice-versa. The following 1-year HOLX chart shows the most recent 52 week high and low boundaries.
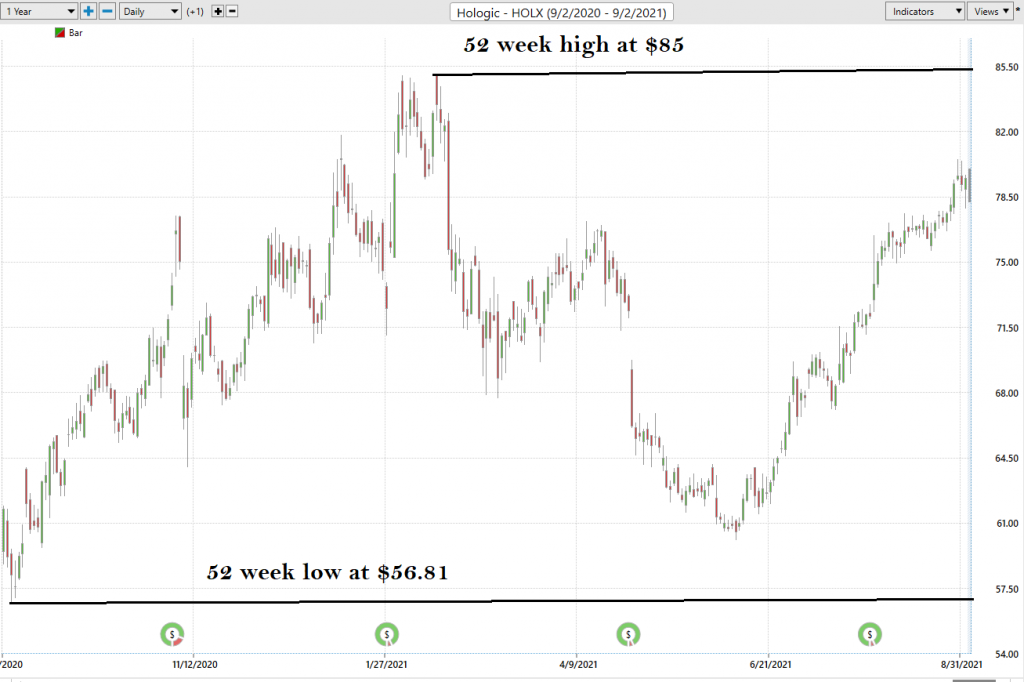
What is evident about the chart is you can easily see how EARNINGS are a catalyst either Up or DOWN for the stock. It is not uncommon to see the stock move 8% to 16% after earnings are announced.
On November 4th, – HOLX slides 16.52% in 4 days post-earnings.
On January 27th – HOLX rises 16% in 5 days post-earnings.
On April 28th, – HOLX loses 8.81% in the following 28 days post-earnings.
On July 28th– – HOLX on positive earnings rises 11.61% in 25 trading sessions.
The lesson to be learned here is that the stock tends is extremely sensitive to earnings announcements. The next scheduled earnings call date is estimated to be November 9th, 2021.
What is very interesting to us is that the broader stock market indexes are up roughly 17% year to date while HOLX and its very “sexy” story is only up 9.41%.
The VantagePoint Analysis
Whenever we look at an asset forecast, we always are comparing what the stock has done, to the artificial intelligence, which is computing its forecast based upon a proprietary intermarket analysis of the most closely correlated assets as well as a neural network computation.
The key to the VantagePoint analysis is the predictive blue line. The slope and general direction of the blue line determines the medium forecast for the market.
The VantagePoint Software has three separate modules which create a forecast for a Power Trader. They are the predictive blue line, the Neural Net, and the Intermarket Analysis.
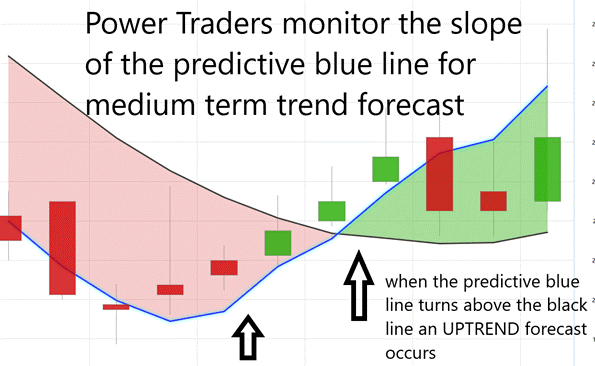
The predictive blue line also acts as value zone where in uptrends traders may try to purchase the asset at or below the blue line. Power traders use the predictive blue line in helping to determine both the value zone as well as the trend direction.
- The slope of the predictive blue line determines the trend. On the following graphic, you would want to look for opportunities to buy when the slope of the blue line is going up.
Here is the price chart of HOLX between 6/2/21 and 9/2/21
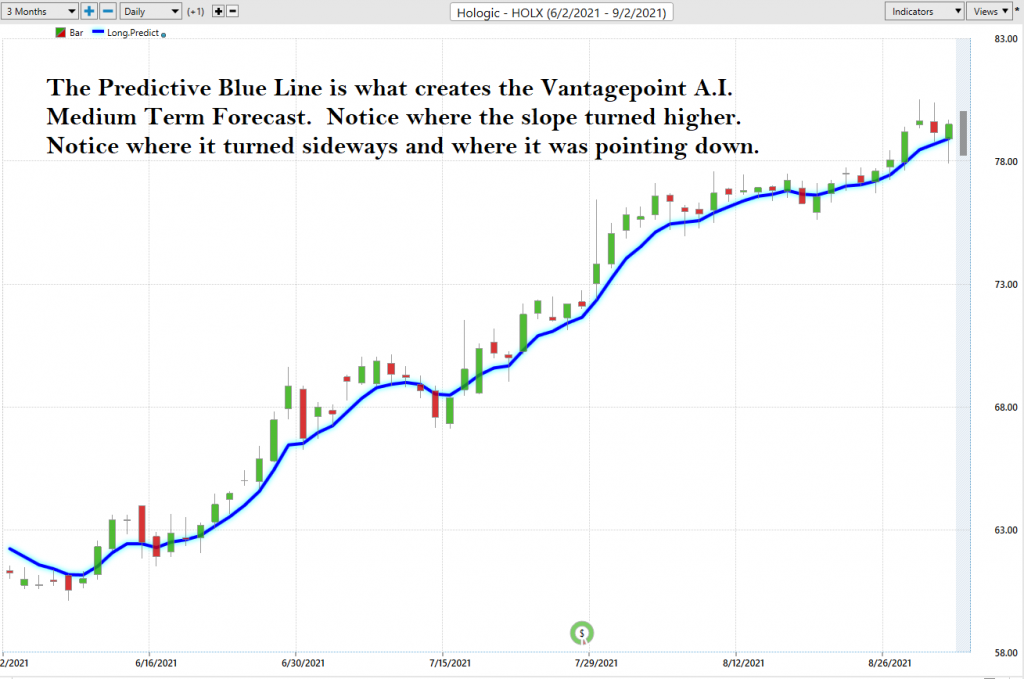
Observe “when” the SLOPE of the predictive blue line started moving higher and how price behaved.
Here is the same chart with the accompanying daily price bars. As you look through this chart study how
- Power Traders always try to look for opportunities to purchase the asset at or below the predictive blue line, as that is usually the IDEAL VALUE zone for traders.
The NeuralNet Indicator (Machine Learning)
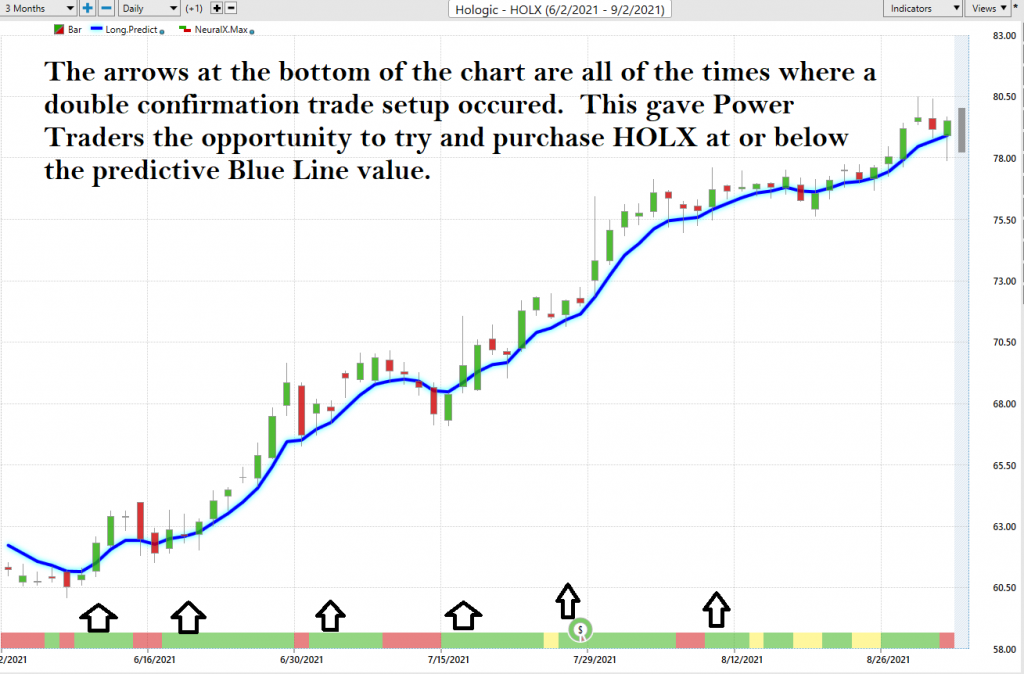
At the bottom of the chart is the Neural Network Indicator which predicts future short-term strength and/or weakness in the market. When the Neural Net Indicator is green it communicates strength. When the Neural Net is Red it is forecasting short term weakness in the market.
The most common setup or entry technique for traders is to look for the NeuralNet to be GREEN and offer double confirmation that prices will be moving higher.
A Neural Net is a computational learning system that uses a network of functions to understand and translate massive amounts of data into a desired output, consistently monitoring itself and improving its performance.
We advocate that Power Traders cross reference the chart with the predictive blue line and neural network indicator to create optimal entry and exit points.
Observe the numerous opportunities which the Neural Net focused traders on in finding ideal entry opportunities during the uptrend that occurred over the last three months.
Power Traders are always looking to apply both the neural network and A.I. to the markets to find statistically sound trading opportunities.
Fine Tuning Entries and Exits
One of the powerful features in the VantagePoint Software which Power Traders use daily is the Price Range prediction forecast.
This forecast is what permits Power Traders to truly fine tune their entries and exits into the market. One of the biggest issues that even the most experienced traders wrestle with is getting answers to where they should enter and exit the market. This involves determining where you know the value zone is as well as when you either take profits or are forced to take losses if the market unexpectedly moves against your position.
At 6:30pm after the market close the software updates and all the price predictions change based upon what the machine learning, A.I., neural networks, and intermarket analysis anticipate moving forward.
Here is the price chart of HOLX during the most recent runup featuring the Daily Price Range forecast with the Neural Net Index at the bottom of the chart. Day traders who are looking for short term swings in the markets focus on the daily price ranges to place their entry and exit orders.
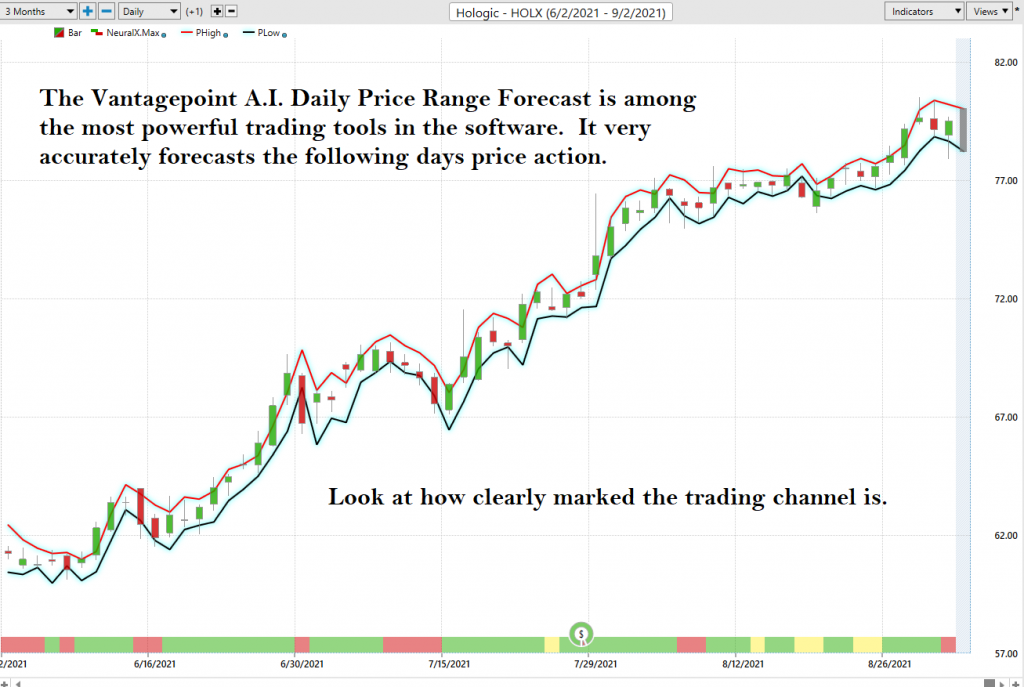
By utilizing both tools simultaneously, Power Traders can locate precision entries and exits with high probabilities of success and can exploit short term swing trading opportunities.
When buying, many Power Traders often use a price level below the predictive low price to place their protective sell stops in the market in case a sudden reversal was to occur. When selling, many Power Traders use a price level above the predictive high to place their protective sell stops.
Traders use these VantagePoint tools either independently or together to find great trading opportunities. This is the power at your fingertips when you use artificial intelligence to do your trend analysis. The slopes of the price channels above clearly delineate the trends.
Intermarket Analysis
We live in a global marketplace. Everything is interconnected. The billion-dollar question for traders is always what are the key drivers of price for the underlying asset that I am trading?
What makes VantagePoint unique and distinct when compared to all other analytical tools is its patented and proprietary intermarket analysis.
Intermarket analysis is a method of analyzing markets by examining the correlations between different asset classes. In other words, what happens in one market could, and probably does, affect other markets, so a study of the relationship(s) is often very helpful to a trader.
There is great value to be had in studying and understanding the key drivers of HOLX’s price action.
You may have a narrative that is provided by the financial media. Ask yourself… Is it accurate? Or is that narrative created by insiders who benefit from the stock moving in the direction of the narrative?
To accurately answer this question Vantagepoint Software founder Lou Mendelsohn decided you needed to know what the most statistically correlated assets to HOLX’s price are. This is referred to as Intermarket Analysis.
Small changes in Interest rates, Crude Oil Prices, and the Volatility of the dollar amongst thousands of other variables affect the decisions companies must make to survive in these very challenging times. Trying to determine what these factors are is one of the huge problems facing investors and traders.
These factors are all displayed from a standpoint of statistical correlations which show the strongest interconnectedness of prices.
When you look at the following graphic you can see the ETF’s, currencies, stocks, and commodities that have the greatest effect of HOLX’s price. Since HOLX is an institutional favorite and very widely held among large portfolio managers you can very often quickly see who the biggest holder of this stock is and find additional opportunities.
The blue rectangles represent the US stocks most statistically correlated to HOLX’s price action.
The green rectangles represent the ETF’s most statistically correlated to HOLX’s price action.
The red rectangles represent the futures contracts most statistically correlated to HOLX’s price action.
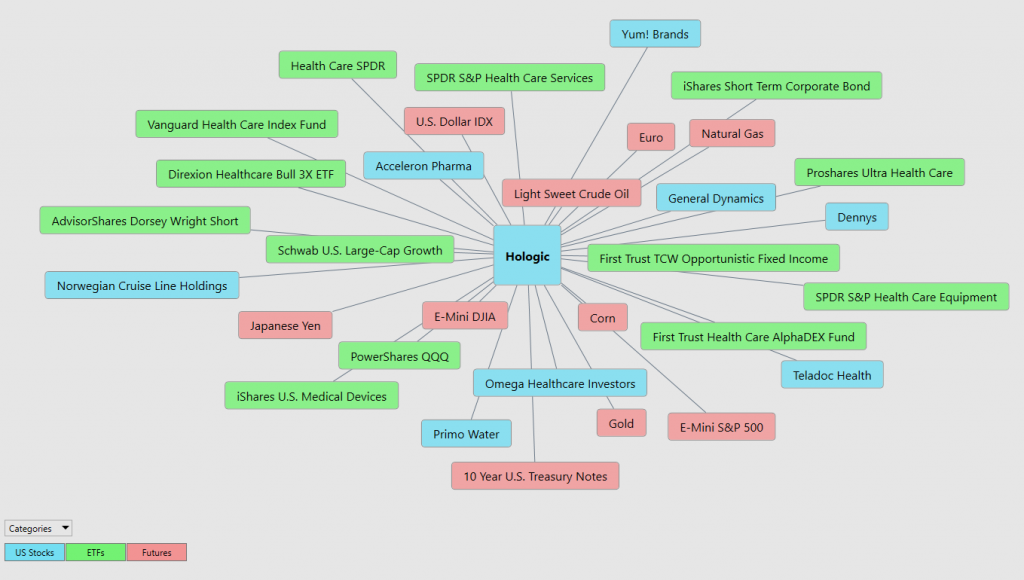
Instead of looking at financial markets or asset classes on an individual basis, intermarket analysis looks at several strongly correlated markets, or asset classes, such as other stocks, currencies, ETFs, and commodities. This type of analysis expands on simply looking at each individual market or asset in isolation by also looking at other markets or assets that have a strong relationship to the market or asset being considered. The VantagePoint software analyzes the top 31 drivers of an assets price. This analysis will often show ETF’s which are big owners of the underlying asset, but it will also uncover other markets which are driving the trend you are analyzing. Traders often find other blossoming opportunities when engaging in Intermarket Analysis.
Our Trading Suggestion
We approach our analysis not from a fundamental valuation perspective but from a pure trader’s viewpoint.
We like the narrative of HOLX a great deal. But so far that story is not being completely verified by the chart. We are still trading below the 52-week high. The stock has been rangebound for the entire year. The current trend is of interest to us, but we do see that the 52-week high at $85 will probably provide some stiff resistance before it is successfully breached. For this reason, we treat this very much like a very short-term trading candidate where we look to buy at the lower end of the daily range forecast and sell when it is overvalued.
The consensus of analysts’ opinions shows that HOLX is fairly valued around $83.50. That is about 4.5% higher than the current price. With the stock currently trading around $80 we think it is a good swing trading candidate and capable of banking a few quick percentage points. We do think the narrative on this stock is potentially explosive, but it will only become that way when the stock successfully breaches its 52-week highs at $85 per share.
HOLX is a laggard with upside potential but as we have seen from the yearly chart it also has the capacity to fall over 15% in a matter of days.
What has worked very well in trading HOLX is to follow the predictive blue line into the earnings calls. In all four instances of the past year, the slope of the blue line determined the trend for 3 weeks post earnings. This simple and practical tactic allowed Power Traders to bank gains without the “buy and hold” mentality which is traditional amongst most traders.
HOLX has an attractive narrative. That narrative will prove to be explosive when it breaches its 52-week range. Until then we consider this to be a short-term opportunity.
In the interim we are buying weakness and scalping this market for quick swing trades until we end up breaching the 52-week highs.
HOLX will need to break to new 52-week highs to confirm to long term value investors that it is the real deal. We have had it on our radar.
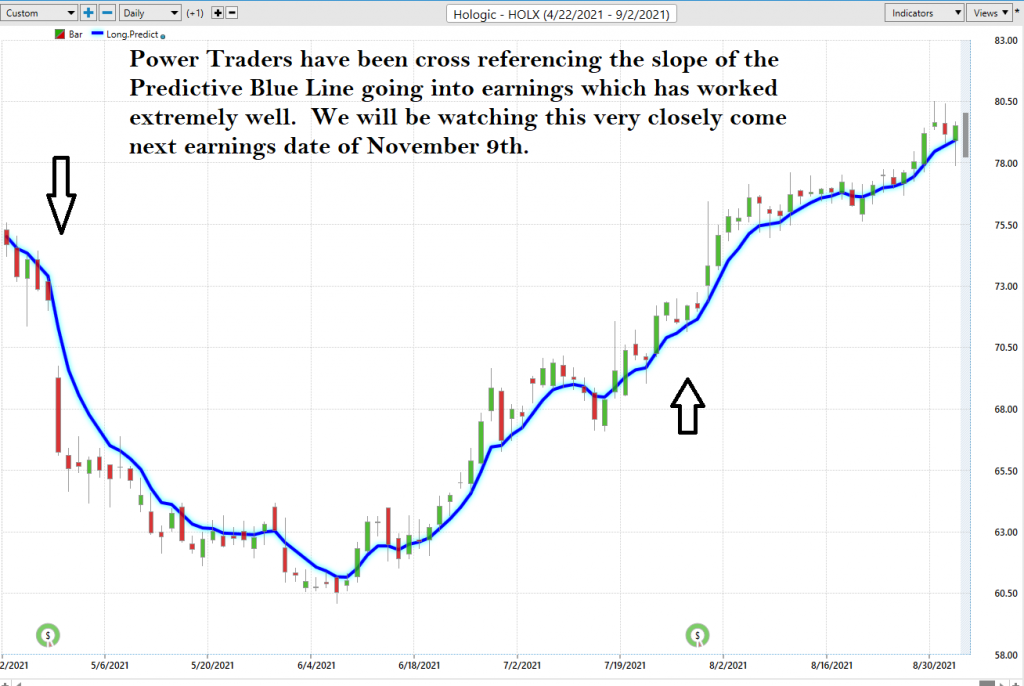
The Vantagepoint A.I. forecast has been very accurate on HOLX. We think it will present us with multiple opportunities over the remainder of 2021 and we are watching it closely as we go into the next earning call on November 9,2021 about 10 weeks away.
We will reevaluate our trading idea based upon daily updates to:
- Wall Street Analysts’ Estimates
- 52-week high and low boundaries
- Vantagepoint A.I. Forecast (Predictive Blue Line)
- Neural Network Forecast
- Daily Range Forecast
- Intermarket Analysis
Let’s Be Careful Out There!
Remember, It’s Not Magic.
It’s Machine Learning.

IMPORTANT NOTICE!
THERE IS SUBSTANTIAL RISK OF LOSS ASSOCIATED WITH TRADING. ONLY RISK CAPITAL SHOULD BE USED TO TRADE. TRADING STOCKS, FUTURES, OPTIONS, FOREX, AND ETFs IS NOT SUITABLE FOR EVERYONE.
DISCLAIMER: STOCKS, FUTURES, OPTIONS, ETFs AND CURRENCY TRADING ALL HAVE LARGE POTENTIAL REWARDS, BUT THEY ALSO HAVE LARGE POTENTIAL RISK. YOU MUST BE AWARE OF THE RISKS AND BE WILLING TO ACCEPT THEM IN ORDER TO INVEST IN THESE MARKETS. DON’T TRADE WITH MONEY YOU CAN’T AFFORD TO LOSE. THIS ARTICLE AND WEBSITE IS NEITHER A SOLICITATION NOR AN OFFER TO BUY/SELL FUTURES, OPTIONS, STOCKS, OR CURRENCIES. NO REPRESENTATION IS BEING MADE THAT ANY ACCOUNT WILL OR IS LIKELY TO ACHIEVE PROFITS OR LOSSES SIMILAR TO THOSE DISCUSSED ON THIS ARTICLE OR WEBSITE. THE PAST PERFORMANCE OF ANY TRADING SYSTEM OR METHODOLOGY IS NOT NECESSARILY INDICATIVE OF FUTURE RESULTS. CFTC RULE 4.41 – HYPOTHETICAL OR SIMULATED PERFORMANCE RESULTS HAVE CERTAIN LIMITATIONS. UNLIKE AN ACTUAL PERFORMANCE RECORD, SIMULATED RESULTS DO NOT REPRESENT ACTUAL TRADING. ALSO, SINCE THE TRADES HAVE NOT BEEN EXECUTED, THE RESULTS MAY HAVE UNDER-OR-OVER COMPENSATED FOR THE IMPACT, IF ANY, OF CERTAIN MARKET FACTORS, SUCH AS LACK OF LIQUIDITY. SIMULATED TRADING PROGRAMS IN GENERAL ARE ALSO SUBJECT TO THE FACT THAT THEY ARE DESIGNED WITH THE BENEFIT OF HINDSIGHT. NO REPRESENTATION IS BEING MADE THAT ANY ACCOUNT WILL OR IS LIKELY TO ACHIEVE PROFIT OR LOSSES SIMILAR TO THOSE SHOWN.

