

Many traders, who are starting out, have a strong believe that swing trading stocks techniques have to be complex to be profitable. I want to reiterate again as I have mentioned many times this is just not true. There is no correlation between complex strategies and profitability.
You may have seen some of my videos where I go into simple strategies and demonstrate how they can be as profitable if not more profitable than complex strategies that take weeks or months to figure out and trade correctly.
I’m a victim of this as well, you probably read my story about how I tried to learn a modified Elliot Wave theory several decades ago. Needless to say the only thing I learned from complex strategies is to keep things as simple as possible.
Today, I’m going to show you one of the best swing trading stocks techniques for managing risk and finding a trending market. This is not a complete strategy, but some pieces of the puzzle to help you understand simple indicators and how useful they can be.
The Moving Average Is the Most Popular Indicator For Swing Trading Stocks Techniques
The tool I’m going to use today is the 40 day exponential moving average. If you’re not familiar with moving averages, they are probably the most used indicator for most swing trading stocks techniques out there.
The moving average is a simple tool that helps us to first define the trend and second, to recognize changes in the trend. The simple moving average is calculated by adding together the closing price for the entire period of data you want to use and dividing that amount by the total days you use.
For example, if you want to calculate a simple moving average for the last 5 trading days, you would add up the closing prices together and divide that number by 5. Fortunately, every technical analysis program has the moving average build in and you don’t need to calculate anything by hand.
There are various types of moving averages, some measure the average of the high price and the low price, some measure the closing price and some use advanced formula’s to put more weight towards the more recent price than the earlier price data.
This type of moving average is called the exponential moving average and this is the one we will be using today. The major advantage of using the exponential moving average over the simple moving average is responsiveness.
The exponential moving average is substantially more responsive then the simple moving average because the formula to calculate the exponential moving average puts more weight on more recent price data, while she simple moving average puts an equal weight to all data in the range.
There are two primary functions that the 40 day exponential moving average helps me with. The first one is to make sure the market is trending. You may recall from earlier tutorials, my advice is to look at the slope of the market and if it’s sloping greater than 20 percent either up or down, it qualifies as a trending market. The 40 day exponential moving average can be used as a replacement for the 20 degree visual analysis.
If you analyze a stock and you see it trading strongly above or below the 40 day ETA (Exponential Moving Average) the odds are that the stock or any other market you are analyzing is trending strongly either up or down. Let’s take a look at a few examples so you can get a feel for analyzing stocks using the 40 day ETA.
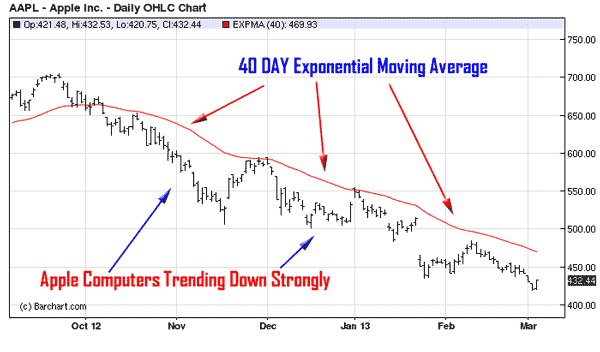
Notice How the 40 Day Exponential Moving Average Follows Trending Markets
The second reason why many professional traders, including myself use the 40 day exponential moving average is because it does a wonderful job when used as a risk indicator or a stop loss indicator when stocks or other markets are beginning to move away from the trend. Let me give you a few examples so you can see what I’m talking about.
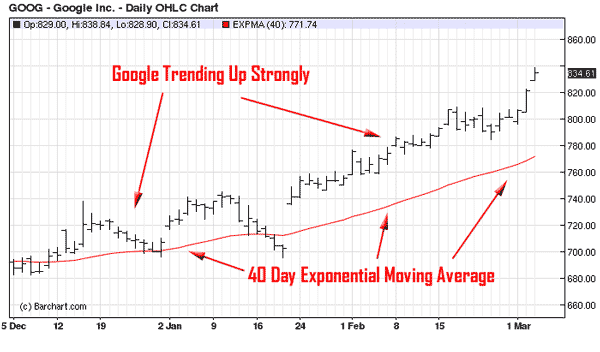
Google Is Rising Sharply While the 40 Day Exponential Moving Average Is Following the Trend
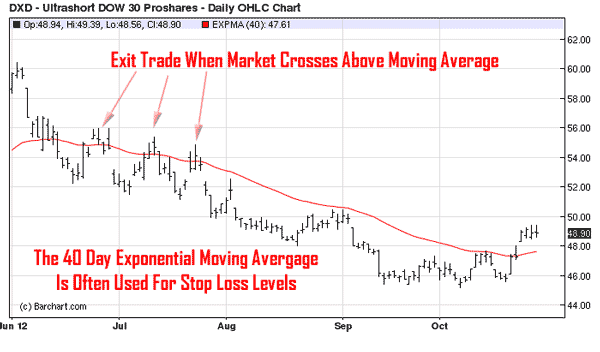
The 40 Day Exponential Moving Average Does A Good Job Catching The Market As It Moves Against The Main Trend Great Indicator For Stop Loss Placement
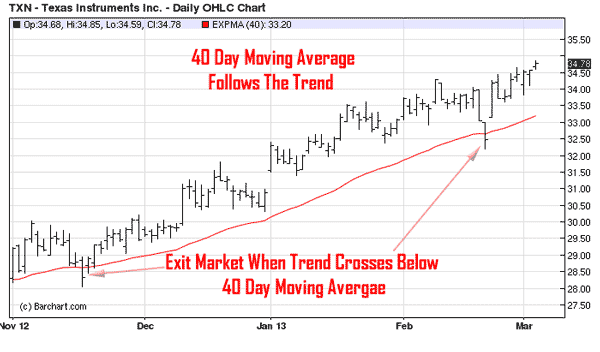
The 40 Day Exponential Moving Average Stops Out Trades As Soon As The Stock Trades Against The Main Trend
Both examples demonstrate the benefit of using the exponential moving average to determine trends and/or stop loss risk levels. This indicator is one of the most important indicators for swing trading stocks techniques. I will demonstrate a complete strategy using these methods in the next few weeks so stay tuned.
Remember, swing trading stocks techniques do not have to be complicated to work effectively and profitably.

IMPORTANT NOTICE!
THERE IS SUBSTANTIAL RISK OF LOSS ASSOCIATED WITH TRADING. ONLY RISK CAPITAL SHOULD BE USED TO TRADE. TRADING STOCKS, FUTURES, OPTIONS, FOREX, AND ETFs IS NOT SUITABLE FOR EVERYONE.
DISCLAIMER: STOCKS, FUTURES, OPTIONS, ETFs AND CURRENCY TRADING ALL HAVE LARGE POTENTIAL REWARDS, BUT THEY ALSO HAVE LARGE POTENTIAL RISK. YOU MUST BE AWARE OF THE RISKS AND BE WILLING TO ACCEPT THEM IN ORDER TO INVEST IN THESE MARKETS. DON’T TRADE WITH MONEY YOU CAN’T AFFORD TO LOSE. THIS ARTICLE AND WEBSITE IS NEITHER A SOLICITATION NOR AN OFFER TO BUY/SELL FUTURES, OPTIONS, STOCKS, OR CURRENCIES. NO REPRESENTATION IS BEING MADE THAT ANY ACCOUNT WILL OR IS LIKELY TO ACHIEVE PROFITS OR LOSSES SIMILAR TO THOSE DISCUSSED ON THIS ARTICLE OR WEBSITE. THE PAST PERFORMANCE OF ANY TRADING SYSTEM OR METHODOLOGY IS NOT NECESSARILY INDICATIVE OF FUTURE RESULTS. CFTC RULE 4.41 – HYPOTHETICAL OR SIMULATED PERFORMANCE RESULTS HAVE CERTAIN LIMITATIONS. UNLIKE AN ACTUAL PERFORMANCE RECORD, SIMULATED RESULTS DO NOT REPRESENT ACTUAL TRADING. ALSO, SINCE THE TRADES HAVE NOT BEEN EXECUTED, THE RESULTS MAY HAVE UNDER-OR-OVER COMPENSATED FOR THE IMPACT, IF ANY, OF CERTAIN MARKET FACTORS, SUCH AS LACK OF LIQUIDITY. SIMULATED TRADING PROGRAMS IN GENERAL ARE ALSO SUBJECT TO THE FACT THAT THEY ARE DESIGNED WITH THE BENEFIT OF HINDSIGHT. NO REPRESENTATION IS BEING MADE THAT ANY ACCOUNT WILL OR IS LIKELY TO ACHIEVE PROFIT OR LOSSES SIMILAR TO THOSE SHOWN.

