

This week’s stock analysis is Microsoft (MSFT).
Microsoft Corporation is an American multinational technology corporation founded by Bill Gates and Paul Allen in 1975. It produces computer software, consumer electronics, personal computers, and related services. Its best-known software products are the Microsoft Windows line of operating systems, the Microsoft Office suite, and the Internet Explorer and Edge web browsers. Its flagship hardware products are the Xbox video game consoles and the Microsoft Surface lineup of touchscreen personal computers. It was the world’s largest software maker by revenue as of 2016. It is considered one of the Big Five companies in the U.S. information technology industry, along with Google, Apple, Amazon, and Facebook.
Much of the world’s computer dependence relies upon Microsoft’s technology to operate. While Microsoft is a long-standing blue-chip stock, it also has quite a few exciting prospects for growth investors. Most recently it has grown revenue by 19% and net income by 44%. Most people are unaware that the company has a web services hosting platform called AZURE that competes directly with Amazon. In 2019, MSFT won a huge U.S. Defense Department contract with the Pentagon. Cloud computing is expected to grow exponentially in this decade which support enthusiasm for MSFT shares. Since MSFT has such strong market share and positioning in software the company is leveraging those customer relationships into Azure by offering huge cost savings when compared directly to Amazon Web Service.
CEO Satya Nadella has embraced cloud computing and a recurring revenue business model.
However, Microsoft (MSFT) is also growing its huge market share in the gaming niche. Microsoft’s Xbox Game Pass acts like a Netflix for Xbox, allowing gamers unlimited downloads from a huge digital library of popular online games for a low monthly fee. The Game Pass service has attracted over 23 million subscribers and is increasing by about 600,000 subscribers per month.
Lastly, Microsoft is the owner of LinkedIn which is a very respectable professional social network which as of yet remains largely unmonetized.
Walls Street is very focused and continuously comparing the market capitalization of Microsoft to Apple. Currently, Microsoft (MSFT) has a market cap of 2.276 trillion. Meanwhile, Apple has a market cap of 2.473 trillion. Microsoft’s recurring revenue have many on Wall Street believing that it has a slight edge over Apple in becoming the first stock to hit a market cap of $3 trillion.
Microsoft has decided to increase the price of its Microsoft 365 products. The increases in price will range from as low as 8.6% to as high as 25% and will take effect in March 2022. Microsoft Office commercial and cloud products make up a large portion of Microsoft’s revenue, and investors are enthusiastic about the extra income that will support the bottom line.
Many believe that in the currently realm of cyber attacks and cyber security that Microsoft (MSFT) will benefit greatly through its focus on the cloud and increased security on its general product and service offerings. Skeptics are quick to point out that with every new upgrade the MSFT offers it creates new and unknown vulnerabilities that can adversely affect companies’ infrastructure.
In this weekly stock study, we will look at and analyze the following indicators and metrics which are our guidelines which dictate our behavior in deciding whether to buy, sell, or stand aside on a particular stock.
- Wall Street Analysts’ Estimates
- Best Case – Worst Case Scenarios for the past year
- 52-week high and low boundaries
- Vantagepoint A.I. Forecast (Predictive Blue Line)
- Neural Network Forecast
- Daily Range Forecast
- Intermarket Analysis
- Our trading suggestion
We don’t base our trading decisions on things like earnings or fundamental cash flow valuations. However, we do look at them to better understand the financial landscape that a company is operating under.
Wall Street Analysts’ Estimates of Microsoft (MSFT)
Based on 26 Wall Street analysts offering 12-month price targets for Microsoft in the last 3 months. The average price target is $326.92 with a high forecast of $411.00 and a low forecast of $275.00. The average price target represents a 7.89% change from the last price of $303.00.
This tells us that according to broad Wall Street standards the company is still slightly undervalued.
Best Case – Worst Case Scenarios from the last year
The worst-case drawdown in the stock occurred on September 2, 2020. Had you bought at that peak it was trading at 231.72 and 13 days later it dropped 14.5% for a loss of $33.71 per share.
The best-case scenario occurred if you had been lucky enough to acquire MSFT on 9/21/20 at $196.25 where you could have purchased it at its 52 weeks low and the stock has rallied $115 since then.
Overall, for the past year, the stock has had a strong upward bias. Purchasing the stock on any pullback of 7% to 8% from its most recent high has been a very successful strategy. While we don’t advocate buying on sharp pullbacks when we study a chart, we perform this type of best case/worst case scenario to outline the possibilities of its past price action.
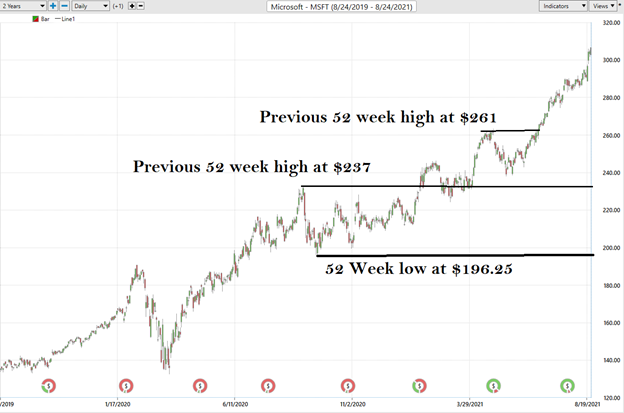
52-Week High and Low Boundaries
Looking at the Long-Term chart of MSFT provides us with the 52-week high and low boundaries.
Over the past year we have seen MSFT trade as low as $196.25 and as high as $305.84. This tells us that the average weekly trading range for MSFT is $2.10.
We look to amplify this value greatly when trading with the artificial intelligence.
We strongly urge traders and investors to pay very close attention to these boundaries on the price chart. In an uptrend whenever the 52-week high price is successfully breached it is very common for the price of the underlying asset to often move substantially higher over a very short period of time.
Over the past year we have seen MSFT successfully challenge and close above its 52-week high numerous times as it marched higher.
Currently, the stock is trading at its yearly highs.
Vantagepoint A.I. Forecast (Predictive Blue Line)
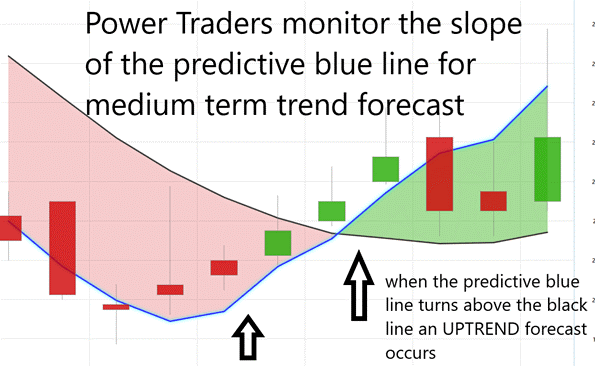
On the following chart you will see the power of the VantagePoint Predictive blue line which determines the medium term trend price forecast.
The guidelines we abide by are as follows:
- The slope of the predictive blue line determines the trend and general direction of MSFT
- Ideally, the VALUE ZONE is determined to try and buy the asset at or below the predictive blue line.
When you study this chart, one of the strategies that Power Traders have been utilizing to trade Microsoft (MSFT) is to wait for the predictive blue line to slope positive after an earnings announcement. Over the past year this has been a very effective way for medium term swing traders and longer-term investors to positions themselves on the long side of this asset.
Naturally when the predictive blue line slopes lower traders would be anticipating lower prices and either moving to the sidelines or hedging their positions with options.
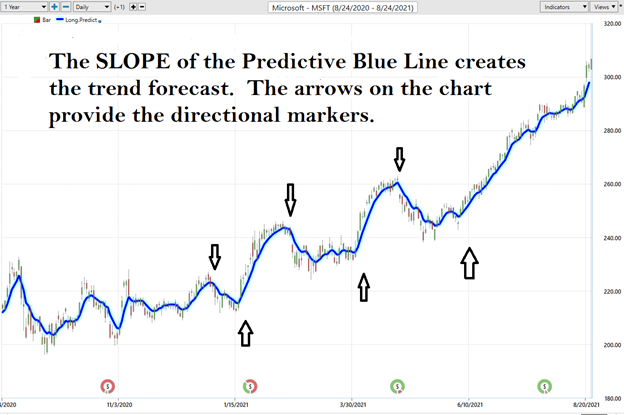
Using VantagePoint Software and the artificial intelligence, traders are alerted to trend forecasts by monitoring the slope of the predictive blue line.
The arrows on the chart provide directional markers as to when the trend forecast changed. You can see that the holding time for a trade using just this indicator can be from a few days to a few weeks.
The predictive blue line, however, utilizes the VantagePoint-patented Neural Network and Intermarket Analysis to arrive at its value. It looks at the strongest price drivers of an asset through artificial intelligence and statistical correlations to determine its value.
This price volatility is ideal for SWING traders who can exploit the upside without having to experience the steep declines of holding on to an investment during a big drawdown.
Neural Network Indicator (Machine Learning) of Microsoft (MSFT)
At the bottom of the chart is the Neural Network Indicator which predicts future short-term strength and/or weakness in the market. When the Neural Net Indicator is green it communicates strength. When the Neural Net is Red it is forecasting short term weakness in the market. When it is yellow it is anticipating sideways prices.
A Neural Net is a computational learning system that uses a network of functions to understand and translate massive amounts of data into a desired output, consistently monitoring itself and improving its performance.
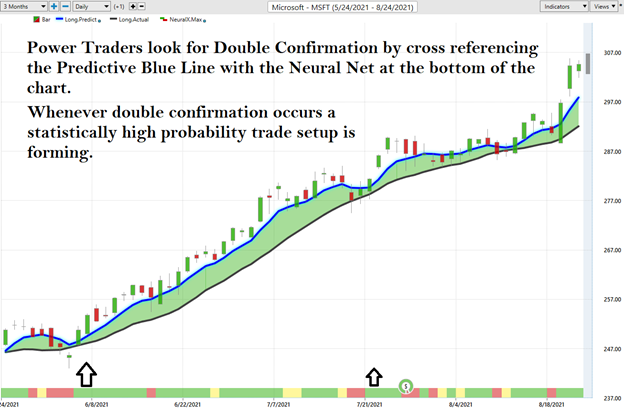
We advocate that Power Traders cross reference the chart with the predictive blue line and neural network indicator to create optimal entry and exit points.
Traders look for confirmation on the NeuralNet to position themselves LONG or SHORT in the market. In other words, when the A.I. forecast is green, and The Neural Net is green, that presents a buying opportunity.
The inverse is also true, when the A.I. forecast is red and the Neural Net is red, that is a SELLING opportunity. The arrows on the chart below highlight the trading zones where Power Traders would’ve been using double confirmation to BUY in cross referencing the A.I. forecast with the NeuralNet.
Power Traders are always looking to apply both the Neural Network and A.I. to the markets to find statistically sound trading opportunities.
VantagePoint Software Daily Price Range Prediction of Microsoft (MSFT)
One of the powerful features in the VantagePoint Software which Power Traders use on a daily basis is the Price Range prediction forecast.
This forecast is what permits Power Traders to truly fine tune their entries and exits into the market.
Every day traders are faced with the anxiety and frustration of wondering where they should be looking to buy and sell the market. VantagePoint’s A.I. makes this decision super easy with the Daily Price Range Forecast.
For short term traders the important question that they have to confront every day is where should I buy? Where should I place my stop? Where should I sell? The Vantagepoint Daily Price Range forecast answers this question with precision.
Here is the price chart of MSFT during the most recent three-month run up featuring the Daily Price Range forecast with the Neural Net Indicator.
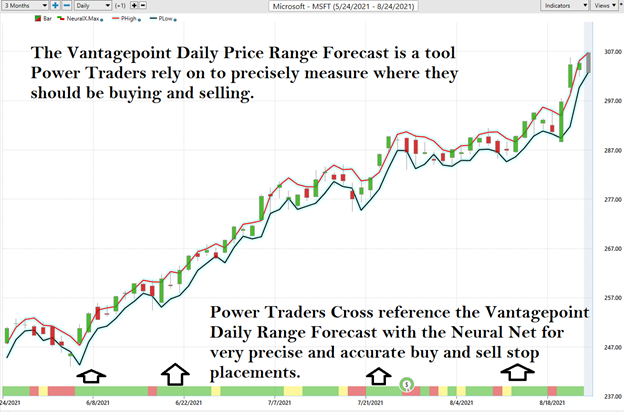
This chart helps traders decide where stop placement should occur. Observe how placing protective sell stops below the dark line on the chart was a powerful way to minimize risk on this trade.
See how the upper and lower bands of the price range forecast for a very clear channel of trading activity as well. Swing traders are always looking to buy towards the bottom of the predicted channel and try to sell above the top band.
Intermarket Analysis
Power lies in the way we respond to the truth we understand.
One of the supremely important questions in trading is what is driving the price? Headlines often create interesting narratives. But these “stories” only capture the imagination. Traders want and need to understand the cause and effect of price movement.
The only way to get an answer to this important question is through intermarket analysis which looks at statistical price correlations of assets.
We live in a global marketplace.
Everything is interconnected.
Interest rates, Crude Oil Prices, and the volatility of the Dollar amongst thousands of other variables affect the decisions companies must make to flourish and prosper in these very challenging times. Trying to determine what these factors are is one of the huge problems facing investors and traders.
You always have a choice. You can tune in to the talking heads in the media who spin talking points which promote fear. Or you can rely on facts to base your decision making on.
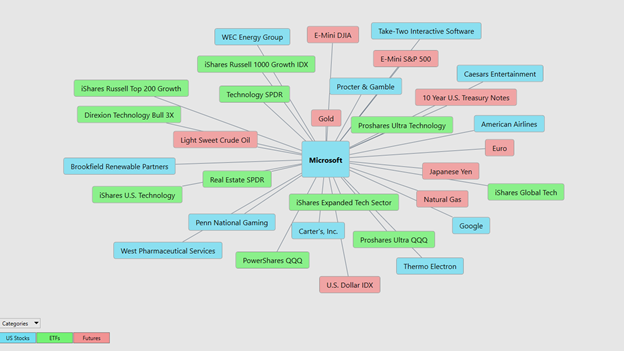
Within the following Intermarket Analysis graphic, you will see the 31 markets that are the key drivers to MSFT’s price.
There is great value to be had in studying and understanding the key drivers of MSFT’s price action. This graphic provides a microcosmic view of what factors have been driving MSFT higher.
Power Traders will often discover trading opportunities in other assets which have been trending very similarly to Microsoft (MSFT) by studying the intermarket analysis.
Trading Suggestion on Microsoft (MSFT)
MSFT is currently trading at about 34.5 times earnings. Its next earnings call is scheduled for around October 27, 2021. With the stock trading at its yearly high it takes courage to buy – so we encourage traders to study options tactics that can create a very positive expectation of profit.
We are not long-term investors and are shorter term traders.
The broader market indexes over the last 9 months have only had three instances where the broader market pulled back 4% or greater.
The trend in MSFT is firmly UP. As the chart has indicated we like the idea of buying 6% to 8% pullbacks in the stock in a risk managed trade.
Our favorite options tactics at present are:
- Buying out of the money calls
- Selling at the money puts
- Selling Put Credit Spreads and collecting premium
- Creating synthetic long positions by purchasing calls and selling puts simultaneously.
Risk management is vital whenever you are trading so make sure you are practicing good money management.
Our recommendation is to follow the A.I. trend analysis as outlined in this stock study and practice good money management on all trades.
We will re-evaluate based upon:
- New Wall Street Analysts’ Estimates
- New 52-week high boundaries
- Vantagepoint A.I. Forecast (Predictive Blue Line)
- Neural Network Forecast
- Daily Range Forecast
Let’s Be Careful Out There!
It’s Not Magic.
It’s Machine Learning.

IMPORTANT NOTICE!
THERE IS SUBSTANTIAL RISK OF LOSS ASSOCIATED WITH TRADING. ONLY RISK CAPITAL SHOULD BE USED TO TRADE. TRADING STOCKS, FUTURES, OPTIONS, FOREX, AND ETFs IS NOT SUITABLE FOR EVERYONE.
DISCLAIMER: STOCKS, FUTURES, OPTIONS, ETFs AND CURRENCY TRADING ALL HAVE LARGE POTENTIAL REWARDS, BUT THEY ALSO HAVE LARGE POTENTIAL RISK. YOU MUST BE AWARE OF THE RISKS AND BE WILLING TO ACCEPT THEM IN ORDER TO INVEST IN THESE MARKETS. DON’T TRADE WITH MONEY YOU CAN’T AFFORD TO LOSE. THIS ARTICLE AND WEBSITE IS NEITHER A SOLICITATION NOR AN OFFER TO BUY/SELL FUTURES, OPTIONS, STOCKS, OR CURRENCIES. NO REPRESENTATION IS BEING MADE THAT ANY ACCOUNT WILL OR IS LIKELY TO ACHIEVE PROFITS OR LOSSES SIMILAR TO THOSE DISCUSSED ON THIS ARTICLE OR WEBSITE. THE PAST PERFORMANCE OF ANY TRADING SYSTEM OR METHODOLOGY IS NOT NECESSARILY INDICATIVE OF FUTURE RESULTS. CFTC RULE 4.41 – HYPOTHETICAL OR SIMULATED PERFORMANCE RESULTS HAVE CERTAIN LIMITATIONS. UNLIKE AN ACTUAL PERFORMANCE RECORD, SIMULATED RESULTS DO NOT REPRESENT ACTUAL TRADING. ALSO, SINCE THE TRADES HAVE NOT BEEN EXECUTED, THE RESULTS MAY HAVE UNDER-OR-OVER COMPENSATED FOR THE IMPACT, IF ANY, OF CERTAIN MARKET FACTORS, SUCH AS LACK OF LIQUIDITY. SIMULATED TRADING PROGRAMS IN GENERAL ARE ALSO SUBJECT TO THE FACT THAT THEY ARE DESIGNED WITH THE BENEFIT OF HINDSIGHT. NO REPRESENTATION IS BEING MADE THAT ANY ACCOUNT WILL OR IS LIKELY TO ACHIEVE PROFIT OR LOSSES SIMILAR TO THOSE SHOWN.

