
Nio is a Chinese Electric Vehicle (EV) manufacturer founded in 2014, initially under the name NextEV. The company is headquartered in Shanghai and has design and engineering centers in San Jose, Munich, and London. In 2019, Nio ranked as the world’s sixth-largest seller of EVs. Today it is #10.
Nio manufactures a range of EVs, including the ES8 SUV which has a range of over 500km. The NIO EP9 sports car set a record for the fastest lap time at the Nürburgring racetrack. The company has created a lot of publicity lately because of this success. The NIO Electric hypercar completed the lap in 6 minutes and 45.9 seconds, beating the previous record holder – the Porsche 911 GT2 RS – by over five seconds. This achievement is more impressive when you consider that the Nio weighs nearly two tonnes; the Porsche, by contrast, weighs just over 1.5 tonnes. So how did Nio manage to set such a fast time? The key lies in its average speed. During the lap, the Electric hypercar reached speeds of up to 170 mph. In comparison, the Porsche’s top speed was just shy of 160 mph. This extra speed is what allowed Nio to take home the record. Who knows how long it will hold onto it? But for now, at least, Nio can lay claim to being the fastest car around the Nürburgring.
The company also has plans to develop autonomous vehicles.
In 2018, Nio completed a successful initial public offering on the New York Stock Exchange, becoming the first Chinese EV manufacturer to list its shares on a major global stock exchange. Nio’s share price has been highly volatile since its listing, but the company has managed to raise billions of dollars through equity and debt financing round to fund its expansion plans.
Nio faces stiff competition from established automakers such as Tesla, BMW, and Volkswagen Group, who are all making significant investments in EVs. However, Nio has managed to gain a loyal following among Chinese consumers and is currently working on expansion into the European market with its ET5 electric sedan due for delivery in September 2022.
More recently, some Wall Street analysts and researchers claim that Nio revenue and net income has been wrongfully inflated by almost 10% and 95% respectively, these accusations have been responsible for tremendous volatility in the underlying stock.
When considering whether to invest or to trade in a stock, there are a number of factors to consider. The company has experienced rapid growth in recent years, but it is still unprofitable, and its share price is highly volatile. Investment in NIO is therefore speculative and carries a high degree of risk. Another crucial factor to consider is the stock’s value relative to other companies in the same industry. NIO’s market capitalization is currently around $37.5 billion, making it one of the largest electric vehicle manufacturers in the world. However, its share price is still relatively low compared to other major automakers such as Tesla, which has a market cap of over $723 billion. This could imply that NIO’s stock is undervalued and may be worth buying now as an investment. However, it is also worth noting that the electric vehicle market is new and unpredictable, so any investment should be made with caution.
In this weekly stock study, we will look at and analyze the following indicators and metrics which are our guidelines which dictate our behavior regarding a particular stock.
- Wall Street Analysts’ Estimates
- 52-week high and low boundaries
- Vantagepoint A.I. forecast
- The Best Case – Worst Case Scenarios
- Neural Network Forecast
- Daily Range Forecast
- Intermarket Analysis
- Our trading suggestion
We don’t base our trading decisions on things like earnings or fundamental cash flow valuations. However, we do look at them to better understand the financial landscape that a company is operating under.
Wall Street Analysts’ Estimates
Based on Top Wall Street analysts offering 12-month price targets for Nio in the last 3 months. The average price target is $40.37 with a high forecast of $48.00 and a low forecast of $32.00. The average price target represents an 80.55% change from the last price of $22.36.
While these estimates are optimistic, we will look at them within the context of the artificial intelligence forecast. NIO has attracted a huge, short selling attack by traders who do not believe the publicity that the company is generating. This is remarkably like the growing pains that TESLA went through over the years. Short sellers are claiming the company is inflating its balance sheet and projections with highly creative accounting. This factor alone explains the incredible volatility that NIO has.
We will watch these Wall Street estimates very closely and would advise that you do as well.
52-Week High and Low Boundaries
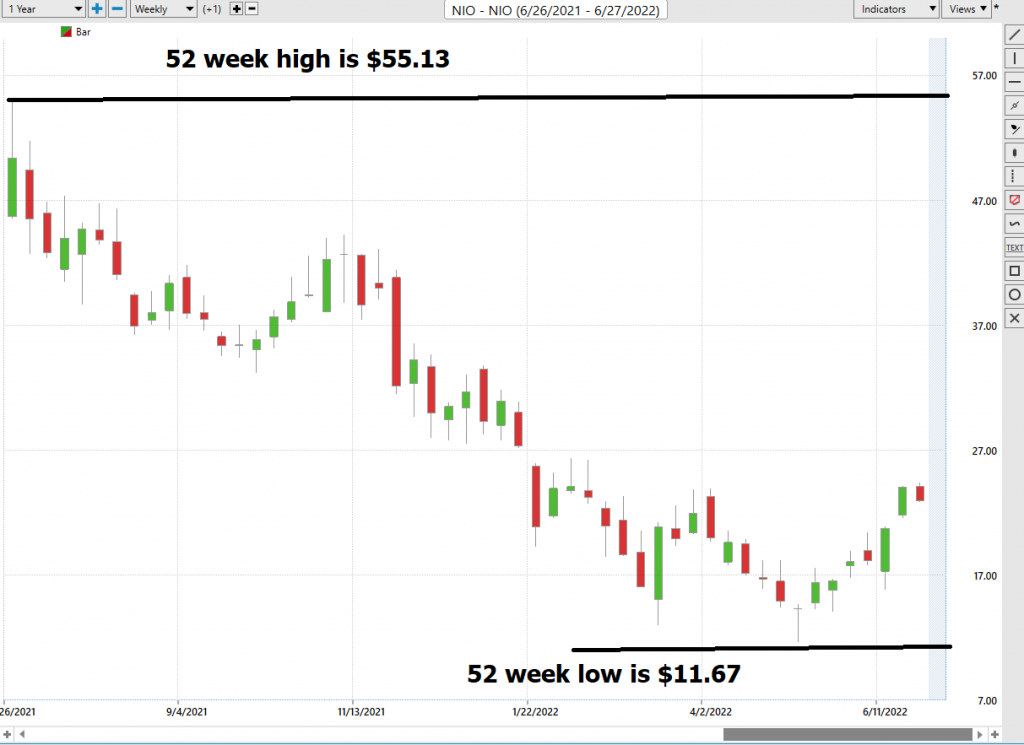
Over the past year we have seen $NIO trade as low as $11.67 and as high as $55.13. This tells us that the annual trading range is $43.46.
When we divide the annual trading range by 52 weeks, we produce an expected weekly trading range of .84. The stock is currently trading at it 25th percentile of its annual trading range.
This is the most volatile stock that we have ever covered. In other words, be quick to head for the exits when you trade NIO as its volatility needs to be respected.
Here is the annual 52-week chart of $NIO so that you can see the powerful price journey it has taken over the last year.
What we find incredibly useful and practical is to be very aware of the trading ranges for the weekly, monthly and quarterly time frames. The trading ranges for those time frames provide excellent volatility benchmarks that traders can use to know what the market has offered during that period. A good rule of thumb is that if a stock is offering you X amount over a given time frame, a good trader should target 40% to 50% of that amount. A common mistake that many
What we find incredibly useful and practical is to be very aware of the trading ranges for the weekly, monthly and quarterly time frames. The trading ranges for those time frames provide excellent volatility benchmarks that traders can use to know what the market has offered during that period.
A good rule of thumb is that if a stock is offering you X amount over a given time frame, a good trader should target 40% to 50% of that amount. A common mistake that many traders make is they target more than the market is offering and stay in a position far too long.
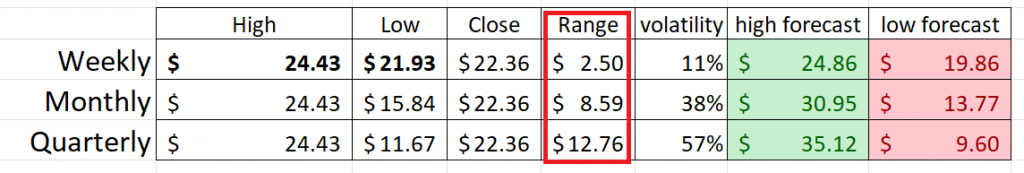
For example over the past weeks the NIO trading range has been $2.50. From this value we can assume that if the future plays out like the past that the maximum weekly trading range is 2.5 points. That is the difference between the high and the low of the last 5 trading sessions. If you were planning on trading NIO for the next week, you would need to be aware of that value.
The table below adds and subtracts the trading range to the CLOSE to arrive at the forecasted values. These values are simply broad volatility benchmarks calculated so that traders become obsessed with the trading ranges for the following time frames.
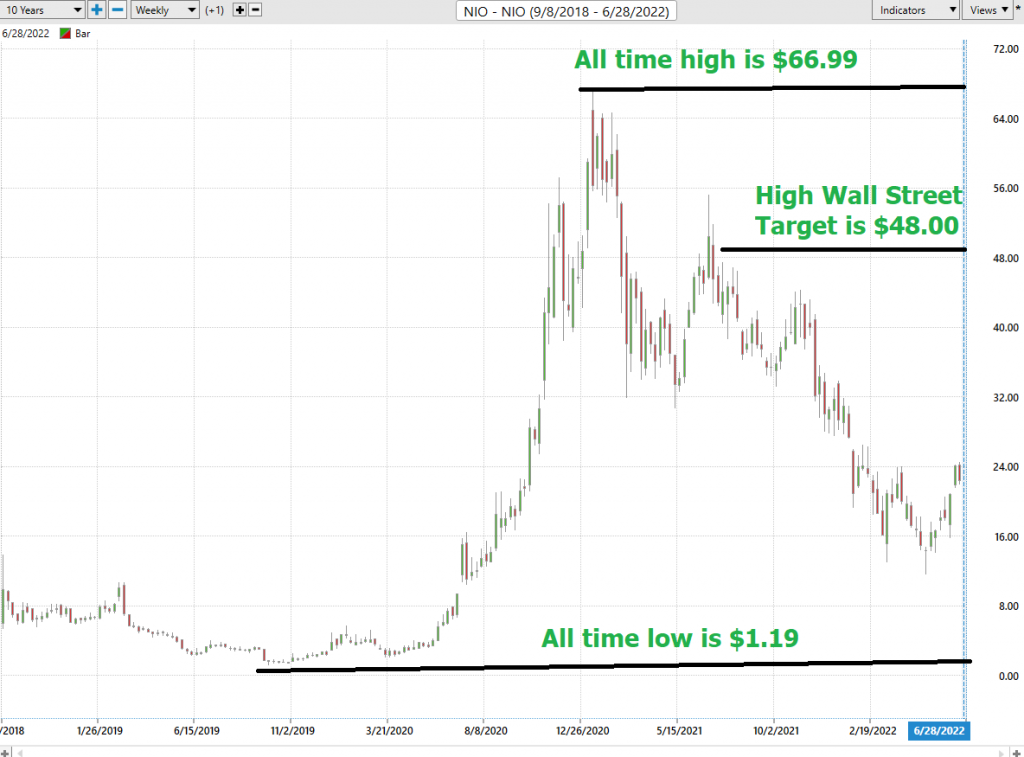
Next, we look at $NIO in the context of its long-term chart. NIO went public in September 2018 at $9.90 per share. Since that time frame it has traded as high as $66.99 and as low as $1.71. It is currently trading right at its 50th percentile on the long-term annual chart.
Now we compare $NIO to other opportunities in the broader market indexes.
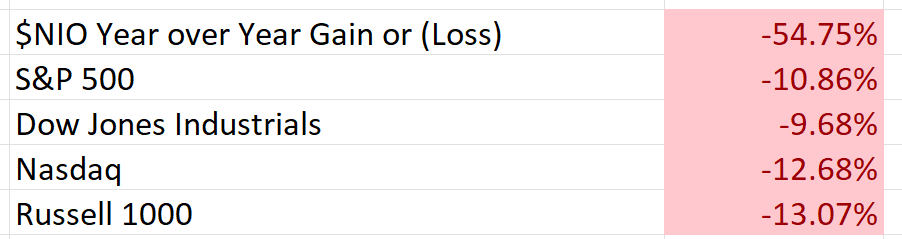
So, in $NIO we have an asset that has performed much worse than the broader stock market indexes. With significantly higher volatility.
Best Case – Worst Case Scenario
But we also want to get an idea of the best case and worst-case scenarios have been in the asset. We refer to this as the best case versus worst case analysis.
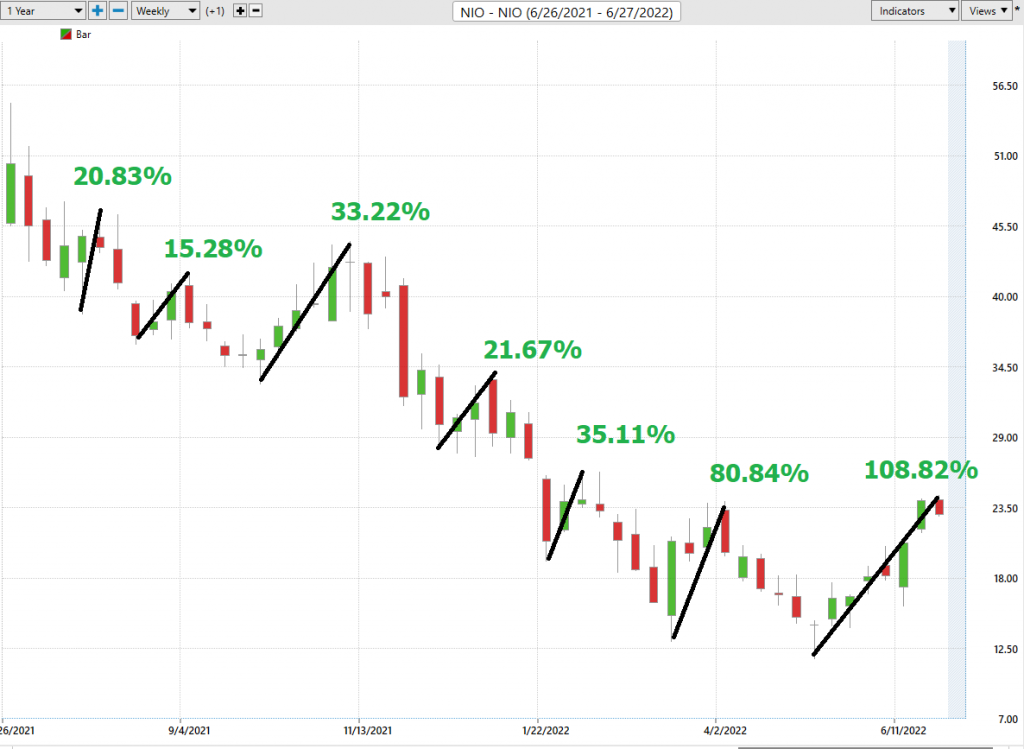
To get an idea of the risk and reward we simply mark on the chart any rally and decline of 10% or greater. These values are the ranges between the low and the high price.
The following charts are helpful in distilling and defining the volatility of this asset.
Here is the best-case analysis which clearly shows that as a trading vehicle, $NIO has had numerous rallies within its broader decline.
Next, we look at the declines in $NIO over the same period to form our worst-case analysis.
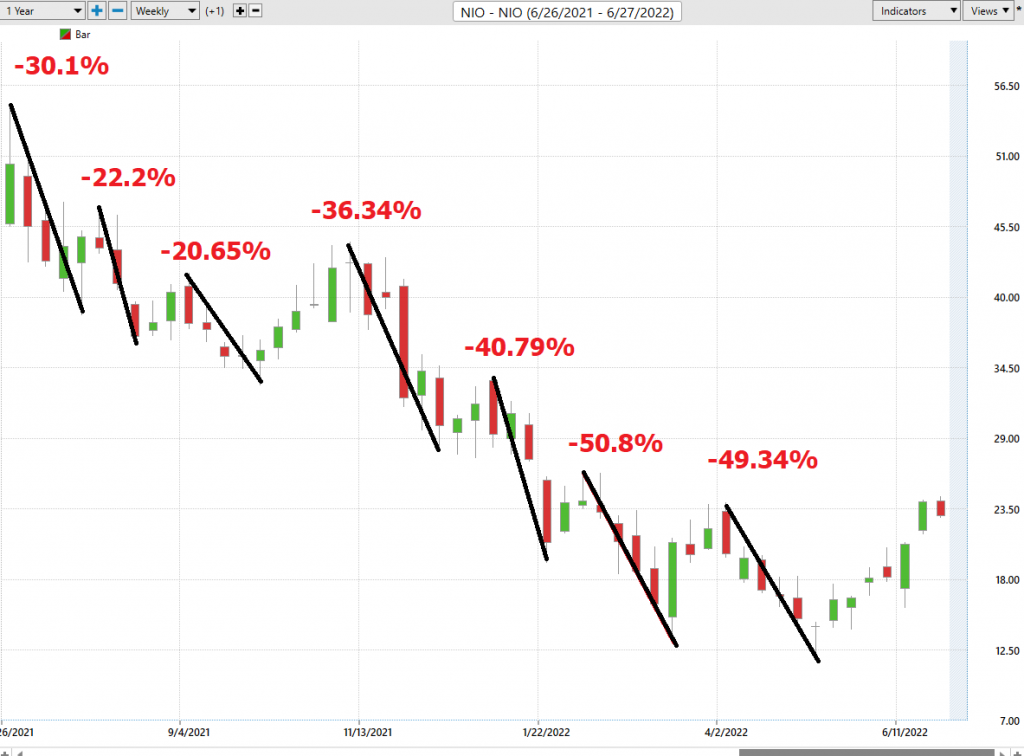
As a trading vehicle $NIO is a wonder to behold. You can quickly see that ALL these percentages were accomplished within a period of a few weeks. The value of this type of analysis is that it provides a very realistic expectation of what you can expect moving forward.
The long and short of this analysis demonstrates that $NIO is a hit and run trading candidate. This is because of how quickly it alters its directional bias.
The Vantagepoint A.I. Analysis
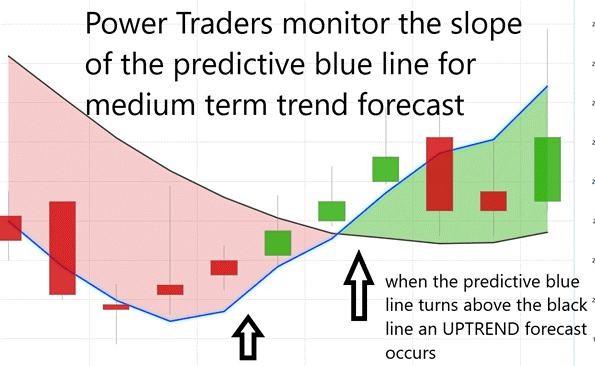
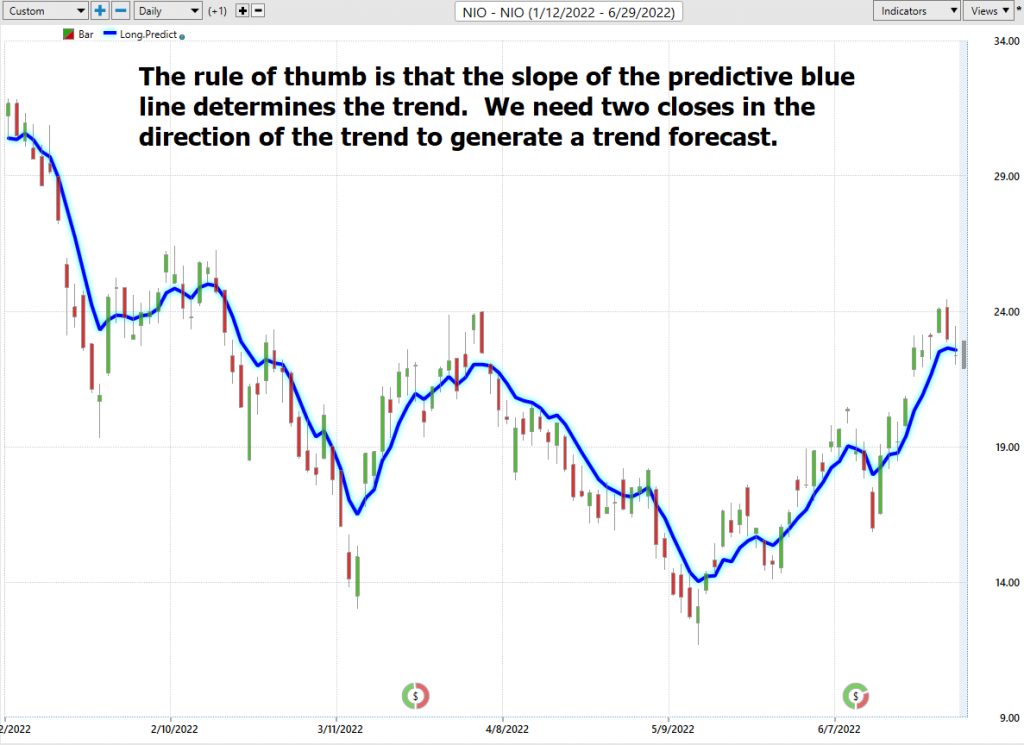
Let’s do some basic trend forecasting analysis based upon looking at the VantagePoint predictive blue line over the last year. On the following chart you will see the power of the VantagePoint Predictive blue line which determines the medium term trend price forecast.
The guidelines we abide by are as follows:
- The slope of the predictive blue line determines the trend and general direction of $NIO
- When the blue line turns above the black line an UP opportunity occurs
- When the blue line turns below the black line a DOWN opportunity occurs
- Ideally, the VALUE ZONE is determined to try and buy the asset at or below the predictive blue line
This is the power and effectiveness of the Vantagepoint A.I. forecast in assisting traders to stay on the right side of the trend at the right time.
The predictive blue line is the initial indicator which Power Traders use to monitor and navigate the trend.
On the following chart you can see the maximum performance results in simply using the a.i. forecast to generate your trading opportunity.
There are 6 trading opportunities:
#1 – short for +12.3%
#2 – long for -10.9% (losing trade)
#3 – short for 10.6%
#4 – long for .63%
#5 – short for +22.4%
#6 – long for 53.06%
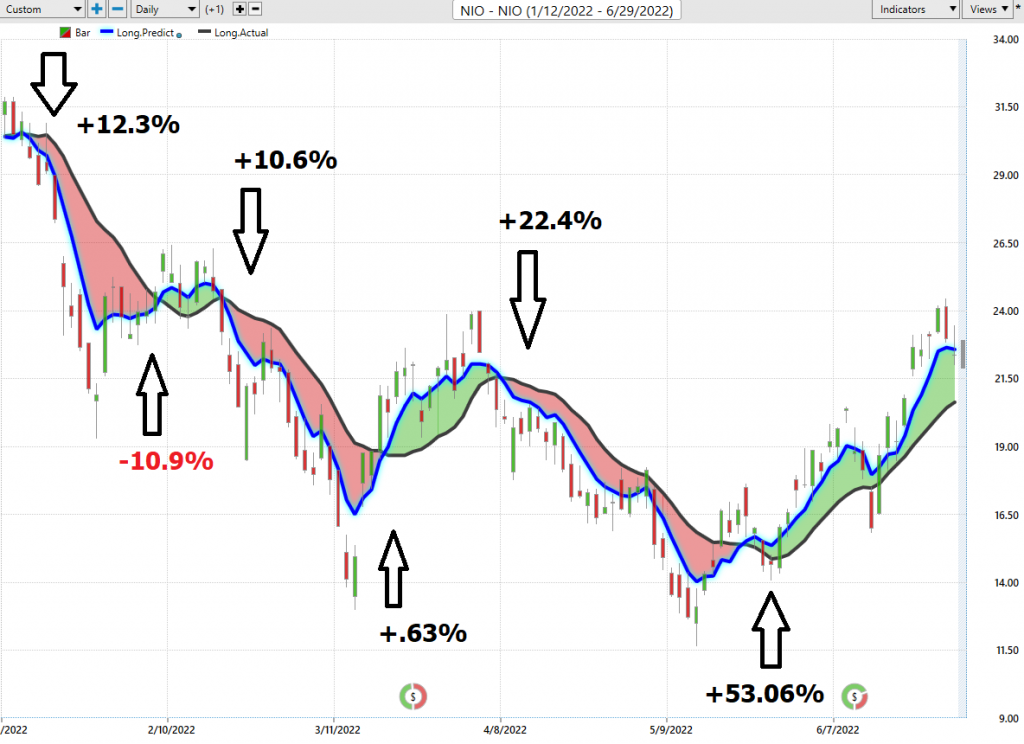
The maximum available gains on these 6 trading opportunities amounted to 88.09%.
Next traders cross-reference this signal with the historical pattern recognition available with machine learning.
Neural Network Indicator (Machine Learning)
At the bottom of the chart is the Neural Network Indicator which predicts future short-term strength and/or weakness in the market. When the Neural Net Indicator is green it communicates strength. When the Neural Net is red it is forecasting short term weakness in the market.
A neural network is a computing system that is modeled after the brain. neural networks are composed of input nodes, output nodes, and hidden nodes. Input nodes receive information from the outside world, while output nodes send information to the outside world. Hidden nodes are neither input nor output nodes; rather, they process information internally. neural networks learn by adjusting the weights of the connections between the nodes. The stronger the connection between two nodes, the more influential that connection is. neural networks can be used for a variety of tasks, including pattern recognition and data classification.At its essence, a Neural Net is a computational learning system that uses a network of functions to understand and translate massive amounts of data
into a desired output, consistently monitoring itself and improving its performance.
Whenever Power Traders are looking for statistically valid trading setups, they look for a DOUBLE confirmation signal. This signal occurs whenever the blue predictive line and the Neural Net at the bottom of the chart suggest the same future expected outcome.
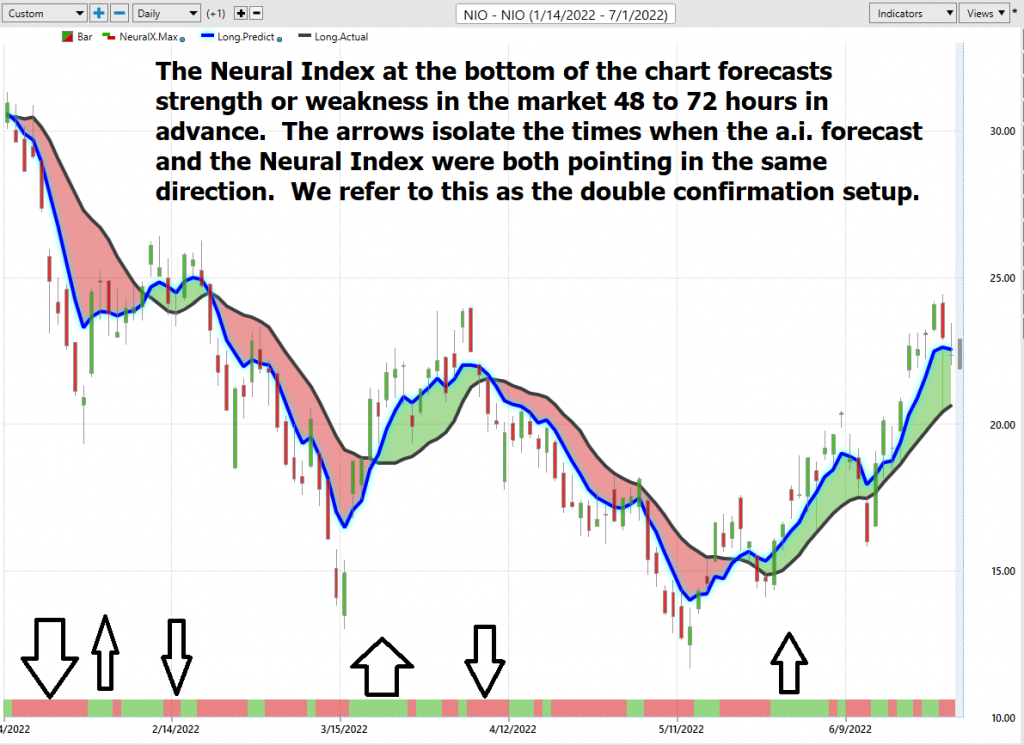
We advocate that Power Traders cross-reference the chart with the predictive blue line and neural network indicator to create optimal entry and exit points.
Traders look for confirmation on the Neural Net to position themselves for LONG or SHORT opportunities in the market. In other words, when the A.I. forecast is green, and The Neural Net is green, that presents a buying opportunity.
The inverse is also true, when the A.I. forecast is red and the Neural Net is red, that is a selling opportunity. The arrows on the chart below highlight the trading zones where Power Traders would’ve been using double confirmation to find a buying opportunity in cross-referencing the A.I. forecast with the Neural Net.
Power Traders are always looking to apply both the Neural Network and A.I. to the markets to find statistically sound trading opportunities.
VantagePoint Software Daily Price Range Prediction
One of the powerful features in the VantagePoint Software which Power Traders use daily is the Price Range prediction forecast.
This forecast is what permits Power Traders to truly fine tune their entries and exits into the market.
Every day traders are faced with the anxiety and frustration of wondering where they should be looking for opportunities to buy and sell the market. VantagePoint’s A.I. makes this decision super easy with the Daily Price Range Forecast. This is where the rubber meets the road.
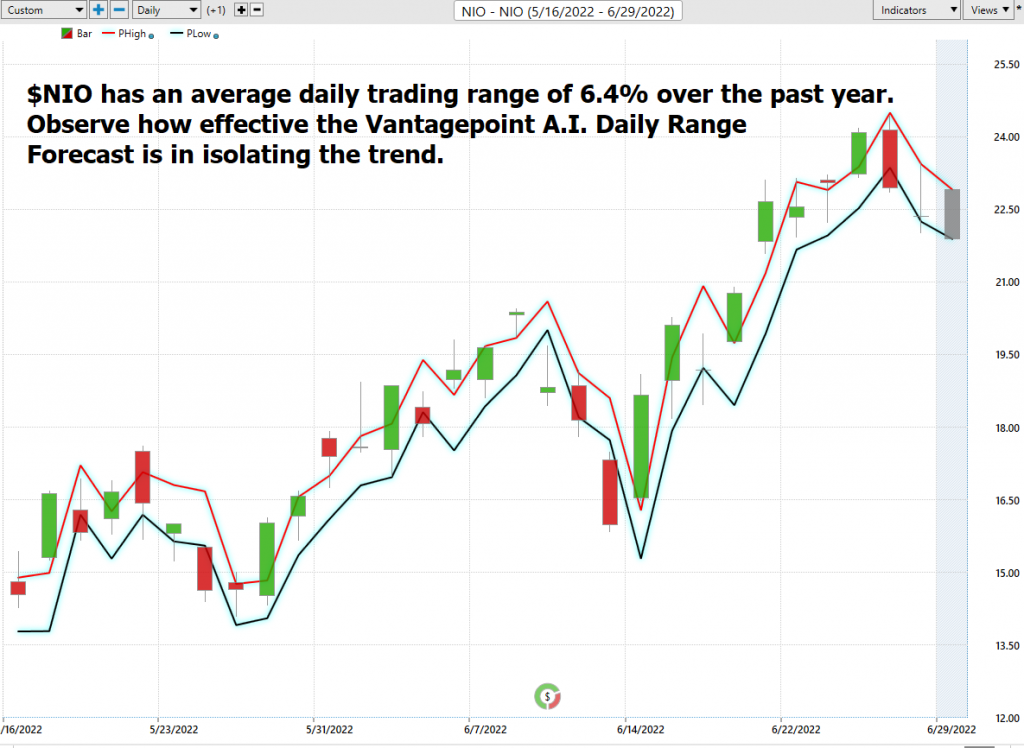
- Over the past year the maximum daily trading range on $NIO was 17.2% which occurred on 5/5/22.
- The smallest daily trading range occurred on 9/17/21 and was 1.6% of the closing price.
- The average daily trading range in $NIO over the past year has been 6.4%.
This is some serious volatility. Here is the price chart of $NIO during the most recent uptrend. The software very clearly delineates the daily forecast by providing an exact lower and upper boundary and delineates the trend.
Many factors can affect the daily price range of stocks, from global political events to the weather. As a result, forecasting the daily price range is a complex task that requires careful analysis. There are a number of methods that can be used to forecast daily price ranges, including technical analysis, fundamental analysis, and news-based analysis. Technical analysis involves studying past price movements to identify patterns that may provide clues about future price behavior. Fundamental analysis focuses on economic indicators such as company earnings and interest rates. News-based analysis involves tracking breaking news stories that could have an impact on the stock market. Vantagepoint A.I. uses a proprietary algorithm that combines the power of a.i., neural networks and machine learning to provide a daily price range forecast. By using a combination of these methods, it is possible to develop a more accurate forecast of the daily stock market price range.
$NIO is a fasten your seatbelts type of trading opportunity. It is not for the faint of heart.
Intermarket Analysis
Power lies in the way we respond to the truth we understand.
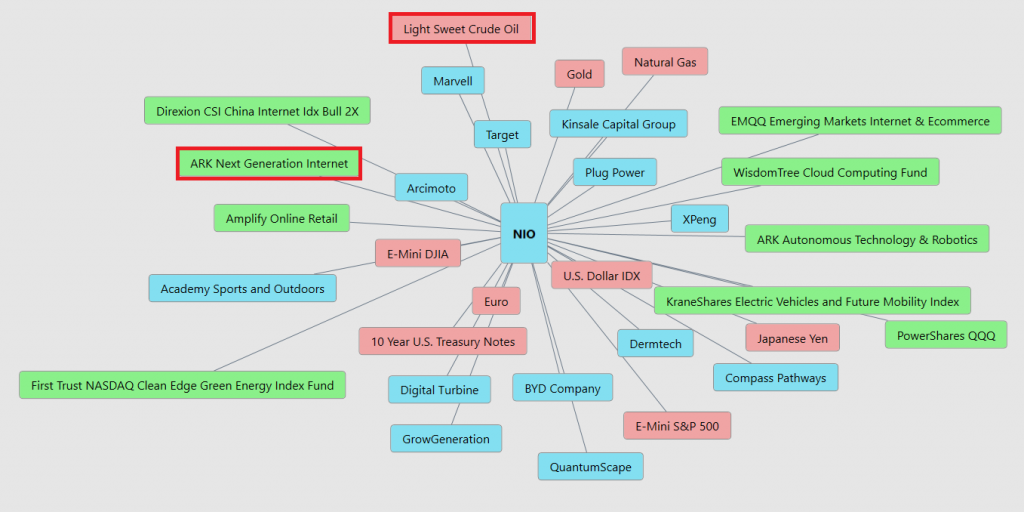
$NIO is 94.2%% correlated to ARK Next Generation Internet over the past year. $NIO is also -86.6% correlated to the price of Crude Oil.
These two metrics serve as an immensely powerful testament to the effectiveness of intermarket analysis.
If Crude Oil goes up, 86% of the time $NIO goes down, and vide versa. If ARK Next Generation Internet goes UP 94.2% of the time $NIO will follow suit.
One of the supremely important questions in trading is what is driving the price? Headlines often create interesting narratives. But these “stories” only capture the imagination. Traders want and need to understand the cause and effect of price movement.
The only way to get an answer to this important question is through Intermarket analysis which looks at statistical price correlations of assets.
Intermarket analysis is the study of relationships between different financial markets. It looks at how these markets affect each other, and how they can be used to predict future market movements. By understanding these relationships, traders can make informed decisions about where to allocate their capital. Intermarket analysis can be used to trade a variety of asset classes, including stocks, bonds, commodities, and currencies. There are a number of Intermarket indicators that can be used to identify opportunities, such as price correlations and momentum indicators. By taking the time to understand Intermarket dynamics, traders can give themselves a significant edge in the market.
So, a study of the relationship(s) will prove to be beneficial to a trader. Interest rates, Crude Oil Prices, and the volatility of the Dollar amongst thousands of other variables affect the decisions companies must make to flourish and prosper in these challenging times. Trying to determine what these factors are is one of the huge problems facing investors and traders.
You always have a choice. You can tune in to the talking heads in the media who spin talking points which promote fear. Or you can rely on facts to base your decision making on.
Within the following Intermarket Analysis graphic, you will see the 31 markets that are the key drivers to NIO’s’s price.
Our Suggestion
When you look at the last few weeks $NIO has moved $50%+ in a broader dismal market environment. Initially, that appears quite impressive on the surface.
However, when you zoom out and compare $NIO to other EV Manufactures and look at their performance you get an entirely different picture.
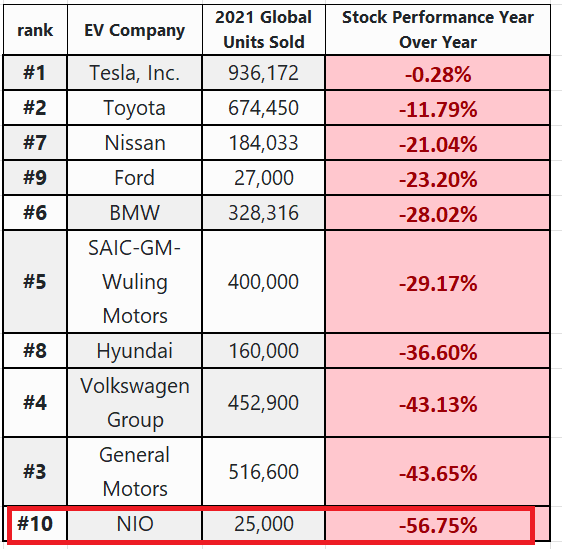
Over the last 4 years the company has massively underperformed the broader market – in a BIG, BIG way. Also, within its sector $NIO is very much of a laggard.
Should you choose to approach $NIO you have to view it within this context. Money can be made trading the stock, but you should not get caught up in the hype and publicity surrounding its expansion into the European market.
Any stock that has an average 6% daily trading range over the past year needs to be respected for its volatility. There are trading opportunities here, but primarily you must be cognizant of the risk.
We like the price action in $NIO.
We think this is strictly a small allocation and think $NIO is a trading stock. The Daily Range forecast and The Vantagepoint A.I. forecast will continue to be our guidance.
The reality is that Wall Street Analysts have an optimistic outlook on $NIO. Meanwhile the A.I. forecast is at best very mixed. Trade accordingly.
PUT $NIO on your radar and allow the a.i. to guide your trading decisions.
Practice solid money management on all your trades.
We will re-evaluate based upon:
- New Wall Street Analysts’ Estimates
- New 52-week high and low boundaries
- Vantagepoint A.I. Forecast (Predictive Blue Line)
- Neural Network Forecast
- Daily Range Forecast
Let’s Be Careful Out There!
Remember, It’s Not Magic.
It’s Machine Learning.

IMPORTANT NOTICE!
THERE IS SUBSTANTIAL RISK OF LOSS ASSOCIATED WITH TRADING. ONLY RISK CAPITAL SHOULD BE USED TO TRADE. TRADING STOCKS, FUTURES, OPTIONS, FOREX, AND ETFs IS NOT SUITABLE FOR EVERYONE.
DISCLAIMER: STOCKS, FUTURES, OPTIONS, ETFs AND CURRENCY TRADING ALL HAVE LARGE POTENTIAL REWARDS, BUT THEY ALSO HAVE LARGE POTENTIAL RISK. YOU MUST BE AWARE OF THE RISKS AND BE WILLING TO ACCEPT THEM IN ORDER TO INVEST IN THESE MARKETS. DON’T TRADE WITH MONEY YOU CAN’T AFFORD TO LOSE. THIS ARTICLE AND WEBSITE IS NEITHER A SOLICITATION NOR AN OFFER TO BUY/SELL FUTURES, OPTIONS, STOCKS, OR CURRENCIES. NO REPRESENTATION IS BEING MADE THAT ANY ACCOUNT WILL OR IS LIKELY TO ACHIEVE PROFITS OR LOSSES SIMILAR TO THOSE DISCUSSED ON THIS ARTICLE OR WEBSITE. THE PAST PERFORMANCE OF ANY TRADING SYSTEM OR METHODOLOGY IS NOT NECESSARILY INDICATIVE OF FUTURE RESULTS. CFTC RULE 4.41 – HYPOTHETICAL OR SIMULATED PERFORMANCE RESULTS HAVE CERTAIN LIMITATIONS. UNLIKE AN ACTUAL PERFORMANCE RECORD, SIMULATED RESULTS DO NOT REPRESENT ACTUAL TRADING. ALSO, SINCE THE TRADES HAVE NOT BEEN EXECUTED, THE RESULTS MAY HAVE UNDER-OR-OVER COMPENSATED FOR THE IMPACT, IF ANY, OF CERTAIN MARKET FACTORS, SUCH AS LACK OF LIQUIDITY. SIMULATED TRADING PROGRAMS IN GENERAL ARE ALSO SUBJECT TO THE FACT THAT THEY ARE DESIGNED WITH THE BENEFIT OF HINDSIGHT. NO REPRESENTATION IS BEING MADE THAT ANY ACCOUNT WILL OR IS LIKELY TO ACHIEVE PROFIT OR LOSSES SIMILAR TO THOSE SHOWN.

