
One of the things that I like to do at the end of every quarter is to review my trading thesis and ideas on the economy to see where I was right, where I was wrong and what I can learn from the experience. It’s a habit I recommend everyone do in their own trading as well. To be effective at trading we simply need to learn lessons from our mistakes and implement a process where we no longer repeat them.
Over the past year, I wrote very extensively about my concerns with inflation, money printing, quantitative easing and the Federal Reserve raising interest rates.
You can re-read the following articles to understand my long-term trading thesis:
Inflation, The Fed, and Corporate Insiders – Are We Witnessing a Major Stock Market Top?
How To Understand the Federal Reserve. What They Can and Cannot Do.
How Inflation and Fed Tapering Can Destroy Stock Market Valuations
First off, my errors.
I didn’t think the Fed would be able to raise interest rates. In this regard, I was completely incorrect.
The bad news I was wrong.
The good news is that even though I was wrong on Fed policy, I was 100% correct on the consequences of their actions.
Huh?
This is what I wrote on January 13, 2022.
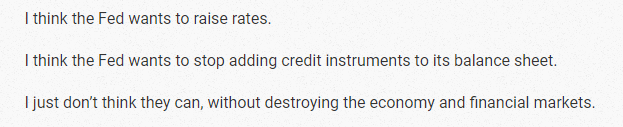
Since that article, the Fed has raised interest rates multiple times. With inflation raging at 8.6% what they need to do is make bond yields attractive once again and push interest rates above the inflation rate. However, doing so would cause financial assets to implode and create government insolvency. That is why they are trapped between a rock and a hard place Now that we have seen numerous interest rate increases let’s look at the effect their policy has had on the economy as well as the financial markets.
A recession is typically defined as two consecutive quarters of negative economic growth, as measured by a country’s gross domestic product (GDP). In other words, it is a period of declining economic activity. It’s visible in industrial production, employment, real income, and wholesale-retail trade. The economy generally experiences three broad phases during the business cycle: expansion, peak and contraction. A recession begins just after the economy reaches a peak of activity and ends as the economy reaches its trough. Between these peaks and troughs, there are periods of recession.
This can lead to higher unemployment levels as businesses cut back on production and lay off workers. In addition, consumers may become more hesitant to spend money during a recession, further exacerbating the economic slowdown. While the definition of a recession is relatively straightforward, its impact can be far-reaching and long-lasting. As such, it is important to understand what causes recessions and how they can be mitigated.
A related concept is depression, which is defined as a period of significant decline in economic activity lasting longer than a year. Depressions are relatively rare events; since World War I, there have been only two episodes of depression in the United States (1929-1933 and 1937-1938). A recession is sometimes referred to as a “down economy.” The National Bureau of Economic Research (NBER) defines a recession as: “a significant decline in economic activity spread across the economy, lasting more than a few months, normally visible in real GDP, real income, employment, industrial production, and wholesale-retail sales.”
There are several indicators that can be used to determine whether or not the economy is in a recession. One of the most important is economic growth. When economic growth slows or contracts, it is often a sign that a recession is underway. Another key indicator is unemployment. When unemployment rates begin to rise, it is often an indication that economic conditions are deteriorating. Additionally, consumer confidence can be a helpful gauge of economic health. When consumers are feeling confident, they tend to spend more money, which can help to prop up the economy. However, when consumer confidence declines, it can be a sign that a recession is on the horizon. Gross domestic product (GDP) is the important metric to watch.
This is a measure of the total value of all goods and services produced in a country. If the GDP shrinks for two consecutive quarters, it’s a sign that the economy is contracting. When GDP growth slows or turns negative, it’s often an indication that the economy has entered a recessionary phase. Finally, economic statistics like retail sales and housing starts also tend to decline during a recession. While there’s no one definitive way to tell if the economy is in a recession, these are some of the most commonly used indicators.
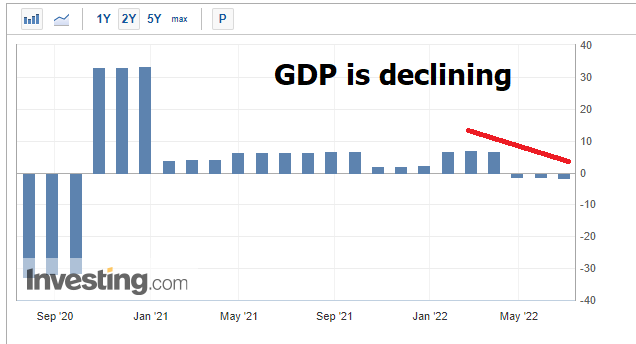
Armed with this information let’s look at some charts so that we can draw our own conclusions.
Here is a chart of US GDP over the last two years. The US economy is in a lot of trouble. The recent statistics show that Q1 GDP was -1.4%. Now, it’s estimated that Q2 will come in at 0% for the second quarter. This in and of itself seems to indicate that the U.S. economy is already in a recessionary contraction.
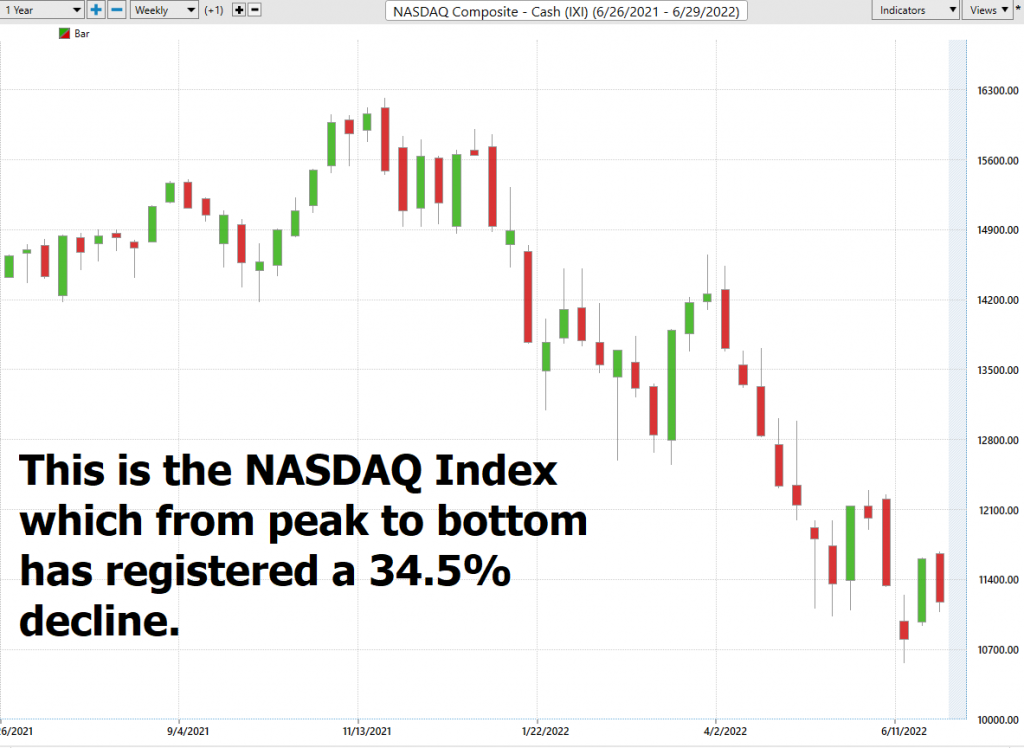
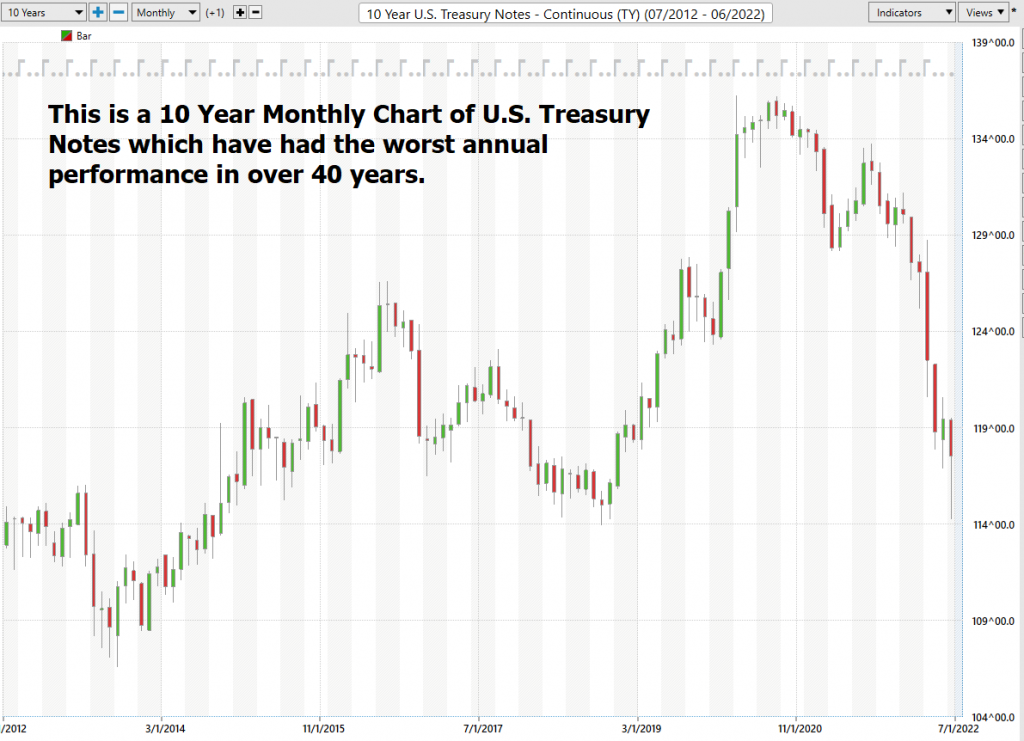
Next, let’s look at the domestic stock market indexes. Nasdaq and S&P have been in a bear market (defined as a correction of greater than 20%) and the Dow Jones Industrials Average was on the verge of slipping into one even prior to the 75-basis point hike. The US bond markets had the worst six-month period in 40 years!
Next, let’s look at the U.S. Consumer Confidence Survey from the University of Michigan.
The GEOMETRY of US Consumer Confidence shows a strong negative bias as it sank to a low of 50.2 – this level has not been seen since 1980 when the US Fed Funds rate was at 20%. Currently, the Fed Funds rate is 1.75%.
I hate to say it, but the current interest rate environment is 18.25% lower than in 1980 and Consumer Confidence is approaching the lowest levels in 40 years. That is worrisome anyway you look at it.
This negative consumer confidence is clearly confirmed by the horrific performance of the nation’s largest retail stocks.
Walmart is down -14% year over year.
Amazon is down -37.71%
Target is down -45.73%
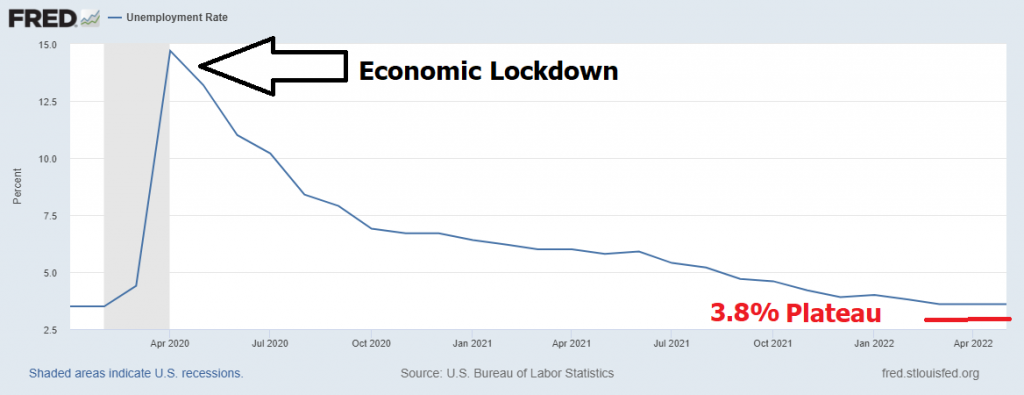
Next, let’s look at the unemployment rate over the last 2 years. The good news is that things have massively improved since the economic lockdowns began and unemployment surged to almost 15%. The bad news is that for the last several months’ unemployment has plateaued at 3.6%. A small marginal increase in unemployment would confirm that companies are contracting and starting to lay off workers.
Lastly, let’s look at inflation.
In May 2020 CPI registered at .1%.
We were told that the money printing was essential. We were told it would not cause inflation. Then we were told that inflation would be minor and transitory. And now that inflation has registered at 8.6%, we are told that there is a plan to rein inflation in again.
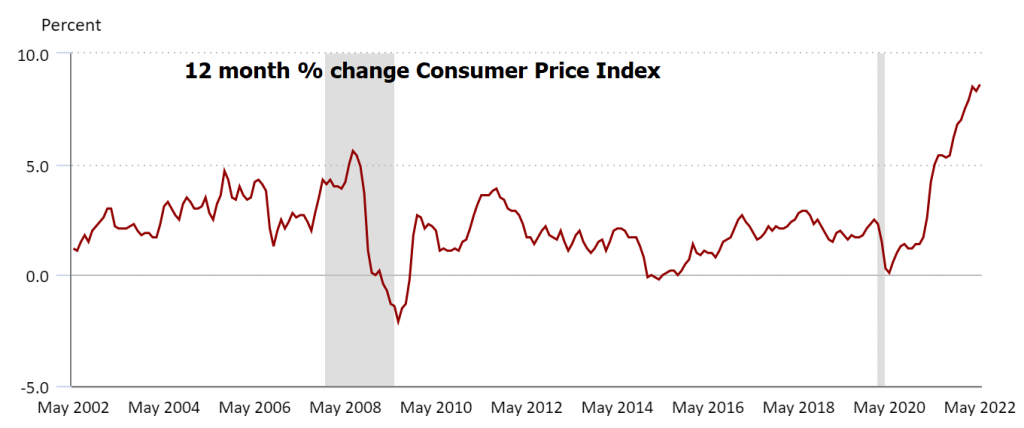
The next Consumer Price Index release will occur on July 13, 2022. Analysts feel that a reading of 8.6%, which was last month’s number, (or higher) will bode very poorly for the economic outlook.
Regardless how you slice it, RECESSION looks like it is clearly in view. We have declining economic productivity, declining consumer confidence, raising interest rates, declining retail sales, falling stock prices, a yield curve about to invert again and increasing inflationary pressures.
My vote is that we have been in a recession – trade accordingly.
Over the next few months, I can pretty much guarantee that all attention will be placed on the release of the Consumer Price Index report. If we do not see disinflationary pressures occur, you can pretty much guarantee that the Wall Street Consensus will be that we are in a recession.
The problem is that higher interest rates means that the government must pay more interest on its debt, which now stands at over $30 trillion. Higher rates mean less credit and less economic activity. Higher mortgage rates mean fewer home sales and less construction. Increases in the unemployment rate means the government collects less in tax revenue. Meanwhile, a contracting economy translates to higher welfare expenses as more people rely upon the government for safety from the economic storm.
The Fed has stated that they are going to stop buying Treasury instruments and monetizing U.S. debt.
I cannot think of a scenario where they can make that occur.
Who buys the debt then?
Does the U.S. government suddenly stop deficit spending?
The only thing that matters in all this discussion on economic indicators is how it has affected your bottom line.
End of story!
Celebrities in the financial sector love to argue about nuances of economic definitions with the mainstream media. It is a giant waste of time.
What matters is, were you on the right side, of the right trend at the right time?
Everything else is just NOISE.
In other words, did you stay out of harm’s way, or better yet find a way to profit from the change in economic conditions?
The economy is always changing. Sometimes it is for the better. Other times it is for the worse. But for those armed with the right tools it is an opportunity to not be adversely affected by misfortune.
A few charts paint the picture far better than could be explained in words.
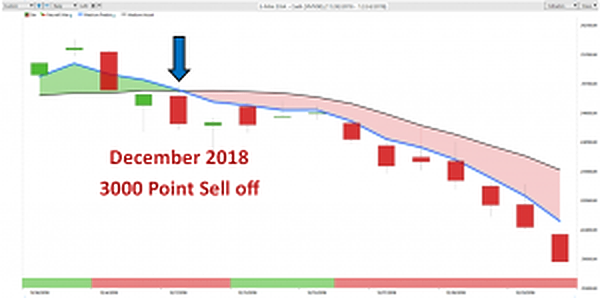
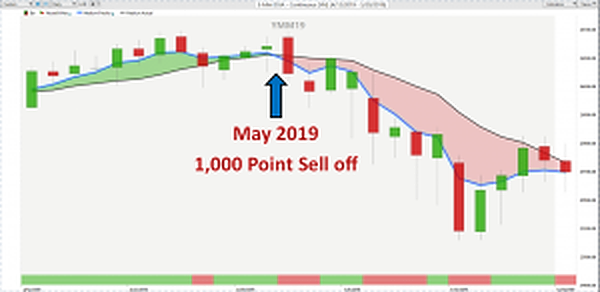
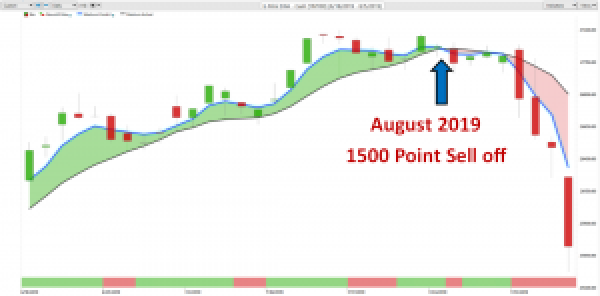
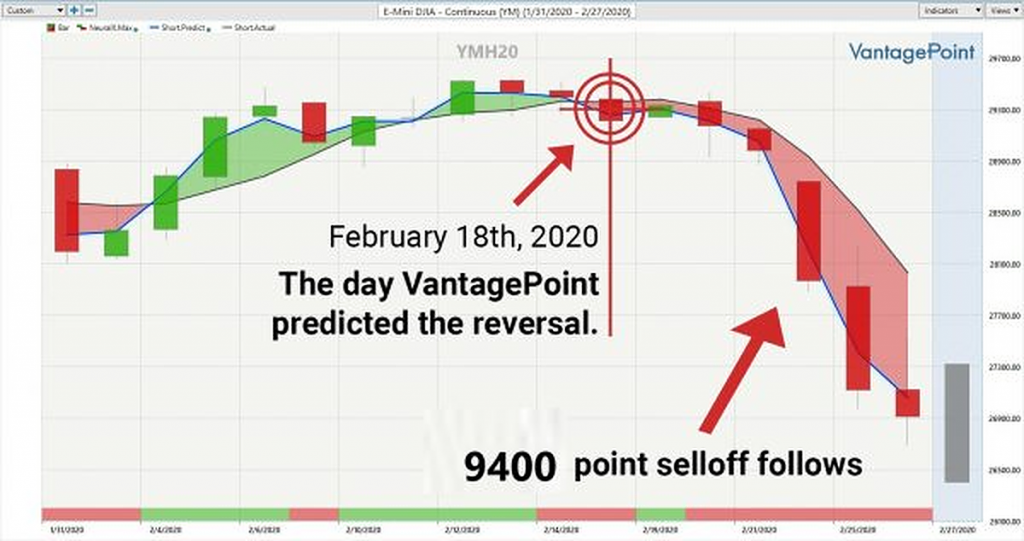
This is the power of artificial intelligence, machine learning and neural networks in action.
In case you are wondering about the 2022 Bear Market, I can assure you that the artificial intelligence caught that decline as well. Here is a snapshot of just the last 3 months.
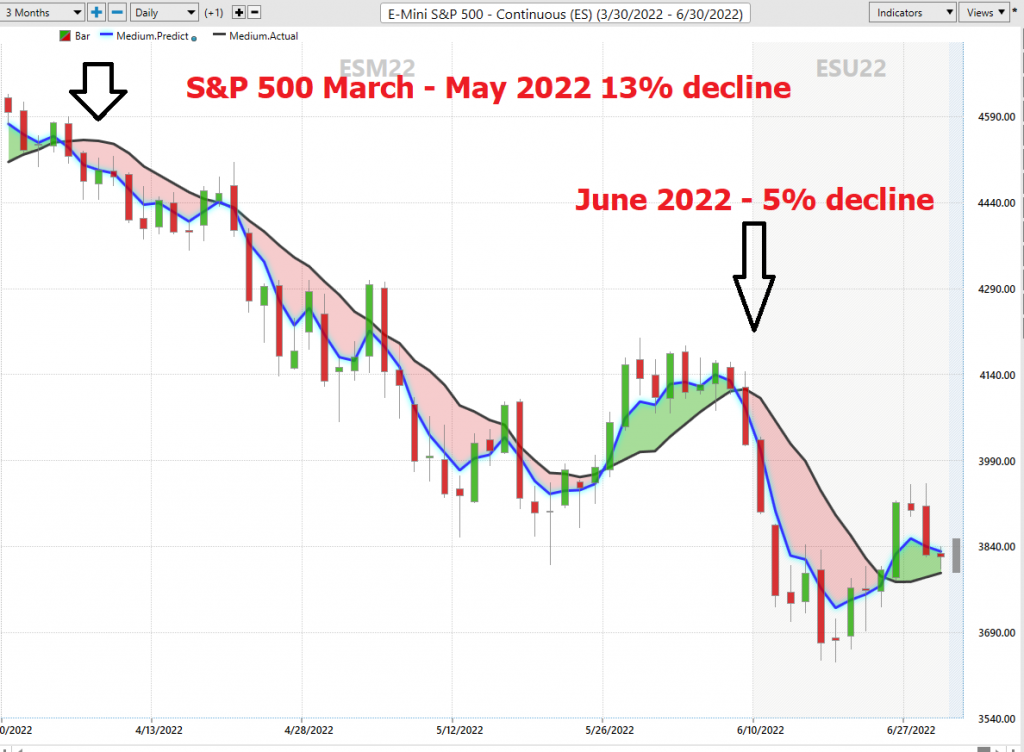
Artificial intelligence is so powerful because it learns what doesn’t work, remembers it, and then focuses on other paths to find a solution. This is the Feedback Loop that is responsible for building the fortunes of every successful trader I know.
That should get you excited because it is a game changer!
While reporters, talking heads and analysts want to discuss esoteric economic ideas, my only loyalty as a trader is to the trend! This is how VantagePoint artificial intelligence simplifies and empowers traders daily!
The beauty of neural networks, artificial intelligence and machine learning is that it is fundamentally focused on pattern recognition to determine the best move forward. When these technologies flash a change in forecast it is newsworthy. We often do not understand why something is occurring but that does not mean that we cannot take advantage of it.
Most humans have a really tough time learning from bad experiences. The ego gets in the way, each and every time.
Since artificial intelligence has beaten humans in Poker, Chess, Jeopardy and Go, do you really think trading is any different?
Knowledge. Useful knowledge. And its application is what A.I. delivers.
Visit With US and check out the a.i. at our Next Live Training.
It’s not magic. It’s machine learning.
Make it count.

IMPORTANT NOTICE!
THERE IS SUBSTANTIAL RISK OF LOSS ASSOCIATED WITH TRADING. ONLY RISK CAPITAL SHOULD BE USED TO TRADE. TRADING STOCKS, FUTURES, OPTIONS, FOREX, AND ETFs IS NOT SUITABLE FOR EVERYONE.
DISCLAIMER: STOCKS, FUTURES, OPTIONS, ETFs AND CURRENCY TRADING ALL HAVE LARGE POTENTIAL REWARDS, BUT THEY ALSO HAVE LARGE POTENTIAL RISK. YOU MUST BE AWARE OF THE RISKS AND BE WILLING TO ACCEPT THEM IN ORDER TO INVEST IN THESE MARKETS. DON’T TRADE WITH MONEY YOU CAN’T AFFORD TO LOSE. THIS ARTICLE AND WEBSITE IS NEITHER A SOLICITATION NOR AN OFFER TO BUY/SELL FUTURES, OPTIONS, STOCKS, OR CURRENCIES. NO REPRESENTATION IS BEING MADE THAT ANY ACCOUNT WILL OR IS LIKELY TO ACHIEVE PROFITS OR LOSSES SIMILAR TO THOSE DISCUSSED ON THIS ARTICLE OR WEBSITE. THE PAST PERFORMANCE OF ANY TRADING SYSTEM OR METHODOLOGY IS NOT NECESSARILY INDICATIVE OF FUTURE RESULTS. CFTC RULE 4.41 – HYPOTHETICAL OR SIMULATED PERFORMANCE RESULTS HAVE CERTAIN LIMITATIONS. UNLIKE AN ACTUAL PERFORMANCE RECORD, SIMULATED RESULTS DO NOT REPRESENT ACTUAL TRADING. ALSO, SINCE THE TRADES HAVE NOT BEEN EXECUTED, THE RESULTS MAY HAVE UNDER-OR-OVER COMPENSATED FOR THE IMPACT, IF ANY, OF CERTAIN MARKET FACTORS, SUCH AS LACK OF LIQUIDITY. SIMULATED TRADING PROGRAMS IN GENERAL ARE ALSO SUBJECT TO THE FACT THAT THEY ARE DESIGNED WITH THE BENEFIT OF HINDSIGHT. NO REPRESENTATION IS BEING MADE THAT ANY ACCOUNT WILL OR IS LIKELY TO ACHIEVE PROFIT OR LOSSES SIMILAR TO THOSE SHOWN.

