
“The Cure for High Prices is High Prices.” – Popular Wall Street Axiom
In Free Markets the popular belief is that as prices rise, producers seek to produce more and therefore correct the supply and demand imbalance that exists. Lumber prices over the last 3 years certainly prove this statement to be true.
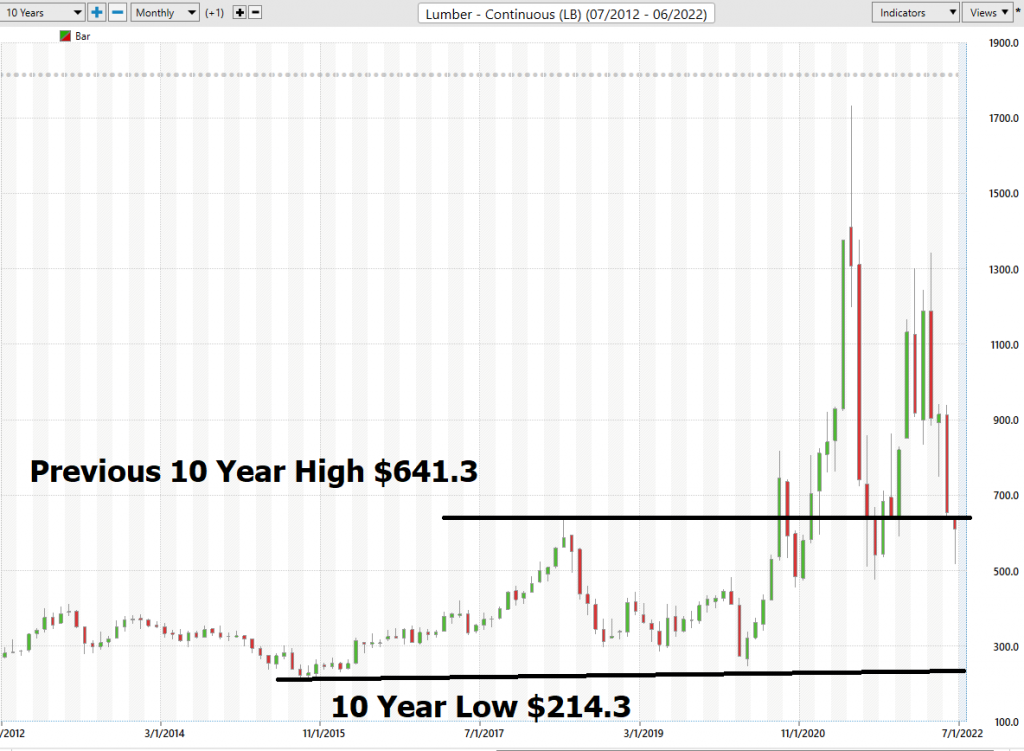
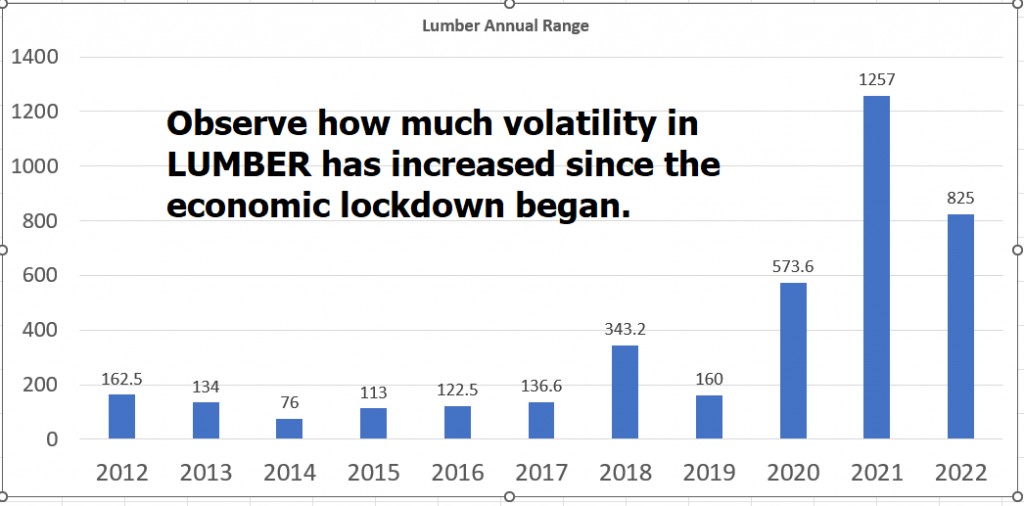
You begin to appreciate what the word volatility means when you look at a long-term LUMBER chart. Traditionally, over the past decade, Lumber prices have held very stable and traded within very narrow trading ranges. Prior to the pandemic Lumber, which is quoted in one thousand board feet, traded between $214.3 and $641.30. However, as the chart below illustrates when the 10 year high in Lumber was breached prices exploded as much as 200% higher in a period of a few months.
Logging was completely shut down at the beginning of the pandemic which resulted in reduced supplies. The economy on the other hand had historically low interest rates, and a housing boom. Workers for several months were ordered to stay at home and not come to work where lumber and plywood is produced. The price of lumber has been unstable since the beginning of the COVID-19 pandemic, drastically spiking up and down throughout the last two years. This is because of the following conditions:
A shortage of Lumber supplies.
A shortage of workers.
A bottleneck in transportation networks.
A massive inflationary housing boom fueled by massive money supply printing.
All these factors are responsible for the incredible volatility that we have seen in Lumber prices. According to The National Association of Home Builders, the surge in lumber prices has increased home building costs by over $18,600.
The mainstream media is fast to blame lumber manufacturers for mis-forecasting the COVID-19 crisis. Blaming manufacturers for rising prices is like blaming gravity for plane crashes. You have to look at what parts of the plane failed that allowed gravity to win. The supply and demand imbalances that were in the lumber market were greatly increased by the economic shutdown and artificially low interest rates.
Observe how price has returned to the previous 10 year high. Often in long term secular bull markets old resistance becomes new support and we believe that LUMBER is looking for support in this general area.
To quantify the effect that all these constraints have had simply look at the following graphic which illustrates the annual trading range of Lumber between 2012 and present time. From 2012 to 2019, pre-pandemic the average annual trading range for Lumber was $155.97. Over the last 3 years, it is 668% higher at 885.2. Granted, we have had a worldwide pandemic and economic lockdown, but this is not the type of metric that induces confidence in central planners.

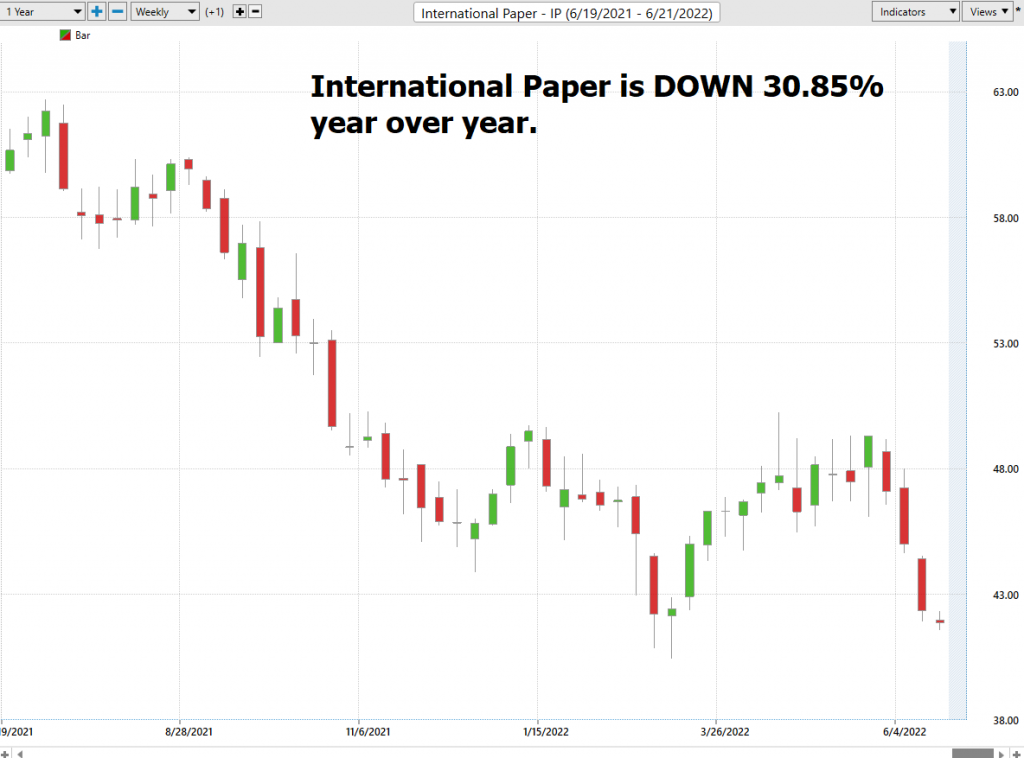
Wood is an essential commodity that is used in numerous industries besides building. For example, paper-related products all require wood as their base element.
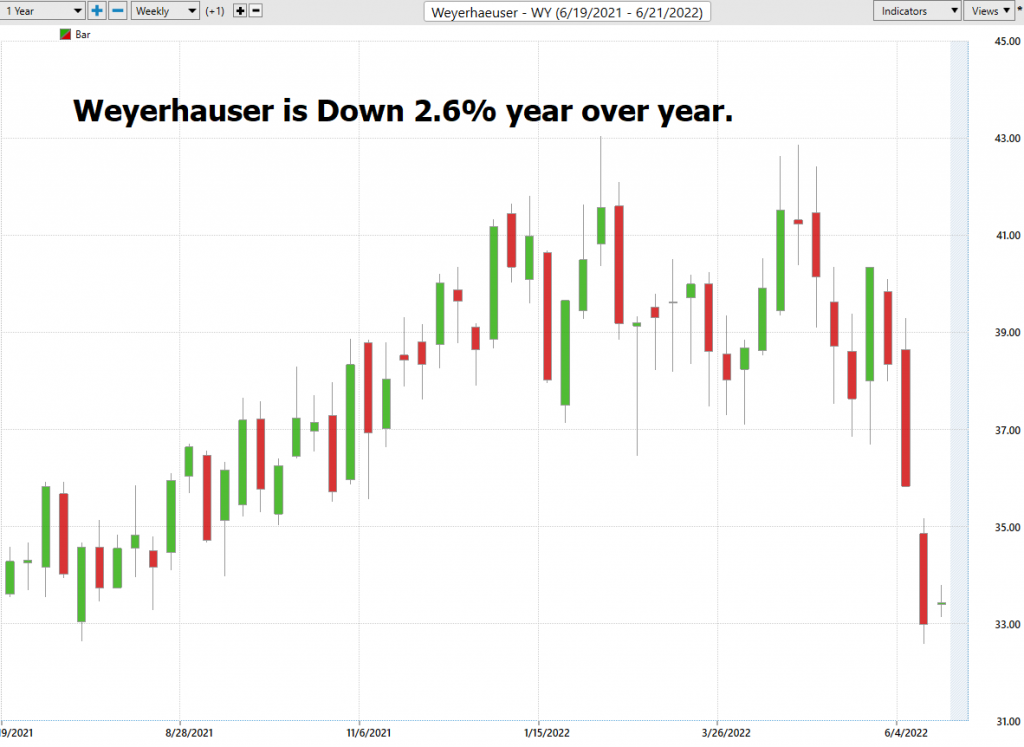
Let’s look at some charts at how Lumber has affected large company stock prices over the past year:
In this weekly stock study, we will look at and analyze the following indicators and metrics as are our guidelines which dictate our behavior in deciding whether to buy, sell, or stand aside on a particular stock.
- 52-week high and low boundaries
- Best Case-Worst Case Analysis
- Vantagepoint A.I. Forecast (Predictive Blue Line)
- Neural Network Forecast
- Daily Range Forecast
- Intermarket Analysis
- Our suggestion
We don’t base decisions on things like supply and demand estimates or fundamental valuations. However, we do look at them to better understand the financial landscape that a company is operating under.
52-week High-Low Chart
Readers of this blog will attest to the fact that we are huge believers in monitoring where a stock is trading in relation to its 52-week range. Our perspective is winners continuously make new 52-week highs and losers make new 52-week lows.
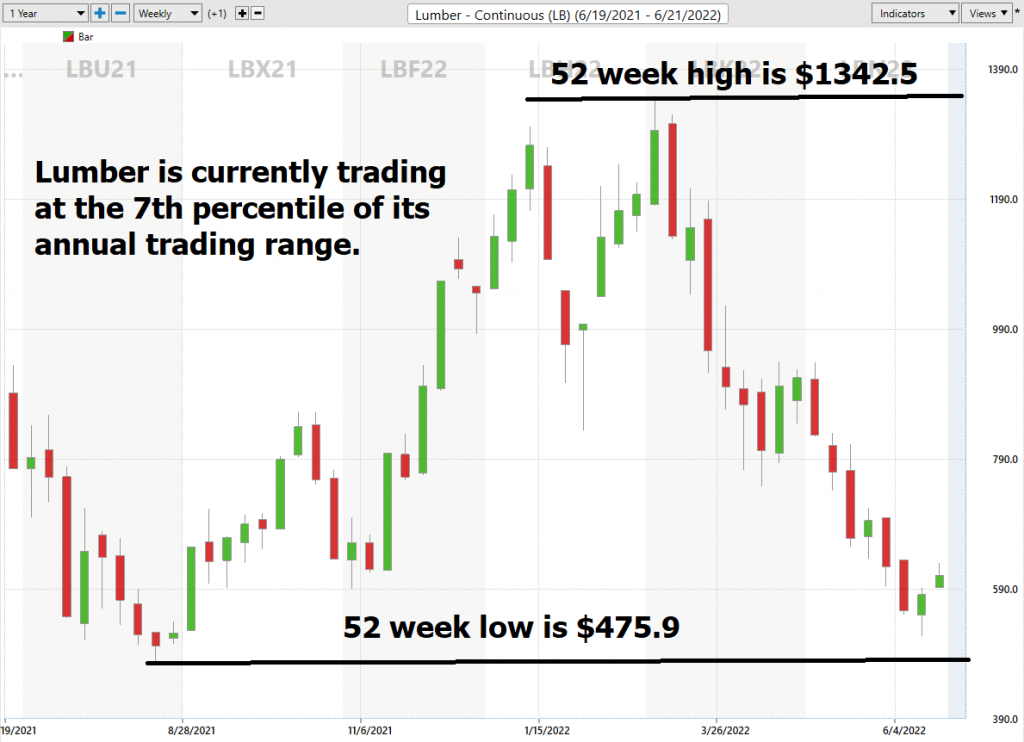
Over the last 52 weeks LUMBER has traded as high as $1342.4 and as low as $475.9.
Based upon the high and low prices we can quickly see that the annual trading range of LUMBER has been $8.89. This tells us that the average weekly trading range is $864.
Current annualized volatility is among the highest it has ever been. We can quickly recognize the unique situation by simply dividing the annual trading range ($864) by the current closing price ($610). Whenever you see the annual trading range higher than the current closing price on any asset, it is a telltale indicator that you are dealing with an extremely volatile asset.
Best Case – Worst Case Scenarios
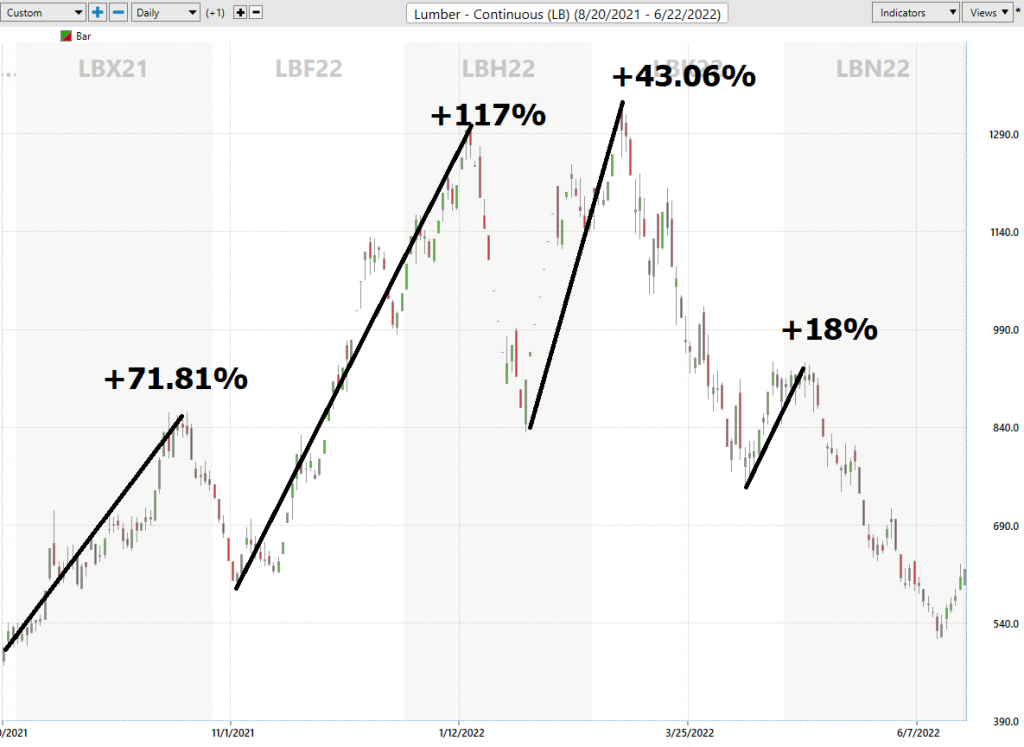
Next, we want to look at the trend over the past year and evaluate the strength of the rallies in relation to the declines.
Best Case Analysis
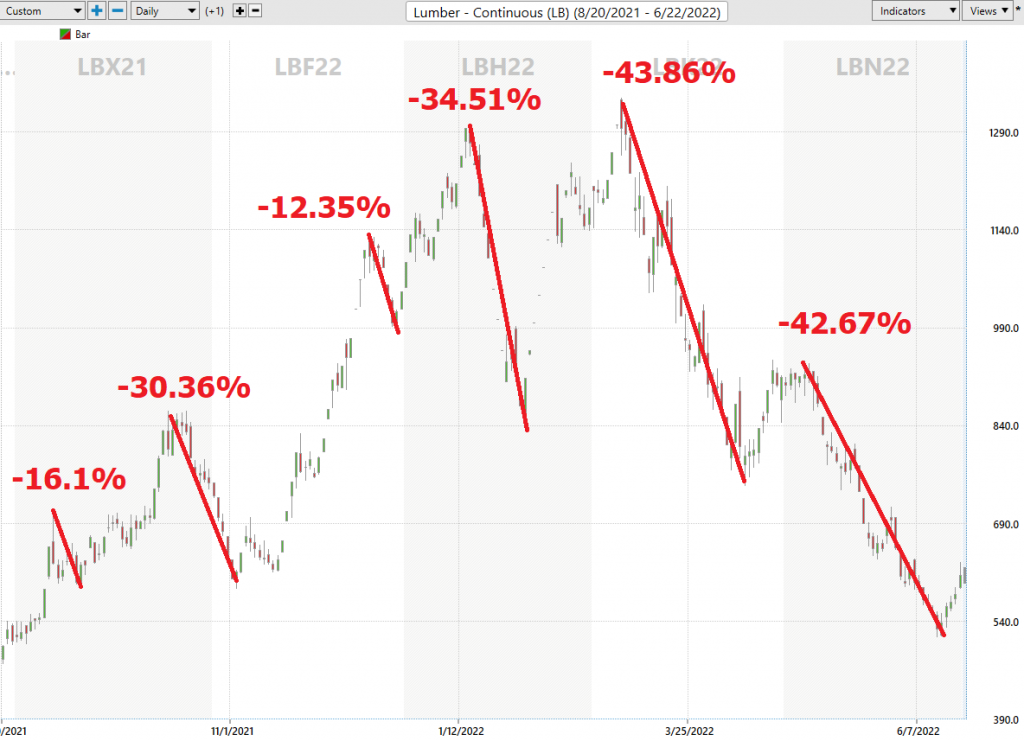
Worst Case Analysis Lumber
Over the past year:
LUMBER over the last 52 weeks is DOWN 22.26%
We won’t compare LUMBER to the broader stock market indexes because they are two entirely distinct types of asset classes.
What can we learn from these rallies and sharp declines?
We have had 4 rallies and 6 substantial declines. To trade Lumber, you better have a reliable and effective trend indicator.
The Vantagepoint A.I. Analysis
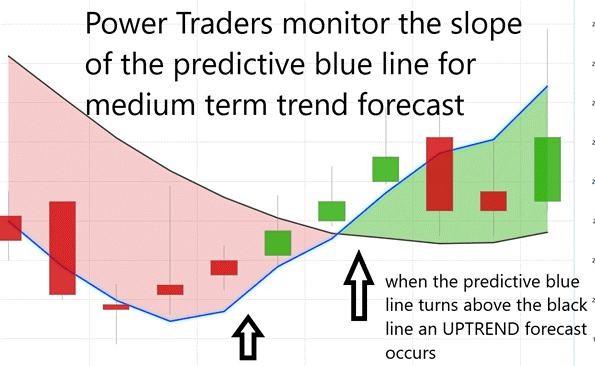
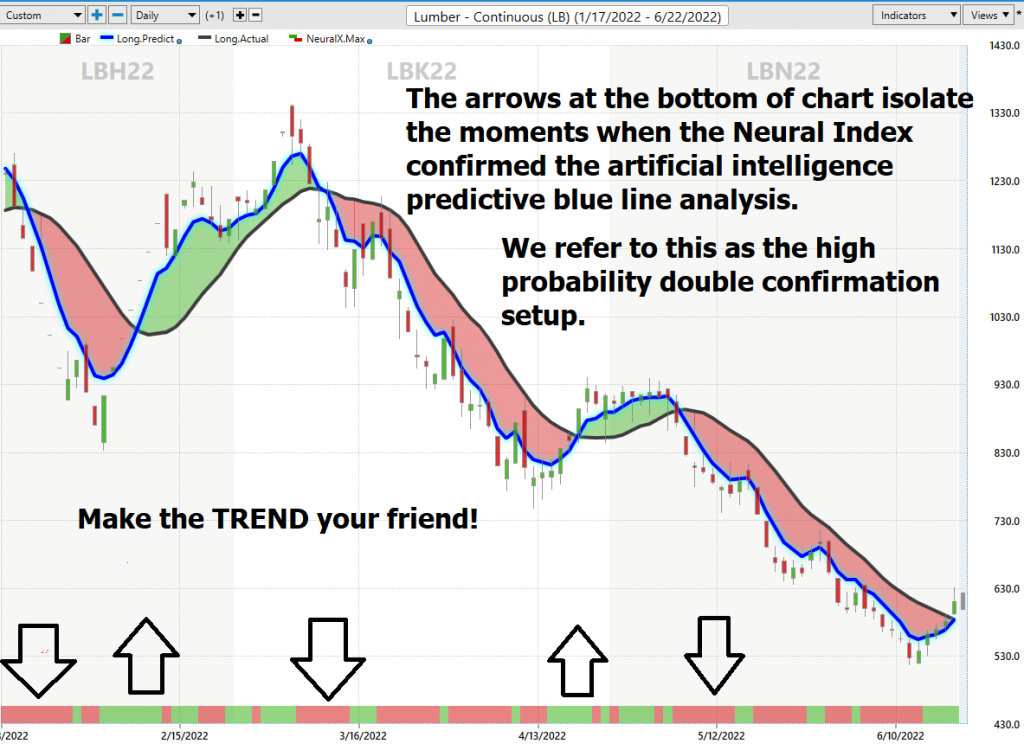
Using VantagePoint Software and the artificial intelligence, traders are alerted to trend forecasts by monitoring the slope of the predictive blue line. The black line is a simple 10 day moving average of price which simply tells you what has occurred in the market. The predictive blue line also acts as value zone where in uptrends traders try to purchase the asset at or below the blue line.
In studying the chart below pay close attention to the slope of the blue line. Anytime the blue line crosses the zero intercept is a trend signal. If the line crosses from down to up, an UP-trading opportunity exists. If the line crosses from Up to down the down trading opportunity exists.
Power traders use the predictive blue line in helping to determine both the value zone as well as the trend direction.
Observe how the SLOPE of the predictive blue line started moving higher a few days before its moving above the black line. A strong trend was evidenced by seeing that price was consistently closing above the predictive blue line.
As you can see on the following chart there were 8 trends that the artificial intelligence forecasted on Lumber over the previous 9 months. The green numbers represent the gains or losses on the UP forecasts. The Red numbers represent the returns on the down forecasts.
There were 7 trends with positive Returns and 1 loser.
- 15.5%
- 13.7%
- 63.05%
- 10.37%
- 10.6%
- 23.9%
- -6.8%
- 26.2%
These returns are quite impressive considering the tremendous volatility that has occurred in Lumber.
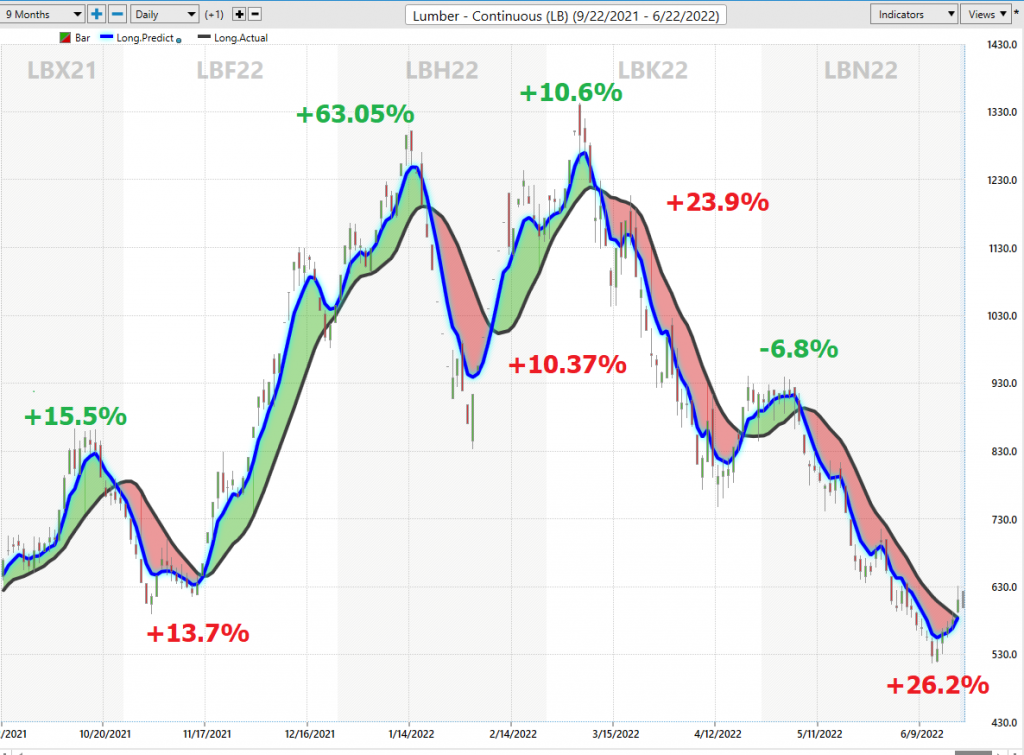
Please bring your eye to the present time and observe how a new UP trend forecast is being created by the artificial intelligence. To verify a solid high probability trend what we ALWAYS do is cross reference the artificial intelligence signal with the Neural Networks to create a double confirmation.
Fine Tuning Entries with The Neural Net Indicator
At the bottom of the chart is the Neural Network Indicator which predicts future strength and/or weakness in the market with a 48-to-72-hour time horizon.
A Neural Net is a computational learning system that uses a network of functions to understand and translate massive amounts of data into a desired output, consistently monitoring itself and improving its performance.
When the Neural Net Indicator is green it communicates strength. When the Neural Net is Red it is forecasting short-term weakness in the market.
We advocate that Power Traders cross-reference the chart with the predictive blue line and neural network indicator to create optimal entry and exit points. This provides what we refer to as the DOUBLE CONFIRMATION setup.
Power Traders are always looking to apply both the neural network and a.i. to the markets to find statistically sound trading opportunities.
We advise Power Traders to cross reference the predictive blue line with the Neural Net for the best entry opportunities. Observe how by simply waiting for the green Neural Net to align with the predictive blue line the trading opportunity unfolded beautifully generating high probability trading opportunities.
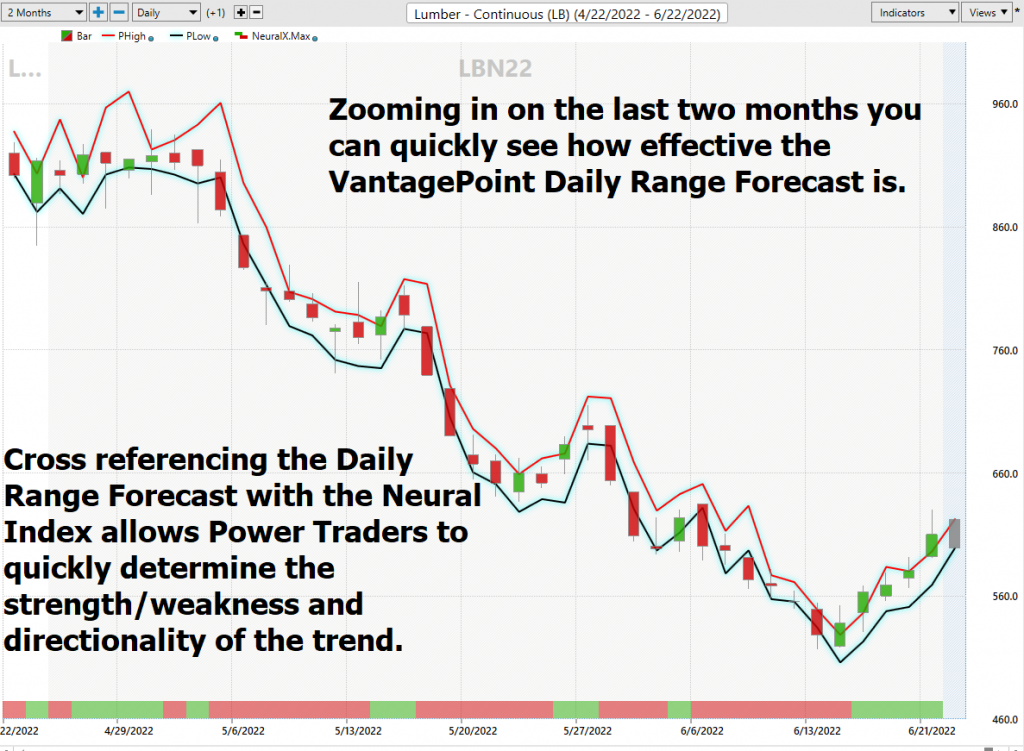
VantagePoint Software Daily Price Range Prediction
The purpose of all these indicators so far is to help traders stay on the right side of the right trend at the right time.
One of the powerful features in the Vantagepoint A.I. Software which Power Traders use daily is the Daily Price Range prediction forecast.
This forecast is what permits Power Traders to truly fine tune their entries and exits into the market often looking for smaller time frames and more granular trading opportunities.
Here is the price chart of LUMBER during the most recent runup featuring the Daily Price Range forecast and the Neural Net Indicator.
Over the last few months, the average daily range was about 43.23. The maximum range was 122.6 and the minimum daily range was 14.5. In spite of the huge variance on these metrics the a.i. machine learning and neural network all work together to bring together a best move forward daily forecast for the following day. You can quickly see how clearly the trend is delineated and how effective this daily range forecast is.
All of the tools so far in this analysis attempt to define value and to clearly identify the trend and points within the trend where traders should look to capitalize on.
Intermarket Analysis
What makes the Vantagepoint Software truly unique is its ability to perform Intermarket analysis and to locate those assets which are most interconnected that are responsible for driving the price of LUMBER higher or lower.
Studying the charts can always provide objective realities in terms of locating support and resistance levels which become very clear on a chart. But we live in a global marketplace. Everything is interconnected. The billion-dollar question for traders is always what are the key drivers of price for the underlying asset that I am trading?
These intangibles are invisible to the naked eye yet show extremely high statistical correlations.
Slight changes in Interest rates, Crude Oil Prices, and the Volatility of the dollar amongst thousands of other variables affect the decisions companies must make to survive in these challenging times. Trying to determine what these factors are is one of the huge problems facing investors and traders.
On the following graphic you will see what markets are most highly positive and negatively correlated to Lumber Prices. This is priceless in terms of the time savings you will create in learning the power of trading correlated markets.
Next time you see a powerful trend in a stock or commodity, wouldn’t it be nice to know what markets were responsible for making that move occur? Power Traders used the Intermarket Analysis feature in the software to isolate trading candidates that show high statistical correlation to fast-moving markets. This is the most effective way to avoid the talking heads and media noise and listen to the FACTS.
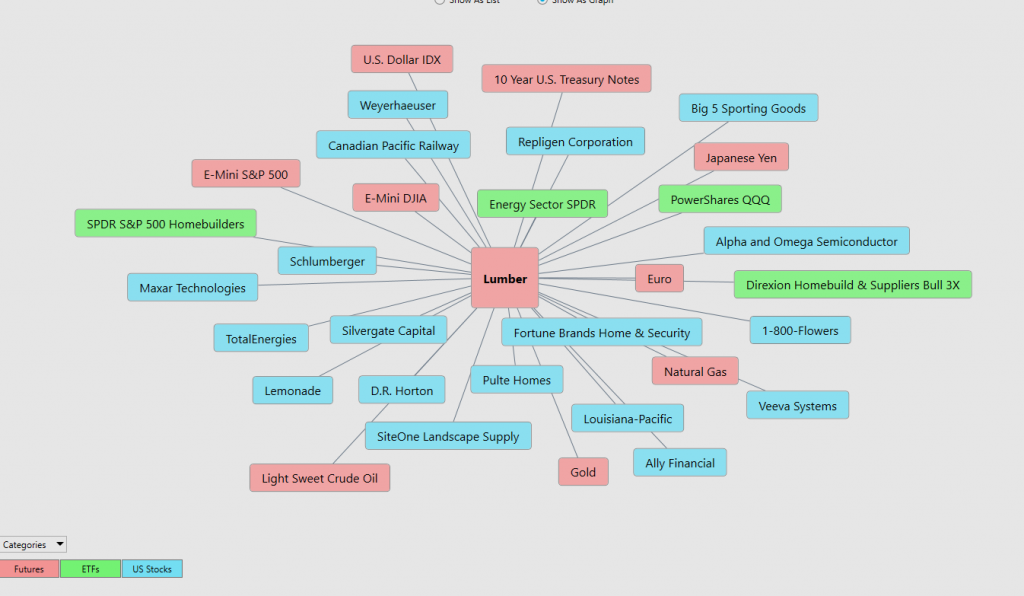
There is immense value to be had in studying and understanding the key drivers of LUMBER price action. This graphic presents a plethora of opportunities that can quickly be explored within the software.
This is an amazing research tool that consistently uncovers future gems.
Our Suggestion
Most traders do not trade LUMBER. It is a commodity futures contract, but it is worthy of your study because it is an essential market in a healthy economy.
What we hope you have learned in reading this analysis on Lumber is that you don’t need to be scared of volatile markets if you have a reliable tool that creates effective forecasts.
There have been 8 trends in LUMBER in the last 9 months. The artificial intelligence has signaled a recent UP forecast. This has occurred in in an incredible volatile environment where lumber volatility as reflected by the annual range divided by the current close is at +160%.
The annual trading range in LUMBER tells us that VOLATILITY has broken out to new highs. This spells huge risk or huge opportunity depending on the effectiveness of your decision-making process.
Watch LUMBER. The TRENDS and spikes will be fast and furious. This is not a market to trade for the uninitiated. But also pay attention to the INRTERMARKETS featured above as these stocks will be very much affected by the volatility in lumber prices.
Focus on the a.i. forecast and solid money management.
We think that the volatility will stay exceedingly high in LUMBER. Should this occur with a rising general commodity marketplace it will be a very solid clue that the Fed has lost complete control of being able to rein in inflation.
We’ll look for opportunities of sudden breaks in the market if the a.i. forecast remains UP.
Let’s Be Careful Out There!
Remember, It’s Not Magic.
It’s Machine Learning.

IMPORTANT NOTICE!
THERE IS SUBSTANTIAL RISK OF LOSS ASSOCIATED WITH TRADING. ONLY RISK CAPITAL SHOULD BE USED TO TRADE. TRADING STOCKS, FUTURES, OPTIONS, FOREX, AND ETFs IS NOT SUITABLE FOR EVERYONE.
DISCLAIMER: STOCKS, FUTURES, OPTIONS, ETFs AND CURRENCY TRADING ALL HAVE LARGE POTENTIAL REWARDS, BUT THEY ALSO HAVE LARGE POTENTIAL RISK. YOU MUST BE AWARE OF THE RISKS AND BE WILLING TO ACCEPT THEM IN ORDER TO INVEST IN THESE MARKETS. DON’T TRADE WITH MONEY YOU CAN’T AFFORD TO LOSE. THIS ARTICLE AND WEBSITE IS NEITHER A SOLICITATION NOR AN OFFER TO BUY/SELL FUTURES, OPTIONS, STOCKS, OR CURRENCIES. NO REPRESENTATION IS BEING MADE THAT ANY ACCOUNT WILL OR IS LIKELY TO ACHIEVE PROFITS OR LOSSES SIMILAR TO THOSE DISCUSSED ON THIS ARTICLE OR WEBSITE. THE PAST PERFORMANCE OF ANY TRADING SYSTEM OR METHODOLOGY IS NOT NECESSARILY INDICATIVE OF FUTURE RESULTS. CFTC RULE 4.41 – HYPOTHETICAL OR SIMULATED PERFORMANCE RESULTS HAVE CERTAIN LIMITATIONS. UNLIKE AN ACTUAL PERFORMANCE RECORD, SIMULATED RESULTS DO NOT REPRESENT ACTUAL TRADING. ALSO, SINCE THE TRADES HAVE NOT BEEN EXECUTED, THE RESULTS MAY HAVE UNDER-OR-OVER COMPENSATED FOR THE IMPACT, IF ANY, OF CERTAIN MARKET FACTORS, SUCH AS LACK OF LIQUIDITY. SIMULATED TRADING PROGRAMS IN GENERAL ARE ALSO SUBJECT TO THE FACT THAT THEY ARE DESIGNED WITH THE BENEFIT OF HINDSIGHT. NO REPRESENTATION IS BEING MADE THAT ANY ACCOUNT WILL OR IS LIKELY TO ACHIEVE PROFIT OR LOSSES SIMILAR TO THOSE SHOWN.

