

Over the last 7 months, Bitcoin has retreated over 72% from its all-time high. Many in the media have thrown in the towel, while some traders out of sheer desperation with its massive volatility have also tapped out.
Early adherents and proponents of bitcoin promoted that the leading cryptocurrency offered asymmetric returns. Bitcoin was supposed to be an inflation hedge that did well in a volatile global macro environment. Isn’t that what we are experiencing at present time? Why is it that over the last 7 months Bitcoin has been one of the worst performers? What can we learn from this time frame? How can we better understand what are the key drivers to bitcoins price and use that understanding to better anticipate what might occur in the future?
When an asset offers asymmetric returns, it means that the potential upside is greater than the potential downside. In other words, there is more potential for gain than for loss. This type of investment is often attractive to investors because it offers the potential for high returns with lower risk. However, it is important to remember that asymmetric returns are not guaranteed, and there is always the potential for loss. As such, investors should only invest money that they are comfortable with losing.
Another key aspect to remember about asymmetric returns is that they are often unrelated to the overall market. This lack of correlation can be appealing to investors who are looking to diversify their portfolio. When asymmetric returns are uncorrelated with the market, it means that they are not affected by market fluctuations in the same way as traditional investments. As a result, asymmetric returns can offer a degree of stability in times of economic volatility.
Investors should remember that asymmetric returns are not without risk. However, when used properly, they can be a valuable tool for building wealth over time. When most people think of investments, they generally think of assets that are symmetrical in risk and reward. For example, stocks typically offer the potential for both significant gains and losses, and investors usually expect to see some level of correlation between different asset classes. However, there are a handful of assets that don’t fit neatly into this category. One example is Bitcoin, which is often referred to as an asymmetric asset. Asymmetric assets are those that have a disproportionate amount of upside relative to downside risk. In other words, investors in asymmetric assets stand to gain a lot if the asset increases in value, but they don’t stand to lose very much if the asset decreases in value. This lack of correlation makes asymmetric assets particularly attractive to investors looking for exposure to non-traditional assets. While asymmetric assets come with a certain amount of Risk, they also offer the potential for significant rewards.
Bitcoin is only 13 years old. My contention is that over the first decade of its existence bitcoin truly was an asymmetric asset. Its returns were not correlated to stocks, bonds, gold, or other assets. However, in the past few years many things have changed as bitcoin has garnered adoption from countries, companies, hedge funds, family offices and portfolio managers. This thesis is important to think about as we confront the current liquidity crisis in the markets.
Why?
When a de-leveraging event occurs, such as what we saw in 2008, and 2020 and at over the last six months, all asset prices go down in value. In these instances, the trading environment is risk-off and highly volatile assets are liquidated to try and preserve capital.
For portfolio managers, the risk environment is a key driver of investment strategy. The term “risk on” refers to a market where risk appetite is high, and investors are bidding prices up on riskier assets in search of yield. In this environment, portfolio managers look to increase their exposure to more controversial assets. They may also take on more leverage in order to boost returns. Conversely, when risk appetite is low and investors are risk-averse, the market is said to be “risk off.” In this environment, portfolio managers will tend to scale back on risk and focus on preserving capital. The goal is to make more money when the markets are doing well, and to protect capital when risk appetite is low.
Risk off environments are typically associated with increased volatility, as investors tend to trade more cautiously and avoid taking on unnecessary risk. As a result, risk off periods can present both opportunities and challenges for portfolio managers and traders. While riskier assets may be undervalued during these periods, it can also be difficult to find opportunities that offer an attractive risk-reward profile.
The simplest way that we can understand what is driving Bitcoin is to look at the current intermarket analysis and try to understand the key drivers to bitcoins fluctuations.
Intermarket analysis is the study of how different asset classes move in relation to one another. By understanding these relationships, traders can get a better sense of which assets are likely to move in the same direction and which are likely to move in opposite directions. This information can be used to minimize risk and maximize profits. Statistical correlations are a primary tool that traders and investors use to anticipate how different asset classes will move. By tracking these correlations, traders can get a better sense of which assets are likely to move together and which are likely to move in opposite directions. This information can be used to make more informed trading decisions and to minimize risk.
At present time here is what the intermarket analysis for bitcoin looks like:
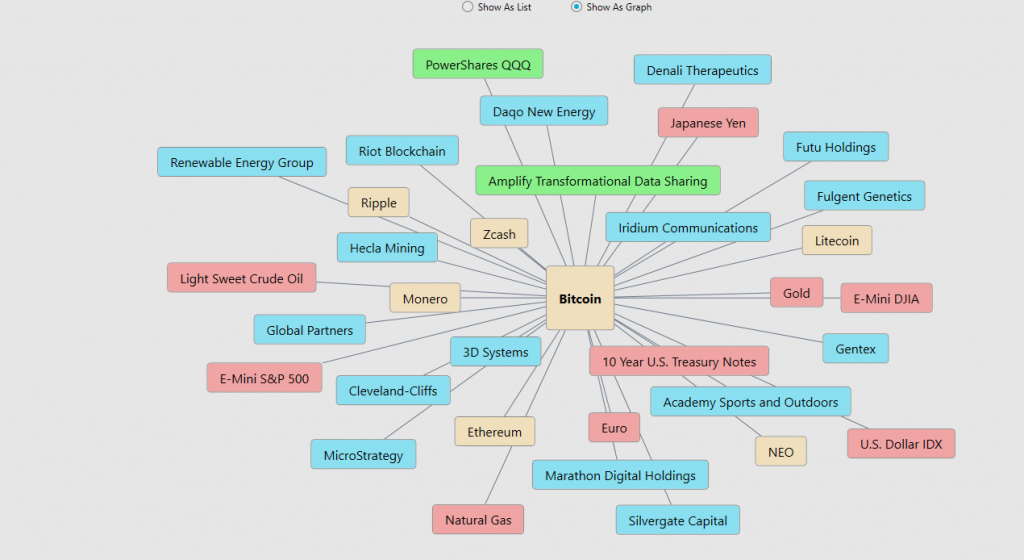
These assets are the key drivers to bitcoins price movement.
Let’s dig into a handful of them to better understand what is going on in the bitcoin market.
To interpret these numbers all you need to do is envision links in a chain. When bitcoin moves, the percentages above designate how often these designated assets will move in a similar or opposite direction.
From this simple graphic you can see which assets are most positively and negatively correlated to bitcoin.
It’s no surprise that other top cryptocurrencies are highly correlated to bitcoin. You would expect a very strong relationship in the crypto space since bitcoin is the top cryptocurrency.
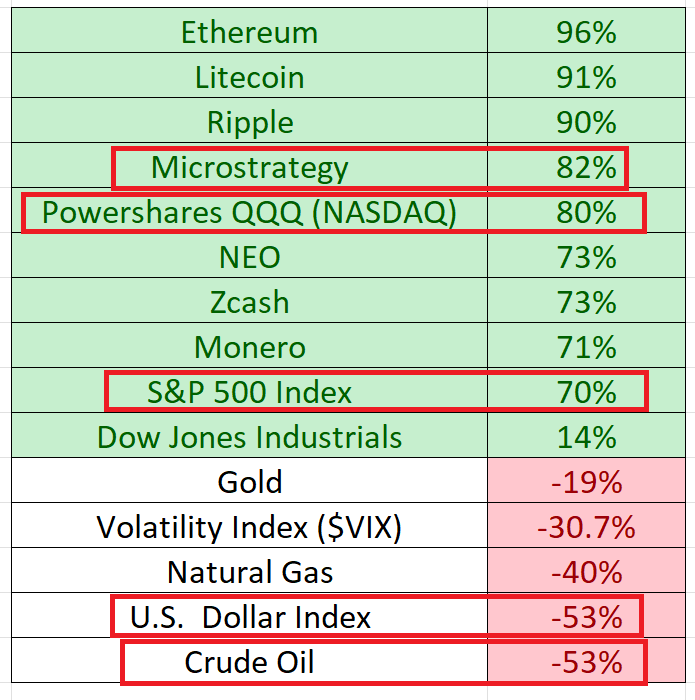
But consider the current reality that the S&P 500 Index is 70% correlated to bitcoin at the present moment. This is an all time high in terms of correlation and explains why the two assets are moving sympathetically.
I find it particularly interesting that the Powershares QQQ ETF ($QQQ) is 80% correlated to Bitcoin price action!
Portfolio managers pay very close attention to these correlations and when it is time to exit, they liquidate everything that is identified as correlated to a potential risky asset.
It should be no surprise to anyone who follows bitcoin that MicroStrategy ($MSTR) is 82% correlated to bitcoin. Michael Saylor, CEO of MicroStrategy, cleverly positioned his company as a stealth bitcoin alternative for pensions funds and institutional money that was prohibited from investing in bitcoin.
On the negative correlation front we have the U.S. Dollar trading at a 20 year high in comparison to other fiat currencies. The greenback is currently negative 53% correlated to bitcoin.
Likewise, Crude Oil is trading at 10-year highs and is up 47% since the beginning of the year. It is currently showing a negative 53% correlation to bitcoin.
For the last 7 months we have been in a giant RISK OFF environment. What is most interesting is that these correlations do not last forever. In other words, bitcoin will not remain correlated to stocks forever.
Whenever these massive deleveraging events occur, I like to look at the big picture. In March 2000, the dotcom bubble burst and the outcome of that event was that thousands of high-flying internet stocks became worthless, but it did not prove that it was the end of the internet. Likewise, thousands of crypto coins will suffer a similar fate unless they can prove that they actually have real utility and value. The cryptoconomy is capable of solving numerous real-world problems and these are the growing pains that new industries must go through to demonstrate their worthiness. This massive selloff in the crypto space is necessary for the losers to face extinction and for the winners to build a better financial system.
But here is what I found most educational and inspiring of all. As I have mentioned in previous blog posts, history is understood depending upon where your starting and ending points are. The media loves to look at the fact that Bitcoin has sold off as much as 73% from its all-time high. That is not fun. But Bitcoin has done this numerous times in the past 13 years.
What I find particularly instructive is to look at the intermarket analysis and statistical correlations and compare performance of EVERYTHING from the start of the pandemic. The economic lockdown and covid-19 were black swan events which shook the foundations of the financial markets. Starting from March 31, 2020, to present time bitcoin has still generated 205% returns. This speaks volumes and provides a thorough and valid analysis of VALUE when compared to all of the other major asset classes. The last 27 months have been a trial by fire for all markets and the following comparative analysis defines who performed best during all of the monetary shenanigans, shilling, hype, fear, uncertainty, and doubt that were daily headline fodder.
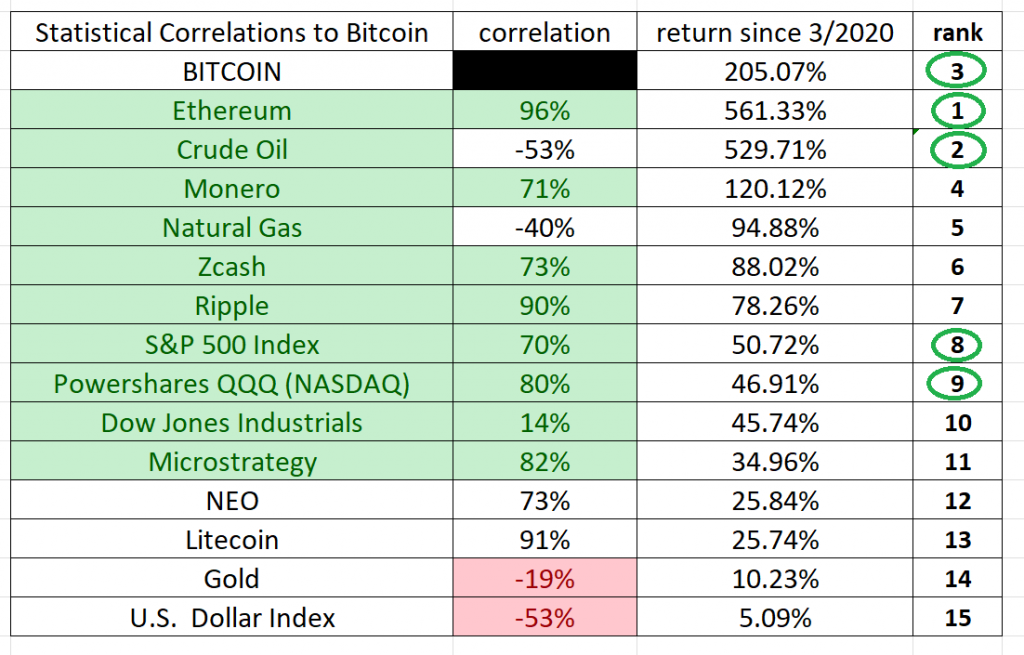
Naturally, if you would look at the last seven months you would get an entirely different picture and would be convinced that crypto was dead. However, in spite of its 70% plus selloff since the beginning of the year, since the start of the pandemic, bitcoin is showing a 205% positive return! Comparatively speaking the S&P 500 Index generated a 50.72% return. The table above is worthy of your attention, and I hope you can draw important insights that will help your trading.
We are in the midst of a massive liquidation and deleveraging event which is similar to March 2020 and the 2008 Great Financial Crisis. I vividly recall when the March bottoms were made how bleak everything looked.
There are many important questions which still linger and will affect the financial markets moving forward.
Will the Fed continue raising interest rates for the remainder of 2022.
Will the Fed try to liquidate its balance sheet?
What type of regulation will the crypto space endure after the meltdown of Luna and USDT?
When will the Fed and U.S. Treasury try to roll out their Central Bank Digital Currencies?
I do not have answers to these questions. They are important. But a good trader armed with artificial intelligence does not need answers to these pivotal questions to be able to make smart and effective trading decisions. Great trading is all about developing a supreme loyalty to the trend. The most effective way to do that is by combining the power of artificial intelligence, machine learning and neural networks.
One picture paints a thousand words.
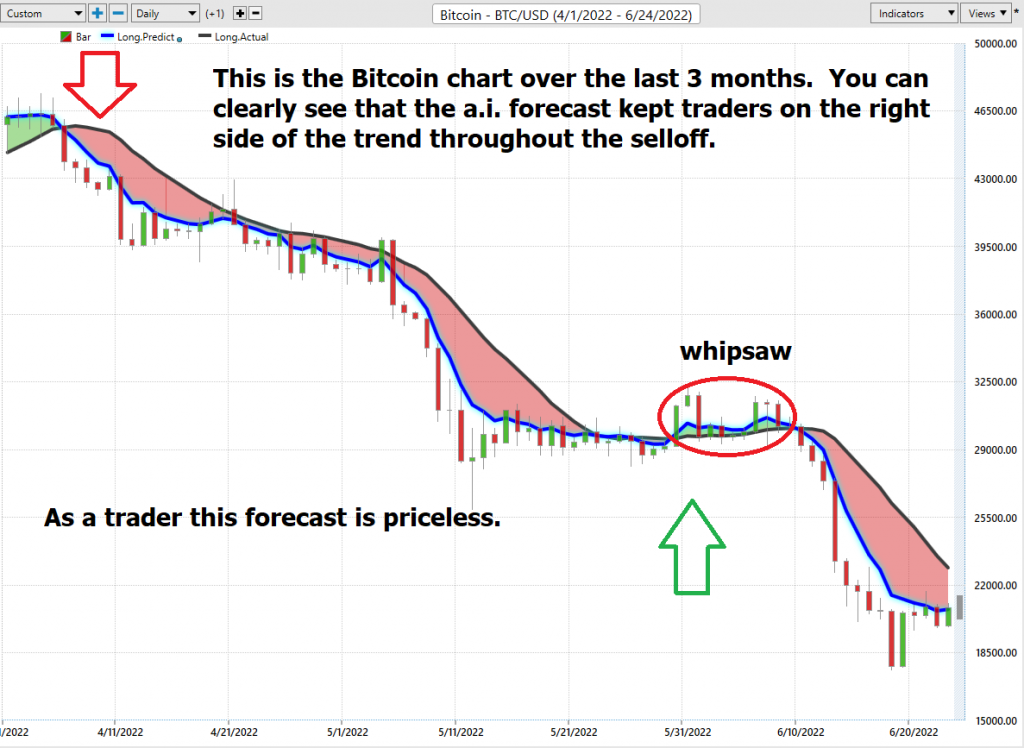
Traders have to focus on what “IS” happening. The Vantagepoint A.I. forecast focuses on the “IS” with exacting precision.
We are witnessing incredible volatility as a result of the complexity the arises when you confront the intersection of the legacy financial system and digital gold. But the artificial intelligence continues to excel in keeping traders on the right side of the right trend at the right time.
Finding value is becoming a completely consuming activity on the part of traders and investors. The target moves quickly based upon too many factors that remain unseen to the naked eye.
Most traders have problems with the timing of their trades.
If you want to win, it’s all about who has the best tools.
The beauty of neural networks, artificial intelligence, and machine learning are they are fundamentally focused on pattern recognition to determine the best move forward. When these technologies flash a change in forecast – pay attention, it is newsworthy.
We often do not understand why something is occurring but that does not mean that we cannot take advantage of it.
Remember What’s Important.
Price is the only thing that matters when we are trading. It is what can make you wealthy or decimate your account. Everything else is just noise. Stories are everywhere offering drama, fear, and endless dreamlike opportunity.
Are you capable of finding those markets with the best risk/reward ratios out of the thousands of trading opportunities that exist?
Knowledge.
Useful knowledge.
And its application is what A.I. delivers.
Isn’t that what we all want from the markets? Consistency.
See for yourself how a machine-based learning software makes it easier to find statistically solid trends and generates better returns with less risk.
Most traditional indicators that traders use today were developed in the 1970’s and 1980’s. They are incapable of telling you what the market is going to do moving forward.
Once again, machine outperforms humanoid.
It’s important that you find out more and discover why artificial intelligence keeps traders on the right side of the trend at the right time.
Join us for a FREE, Live Training. We’ll show you at least three stocks that have been identified by the A.I. that are poised for big movement… and remember, movement of any kind is an opportunity for profits!
Discover why artificial intelligence is the solution professional traders go-to for less risk, more rewards, and guaranteed peace of mind.
Visit with us and check out the A.I. at our Next Live Training.
It’s not magic. It’s machine learning.
Make it count.

IMPORTANT NOTICE!
THERE IS SUBSTANTIAL RISK OF LOSS ASSOCIATED WITH TRADING. ONLY RISK CAPITAL SHOULD BE USED TO TRADE. TRADING STOCKS, FUTURES, OPTIONS, FOREX, AND ETFs IS NOT SUITABLE FOR EVERYONE.
DISCLAIMER: STOCKS, FUTURES, OPTIONS, ETFs AND CURRENCY TRADING ALL HAVE LARGE POTENTIAL REWARDS, BUT THEY ALSO HAVE LARGE POTENTIAL RISK. YOU MUST BE AWARE OF THE RISKS AND BE WILLING TO ACCEPT THEM IN ORDER TO INVEST IN THESE MARKETS. DON’T TRADE WITH MONEY YOU CAN’T AFFORD TO LOSE. THIS ARTICLE AND WEBSITE IS NEITHER A SOLICITATION NOR AN OFFER TO BUY/SELL FUTURES, OPTIONS, STOCKS, OR CURRENCIES. NO REPRESENTATION IS BEING MADE THAT ANY ACCOUNT WILL OR IS LIKELY TO ACHIEVE PROFITS OR LOSSES SIMILAR TO THOSE DISCUSSED ON THIS ARTICLE OR WEBSITE. THE PAST PERFORMANCE OF ANY TRADING SYSTEM OR METHODOLOGY IS NOT NECESSARILY INDICATIVE OF FUTURE RESULTS. CFTC RULE 4.41 – HYPOTHETICAL OR SIMULATED PERFORMANCE RESULTS HAVE CERTAIN LIMITATIONS. UNLIKE AN ACTUAL PERFORMANCE RECORD, SIMULATED RESULTS DO NOT REPRESENT ACTUAL TRADING. ALSO, SINCE THE TRADES HAVE NOT BEEN EXECUTED, THE RESULTS MAY HAVE UNDER-OR-OVER COMPENSATED FOR THE IMPACT, IF ANY, OF CERTAIN MARKET FACTORS, SUCH AS LACK OF LIQUIDITY. SIMULATED TRADING PROGRAMS IN GENERAL ARE ALSO SUBJECT TO THE FACT THAT THEY ARE DESIGNED WITH THE BENEFIT OF HINDSIGHT. NO REPRESENTATION IS BEING MADE THAT ANY ACCOUNT WILL OR IS LIKELY TO ACHIEVE PROFIT OR LOSSES SIMILAR TO THOSE SHOWN.

