
On March 31, 2022, we did our Stock of The Week analysis on $TBT which is an Inverse Treasury ETF. Since that writing we have seen TBT rally 31% in the last 48 trading sessions. I can’t emphasize enough how huge a move this is for the Credit Markets. You can read our original analysis here.
The Bond markets of the world have been extremely nervous over the past six months. It is something we have written about at great length on this blog. The problem that I have with the financial media reporting of this is how they present the facts. For example, last week the Greek Bond yield increased 67 basis points (bps). In Italy yields have increased 167 basis points in the last ten sessions.
A layman reading that information can easily overlook its significance. When the yield increases from 1% to 1.5% it is written about as if it is only a .50 basis point increase. While that is 100% true, it needs to be more accurately stated and emphasized that the borrowing cost to the debtor increased 50%.
This is not pessimistic. Rather it is to understand the threat that the bond markets pose to the rest of the financial system.
If a debtor is having trouble meeting its obligations at 1% what makes you think they will be able to do when their borrowing cost increases 50%?
This is one of the most important financial issues of our day and needs to be understood with that context in mind.
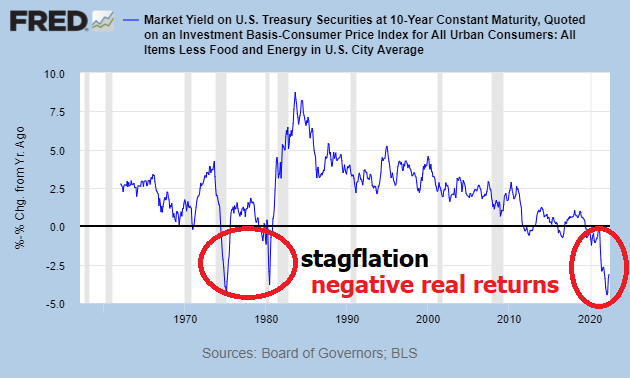
What is essential for all traders and investors to understand is the real rate of return that the government is promoting for bond investors.
The 10-year Treasury Note is offering 3.5%.
The last Consumer Price Index report on Inflation was 8.6%.
When you do the math, you are losing -5.1% every year by loaning your money to the U.S. government.
Over the last 14 years the Fed has manipulated interest rates to near zero percent. They claimed this would stimulate growth and accentuate an economic recovery. Instead, what we got was trillions more of additional debt on the Government and Feds balance sheet. More importantly, the REAL RATE of Return on U.S. Treasuries has made investing in Government debt completely unattractive.
This is a tragedy playing out in real-time as the logical extension of the “Too Big to Fail” policies which were launched at the start of the Great Financial Crisis.
The ONLY way that a NEGATIVE -5.1% REAL Rate of Return looks marginally attractive is if the rest of the financial marketplace looks like a dumpster fire.
To correct this problem and get inflation under control the FED has stated that they will be raising interest rates throughout 2022 and 2023. As you listen to that potential reality unfold, consider the percentage increase in borrowing costs that are taking place, and the effect that has on the overall economy.
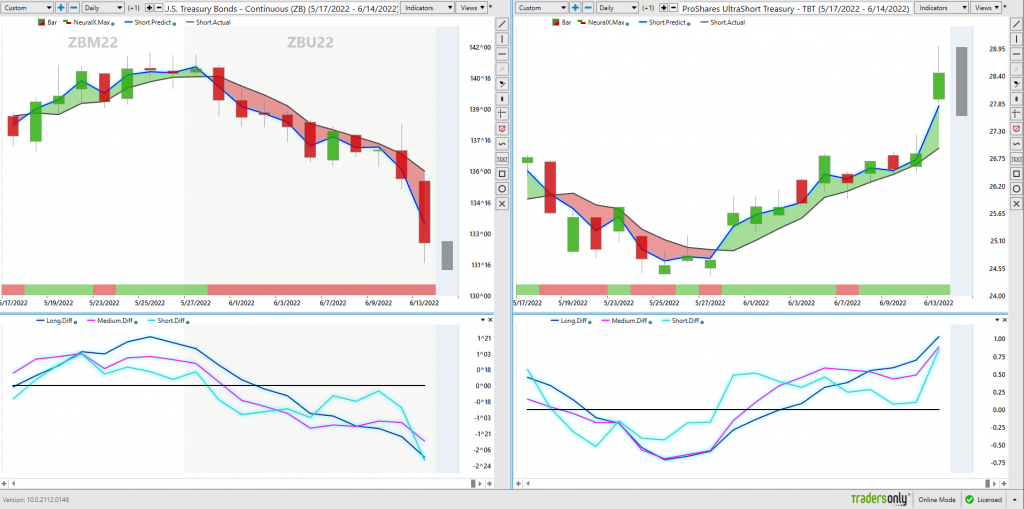
Here is an example of what has occurred in the past 10 weeks since we published our first analysis on $TBT.
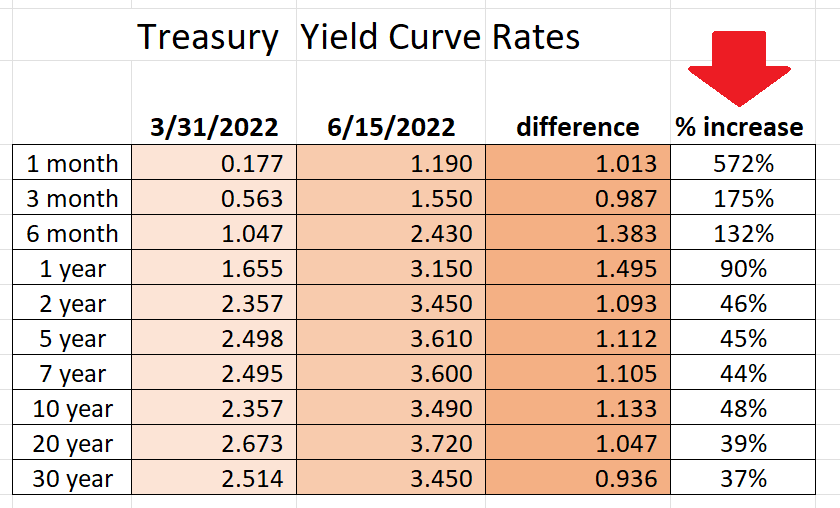
Borrowing costs are escalating quickly and exponentially, while problematic debt to GDP ratios of Sovereign nation-states are being scrutinized very carefully. Central Banks of the world and Nation States are between a rock and a hard place.
How do they finance their obligations? Historically there are two choices: Inflate or Default.
This problem is international. Every nation is awash in debt and only capable of offering negative real rates of return to their creditors. Initially, the solution is the printing press so that they can payback the debt in inflated currency.
Let me share with you an unbridled opinion that I think is quickly becoming fact.
Look at the following chart of the Japanese Yen over the last 2 years. It is down 18% year over year. Down 24% over the last 2 years. Why is this important?
Japan has the highest debt to GDP ratio of any country in the world. The higher the debt to GDP ratio is the less likely the country will be capable of paying back its debt in non-inflated currency, and the higher the risk of default.
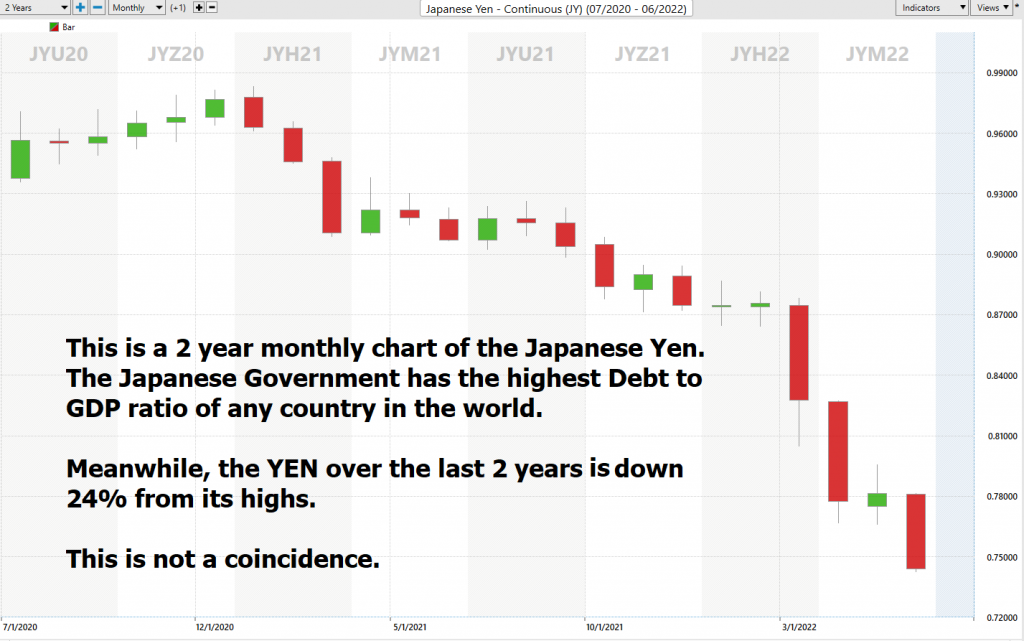
Currently, the Japanese Debt to GDP ratio stands at 236%!
The United States Debt to GDP ratio is 137.2%. Study the following chart by the Saint Louis Federal Reserve. Pay particular attention to how the ratio has continued to deteriorate since the Great Financial Crisis in 2008.
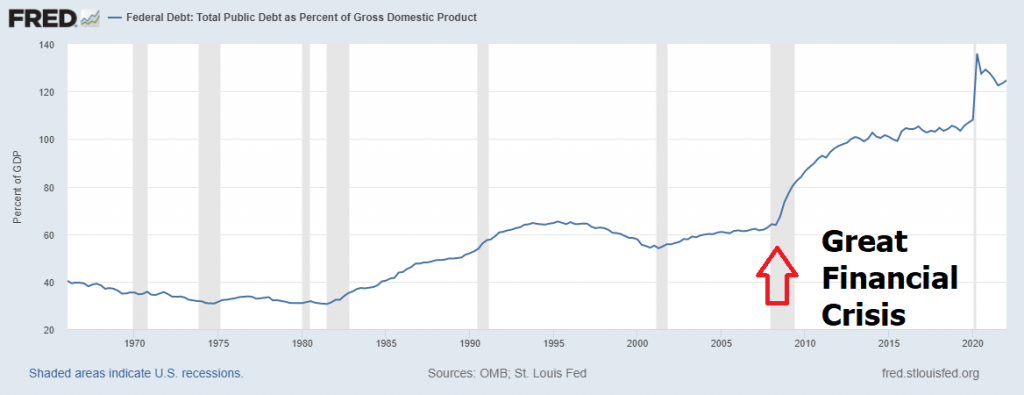
US Treasury obligations were always considered to be as good as gold. Retirees would invest their life savings in U.S. Debt and try to live off of the interest. Today the inverse is true. Today, what logical reason can be used to invest in U.S. Treasuries?
Since 2009 U.S. Debt grew 300% faster than the economy. Not exactly a sign of vibrancy by the most liberal of accounting standards. We wrote about this on July 1, 2021 in our article, “The Zombification of Markets and the Economy.”
Remember all of those stimulus payments? They have been turned off and critics of the program now claim that we must confront the hangover that accompanies the interest rate manipulation of the last 14 years.
Today’s drama in the financial markets has all of the makings of a spy drama. Inflation fears. Surging global bond yields. Acute currency instability. Rampant Credit growth. Policy paralysis and massive geopolitical tensions.
It’s a perfect recipe for falling Treasury prices.
As I write these words, the Fed has raised the Fed Funds rate .75 basis points.
This is the largest rate increase in 28 years.
Expect lower economic growth and persistent inflationary pressure.
Keep your eyes peeled on the real rate of return by subtracting the inflation # from the 10-year bond yield. Or watch this chart monitoring real rates published by the Saint Lous Fed.
All of these factors build a very convincing thesis for us to look at trading bonds from the short side, or to buy the $TBT ETF. As you read through this analysis, we urge you to constantly weight risk versus reward on each and every trade while practicing good money management.
Today there are numerous ways in which a trader can capitalize on a declining bond market. In this analysis we will analyze and explore the opportunity of INVERSE ETF’ on the ProShares UltraShort Treasury. The trading symbol is $TBT.
An inverse ETF is an exchange traded fund (ETF) created by using various derivatives to profit from a decline in the value of an underlying benchmark. Derivatives are instruments like options and futures contracts. Investing in inverse ETFs is similar to holding various short positions, which involve borrowing securities and selling them with the hope of repurchasing them at a lower price.
An inverse ETF is also known as a “Short ETF” or “Bear ETF.” Traders use inverse ETFs to inversely track an underlying index or group of investments you believe will drop in value. Or they use these instruments to hedge against downside risk in similar investments you own (in a long position).
Inverse ETFs allow investors to make money when the market or the underlying index declines, but without having to sell anything short. The value of the ETF is directly inverse to the value of the Index it is tracking.
The largest and most successful inverse ETFs aim to deliver the opposite returns of major indexes it tracks.
In this weekly stock study, we will look at and analyze the following indicators and metrics as are our guidelines to determine how to trade the $TBT ETF.
- 52-week high and low boundaries
- Best Case-Worst Case Analysis
- Vantagepoint A.I. Forecast (Predictive Blue Line)
- Neural Network Forecast
- Daily Range Forecast
- Intermarket Analysis
- Our trading suggestion
This basic framework is how we track and monitor what is winning in the marketplace. Then we focus on what the artificial intelligence is recommending. Combining these two aspects into our decision-making process is how we stay on the right side of the right trend at the right time.
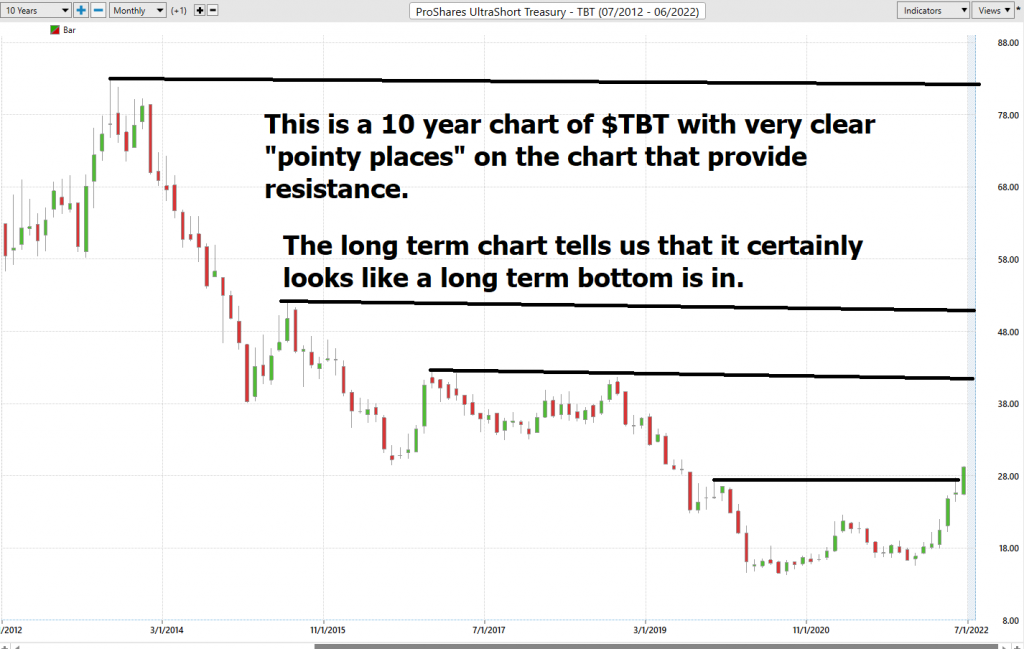
52-week High-Low Chart
Great traders focus on what is working and what is winning. Creating a list of stocks that are approaching or have successfully breached their 52-week highs is the foundation of how trading success is created.
In other words, market selection is the primary element for determining market success.
Show me a lousy trader and I contend that they are choosing lousy markets to trade. Show me a great trader and I contend that they are focusing on markets with established trends. This distinction is vital for you to ponder.
First let’s look at the very long-term trend. Here is a ten-year chart of $TBT. Since this is an inverse ETF, you can quickly see that since interest rates have dropped like a brick over the last decade the value of this ETF has been in a persistent downtrend until recently.
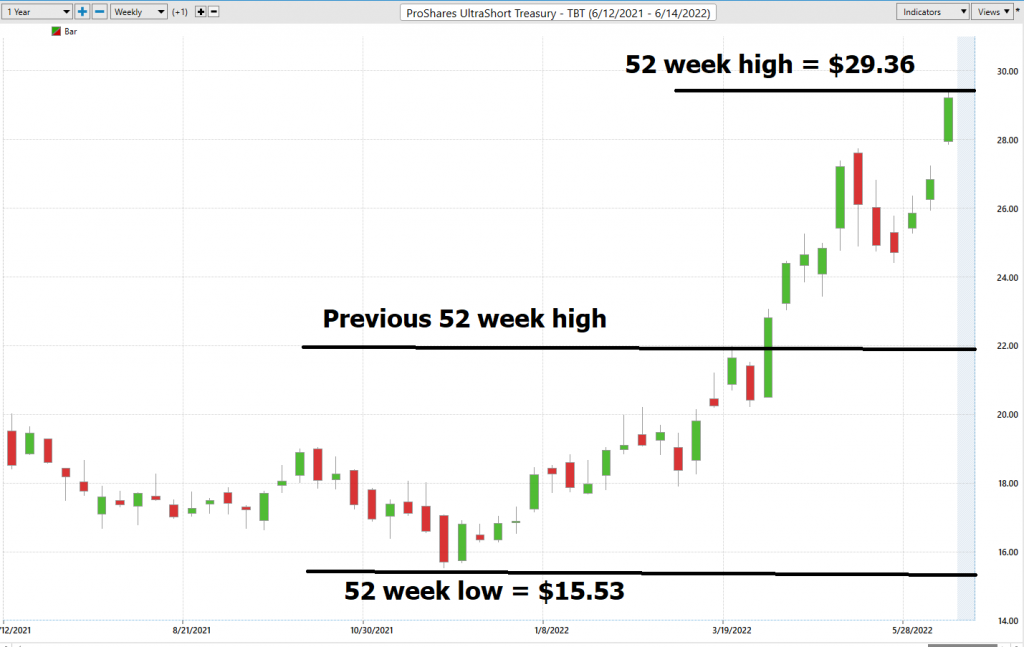
When we zoom in to the 52-week chart, you can see why we put this on Power Traders radar 11 weeks ago. The 52-week high was in the process of being breached. While we were confident in expecting an uptrend, we must admit that we were not anticipating a 31% move in 11 weeks. This is a move for a high-flying stock, but in the credit markets this is an ENORMOUS move with massive consequences.
For the $TBT to move higher it means that Bonds have to move lower. Which means that a whole lot of bond liquidation has been going on over the last 11 weeks.
Let’s look at the annual scoreboard before we comment further.
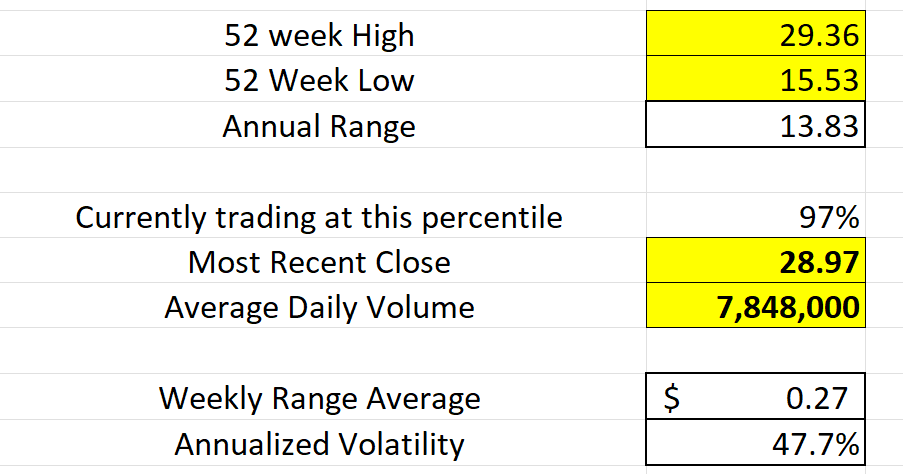
While over the last year the average weekly trading range has been $.27. In the most recent weeks, the volatility has skyrocketed over 5 times that amount.
One of our common sense benchmarks is looking at the trading range for a specific time frame and adding and subtracting that range from the most recent close to establish what we call volatility boundaries.
Over the last 52 weeks $TBT has traded as high as 29.36 and as low as 15.53.
Based upon the high and low prices we can quickly see that the annual trading range of $TBT has been $13.83. This tells us that the average weekly trading range is roughly .27.
What we often like to do as well is to divide the annual trading range (13.83) by the current price ($28.97) this gives us a very basic estimate of annualized volatility. Current annualized volatility is 47.7%. This metric essentially tells us that in one year, we can expect $TBT trading range for the following year to be trading $13.83 higher and/or lower from current levels.
Here are the volatility boundaries based upon recent ranges and this simple logic:
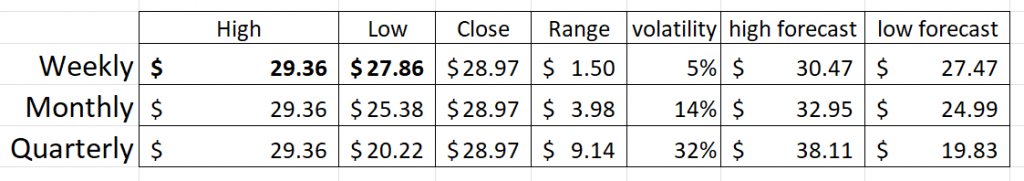
We refer to these as the commonsense metrics which we use as baseline measurements of understanding normal value. When using artificial intelligence, we look to amplify our returns based upon these baseline measurements.
What we like about this situation:
Volatility is increasing as bond liquidation has begun. Weekly volatility on the year is 27 cents while in the last week it was $1.50.
The Fed has promised to raise interest rates 6 more times in the next two years. The bond market has been factoring in these rate hikes. Can the Fed usher in a soft landing without creating a recession?
That waits to be seen as many think we are already in a recession.
While we don’t trade on fundamentals, we have learned that when the a.i. creates an UP forecast it presents a great opportunity in this environment.
Pay Attention.
Best Case – Worst Case Scenarios
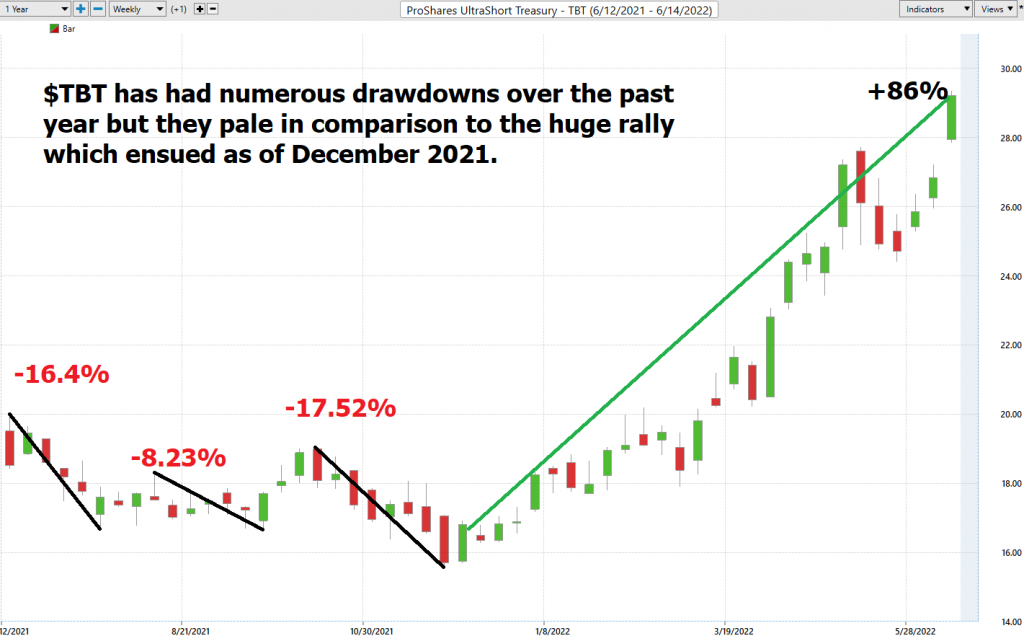
Next, we want to look at the trend over the past year and evaluate the strength of the rallies in relation to the declines
When we look at the drawdowns in this sector over the past year, they have been between 8% and 17.5%. You would expect this type of decline in a falling interest rate environment. But those drawdowns pale in comparison to the 86% rally we have seen in $TBT since December 2021.
As a trader we think that buying pullbacks in the current environment with good money management will prove to be a good trade.
Over the past year:
So, in $TBT we clearly see what is working and who is winning.
Selling bonds short has been a winning strategy for the first half of 2022.
The Vantagepoint A.I. Analysis
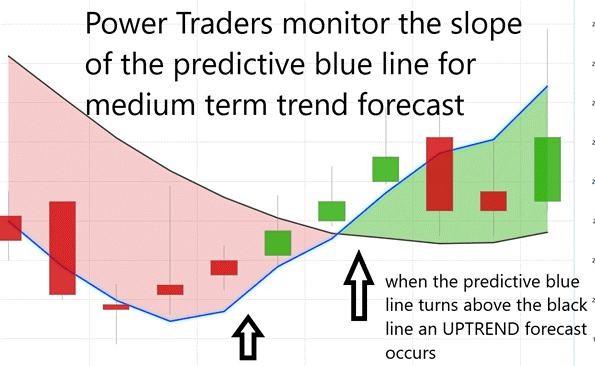
Using VantagePoint Software and the artificial intelligence, traders are alerted to trend forecasts by monitoring the slope of the predictive blue line. The black line is a simple 10 day moving average of price which simply tells you what has occurred in the market. The predictive blue line also acts as value zone where in uptrends traders try to purchase the asset at or below the blue line.
In studying the chart below pay close attention to the slope of the blue line. Anytime the blue line crosses the zero intercept is a trend signal. If the line crosses from down to up, an UP-trading opportunity exists. If the line crosses from Up to down the down trading opportunity exists.
Power traders use the predictive blue line in helping to determine both the value zone as well as the trend direction. Study the slope of the predictive blue line to determine the medium-term trend direction.
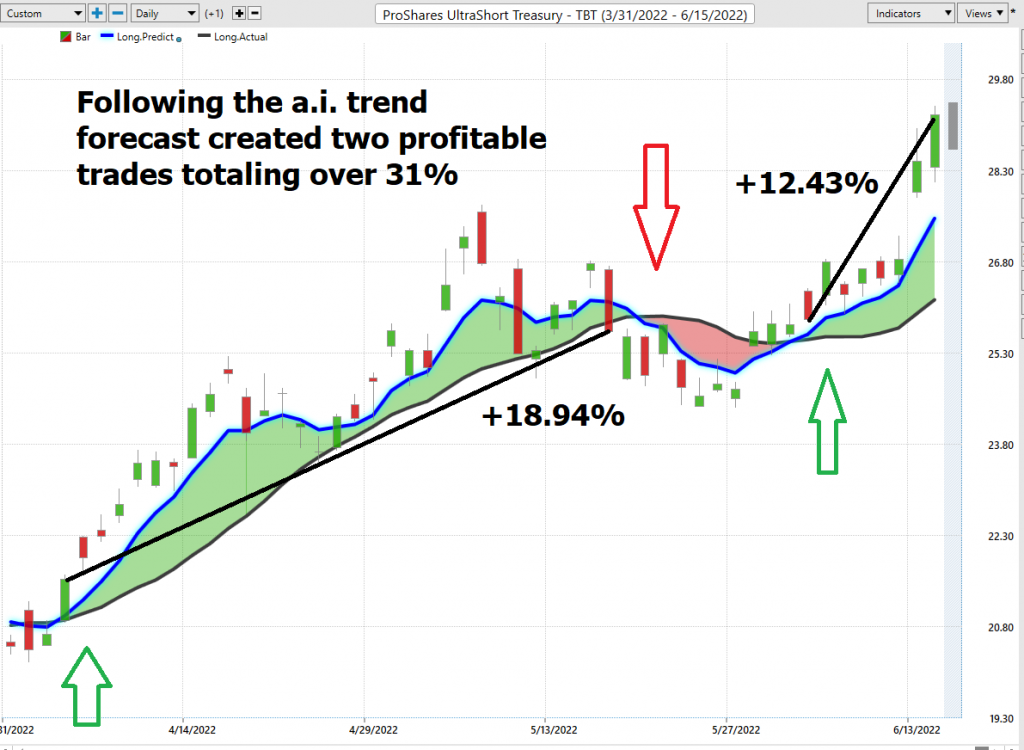
There is a huge gap on the $TBT chart between 27.23 and 27.86. Keep an eye on this area of the chart for potential pullbacks and swing trading opportunities.
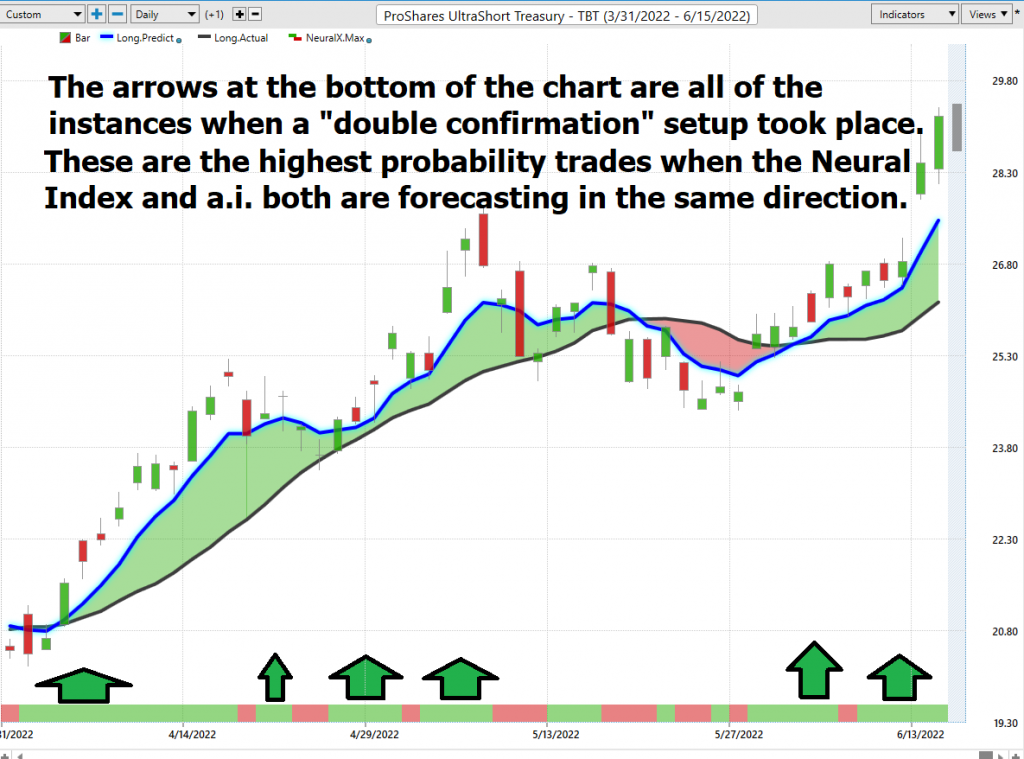
Fine Tuning Entries with The Neural Net Indicator
At the bottom of the chart is the Neural Network Indicator which predicts future strength and/or weakness in the market with a 48-to-72-hour time horizon.
A Neural Net is a computational learning system that uses a network of functions to understand and translate massive amounts of data into a desired output, consistently monitoring itself and improving its performance.
When the Neural Net Indicator is green it communicates strength. When the Neural Net is Red it is forecasting short term weakness in the market.
We advocate that Power Traders cross reference the chart with the predictive blue line and neural network indicator to create optimal entry and exit points. This provides what we refer to as the DOUBLE CONFIRMATION setup.
Power Traders are always looking to apply both the neural network and a.i. to the markets to find statistically sound trading opportunities.
VantagePoint Software Daily Price Range Prediction
The purpose of all these indicators so far is to help traders stay on the right side of the right trend at the right time.
One of the powerful features in the Vantagepoint A.I. Software which Power Traders use daily is the Daily Price Range prediction forecast.
Over the 12 weeks the average daily trading range has been .67.
The largest daily trading range has been $1.56.
Using the previous forecasts traders have highly effective means of defining value.
But the daily trading range forecast is where the rubber meets the road. Power Traders are capable of shortening their trading horizons using the anticipated trading ranges provided in the daily forecast.
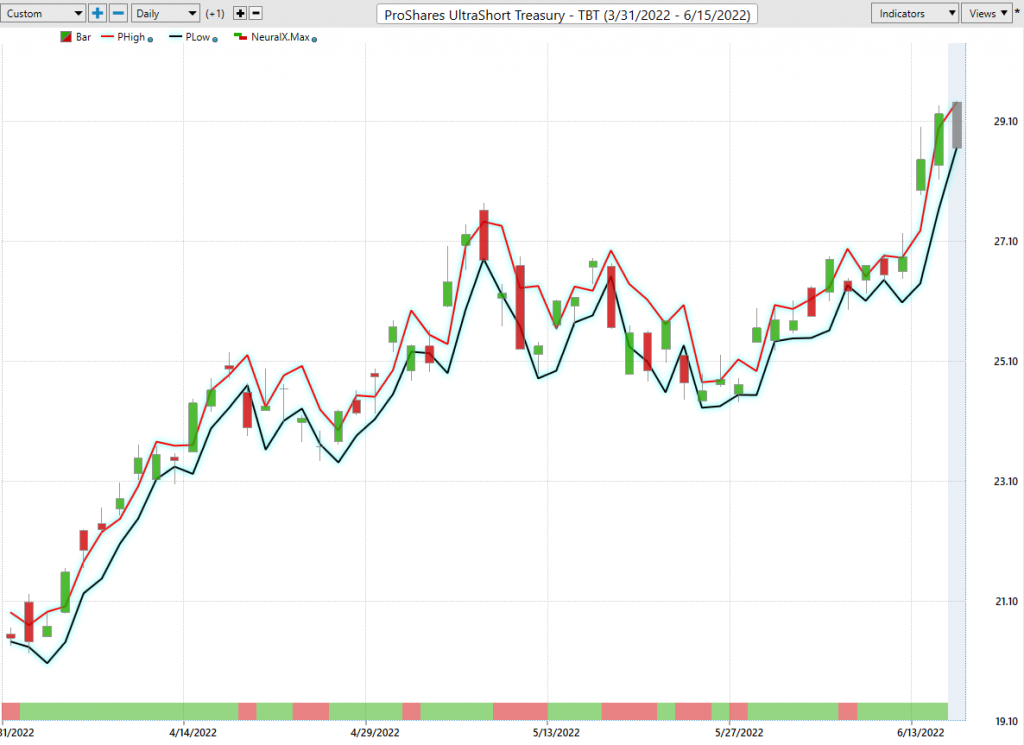
This forecast is what permits Power Traders to truly fine tune their entries and exits into the market often looking for smaller time frames and more granular trading opportunities.
All of the tools so far in this analysis attempt to define value and to clearly identify the trend and points within the trend where traders should look to capitalize on.
Intermarket Analysis
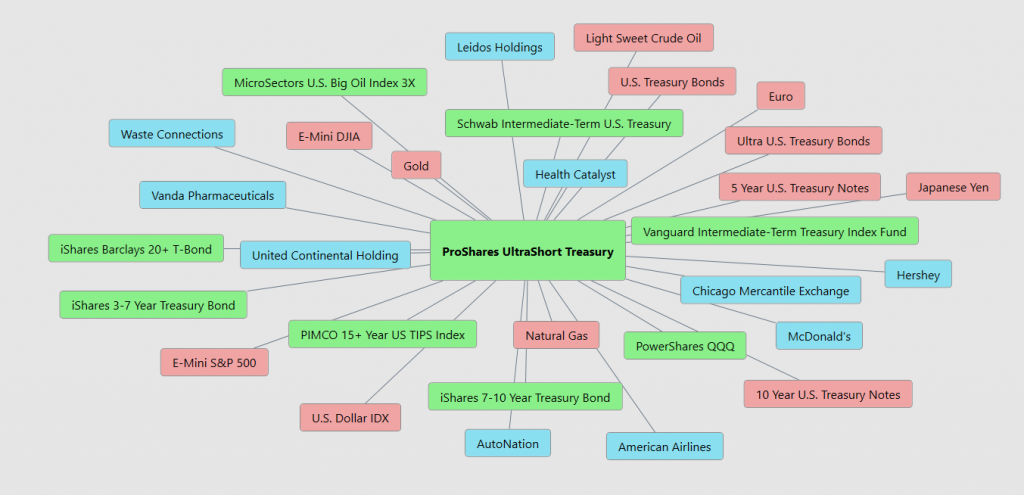
What makes the Vantagepoint Software unique is its ability to perform Intermarket analysis and to locate those assets which are most interconnected that are responsible for driving the price of $TBT higher or lower.
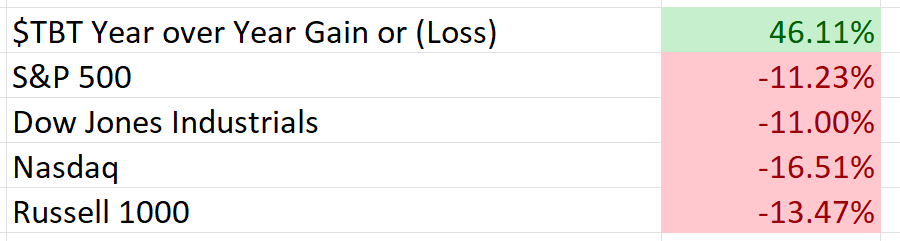
Earlier we saw that over the past 12 months $TBT is up 46.1%.
I can’t emphasize this point enough. Market selection is the primary essential element to long term success. You have to find markets with strong directionality and strong volatility.
The graphic below shows you all of the strongest positive and negative correlations for $TBT. $TBT is 81% correlated to Crude Oil prices.
$TBT is -79% correlated to the S&P 500 Index.
For this reason, as we approach a recognizable stagflationary economy we think that $TBT will prove to be a great trading and investment vehicle.
While it is an Inverse ETF on Treasury prices a key driver of higher interest rates is rising Crude prices. This is the kind of power that is at your fingertips when you use the Vantagepoint A.I. software.
Studying the charts can always provide objective realities in terms of locating support and resistance levels which become clear on a chart. But we live in a global marketplace. Everything is interconnected. The billion-dollar question for traders is always what are the key drivers of price for the underlying asset that I am trading?
These intangibles are invisible to the naked eye yet show remarkably high statistical correlations.
Small changes in Interest rates, Crude Oil Prices, and the Volatility of the dollar amongst thousands of other variables affect the decisions companies must make to survive in these challenging times. Trying to determine what these factors are is one of the huge problems facing investors and traders.
There is immense value to be had in studying and understanding the key drivers of $TBT price action. This graphic presents a plethora of opportunities that can quickly be explored within the software.
This is an amazing research tool that consistently uncovers future gems.
Our Suggestion
In our estimation, and as we have written extensively in our blog posts over the past few years, what is driving the stock markets is a chase for yield, all fueled by Fed Stimulus and low interest rates. This craze has been in play since the Great Financial Crisis of 2008. The Fed is trying to remove the punchbowl from the party without crashing the markets or the economy.
We think the Fed is between a rock and a hard place and as much as they want to raise rates, they recognize that the risk is sky high.
While we are not fundamental traders, we pay attention to the narrative and cannot see any reason why investors would want to purchase U.S. Treasuries. It saddens us to say this, but we are mimicking what the Bank of Japan has done with their economy and bonds for the last 30 years.
For this reason, we think that $TBT is worthy of your consideration either as a hedge against your portfolio or to capitalize on a falling bond market.
Pay close attention to the a.i forecast and position yourself accordingly.
There is great support underneath the current market between $27.23 and $27.86 we expect any pullbacks into this zone to be brief.
The one factor that separates great traders from amateurs is money management.
We understand the reality that $TBT will move higher as BONDS continue to liquidate.
IN other analyses we have discussed the Crude Oil market which looks extraordinarily strong to us and is highly correlated to strong inflationary pressures.
We think that the volatility will be increasing in stocks throughout 2022. As it does $TBT should do quite well. Look to buy retracements in this asset with tight stops always practicing good money management. And tight stop placement.
We think it is prudent to look for buying opportunities in any breaks in the price action.
Let’s Be Careful Out There!
Remember, It’s Not Magic.
It’s Machine Learning.

IMPORTANT NOTICE!
THERE IS SUBSTANTIAL RISK OF LOSS ASSOCIATED WITH TRADING. ONLY RISK CAPITAL SHOULD BE USED TO TRADE. TRADING STOCKS, FUTURES, OPTIONS, FOREX, AND ETFs IS NOT SUITABLE FOR EVERYONE.
DISCLAIMER: STOCKS, FUTURES, OPTIONS, ETFs AND CURRENCY TRADING ALL HAVE LARGE POTENTIAL REWARDS, BUT THEY ALSO HAVE LARGE POTENTIAL RISK. YOU MUST BE AWARE OF THE RISKS AND BE WILLING TO ACCEPT THEM IN ORDER TO INVEST IN THESE MARKETS. DON’T TRADE WITH MONEY YOU CAN’T AFFORD TO LOSE. THIS ARTICLE AND WEBSITE IS NEITHER A SOLICITATION NOR AN OFFER TO BUY/SELL FUTURES, OPTIONS, STOCKS, OR CURRENCIES. NO REPRESENTATION IS BEING MADE THAT ANY ACCOUNT WILL OR IS LIKELY TO ACHIEVE PROFITS OR LOSSES SIMILAR TO THOSE DISCUSSED ON THIS ARTICLE OR WEBSITE. THE PAST PERFORMANCE OF ANY TRADING SYSTEM OR METHODOLOGY IS NOT NECESSARILY INDICATIVE OF FUTURE RESULTS. CFTC RULE 4.41 – HYPOTHETICAL OR SIMULATED PERFORMANCE RESULTS HAVE CERTAIN LIMITATIONS. UNLIKE AN ACTUAL PERFORMANCE RECORD, SIMULATED RESULTS DO NOT REPRESENT ACTUAL TRADING. ALSO, SINCE THE TRADES HAVE NOT BEEN EXECUTED, THE RESULTS MAY HAVE UNDER-OR-OVER COMPENSATED FOR THE IMPACT, IF ANY, OF CERTAIN MARKET FACTORS, SUCH AS LACK OF LIQUIDITY. SIMULATED TRADING PROGRAMS IN GENERAL ARE ALSO SUBJECT TO THE FACT THAT THEY ARE DESIGNED WITH THE BENEFIT OF HINDSIGHT. NO REPRESENTATION IS BEING MADE THAT ANY ACCOUNT WILL OR IS LIKELY TO ACHIEVE PROFIT OR LOSSES SIMILAR TO THOSE SHOWN.

