
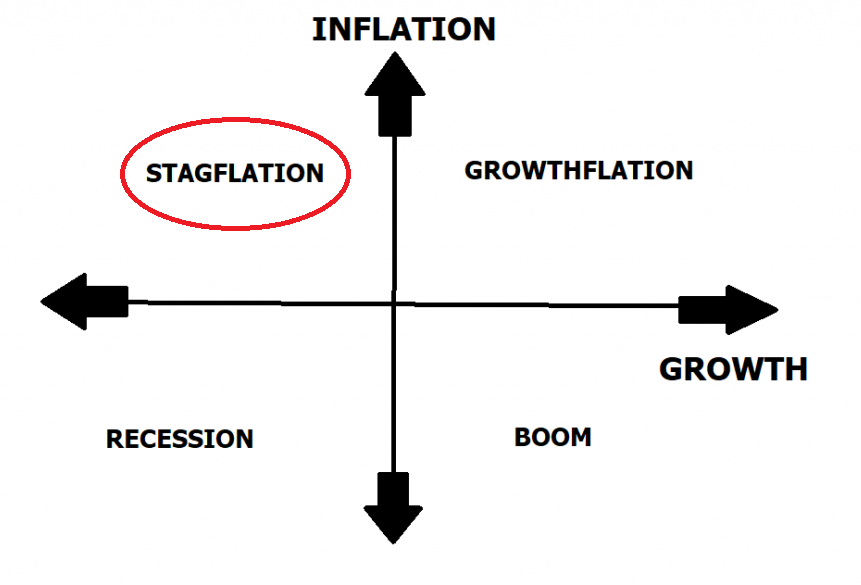
Stagflation is defined as INCREASING INFLATION accompanied by DECREASING GROWTH. This is by far the hardest and most challenging economic environment for businesses to operate in. For traders and investors, it is an extremely defensive environment where your primary concern is not necessarily growth but protection.
To understand the dilemma that stagflation you must contrast growth against inflationary pressures. It can best be represented with the following graphic which clearly delineates 4 possible quadrants that the economy can be in at any time.
In this article, we will explain stagflation in great detail, how it is caused, and which assets perform well under these economic circumstances.
What Is Stagflation?
Stagflation is an economic condition that occurs when there is stagnation in economic growth coupled with high inflation. This combination leads to a decrease in purchasing power for individuals, as their money becomes worth less and less while prices for goods and services increase. While stagflation can be caused by a number of factors, it typically happens when there is a decrease in demand for goods and services coupled with an increase in the money supply. When this happens, businesses are hesitant to invest and expand, leading to a slowdown in economic growth. At the same time, the increase in the money supply leads to higher prices for goods and services, as there is more money chasing the same amount of goods.
This combination of slower economic growth and higher prices can be very detrimental to people’s finances, as their purchasing power decreases while the costs of goods and services rise. Concisely stated, in a stagflation people and businesses are earning less and spending more.
In order to understand how stagflation affects your finances, it is first important to understand what causes it. Stagflation is usually caused by a decrease in aggregate demand, which can be the result of high interest rates, a decrease in government spending, or a decrease in consumer confidence. When aggregate demand decreases, businesses are less likely to invest in new projects and hire new employees. This leads to stagnation, or a decrease in economic growth. So, while your dollars are worth less and economic growth has stalled, the prices you have to pay for goods and services continue to go up. This can be exceedingly difficult to manage financially, as people and businesses feel that they are being continuously squeezed resulting in a decrease in standard of living.
The term stagflation was first coined by British politician Iain Macleod in 1965, in a speech about the economic challenges facing the UK at that time. Macleod referenced the “stagnant” economic growth and high unemployment rates of the time, as well as the recent increases in prices (inflation). While stagflation is often used to describe periods of economic turmoil, it’s important to note that it is not an economic theory. Rather, it is simply a way to describe economic conditions that are typified by stagnant growth and high inflation. Today, the term is still used to describe periods of economic stagnation, although it is not as common as it once was.
Over the past 50 years, every recession aside from the 2008 Financial Crisis and Great Recession was accompanied by high inflation.
When the economy is experiencing stagflation, it means that there is stagnant economic growth paired with higher prices. This can have a number of implications for your personal finances and the economy as a whole. One of the most immediate effects of stagflation is that your purchasing power is weakened. As prices go up but wages remain stagnant, you’ll have less money available to you to buy goods and services. This leads to a reduction in consumption, which can further weaken the economy. In addition, higher prices can lead to higher levels of debt and defaults, as people are unable to keep up with their payments and obligations. This
often deepens a recessionary spiral, where the economy weakens even further. However, there are some practical solutions for dealing with stagflation. One option is to use fiscal policy to stimulate economic growth. This can involve cutting taxes or increasing government spending. Another option is to use monetary policy to help lower prices. This can involve reducing interest rates or increasing the money supply. Finally, countries can also pursue policies aimed at increasing productivity, such as investing in education and training or reforming labor markets. By pursuing one or more of these policies, it may be possible to somewhat offset the effects of stagflation and help boost the economy back to health.
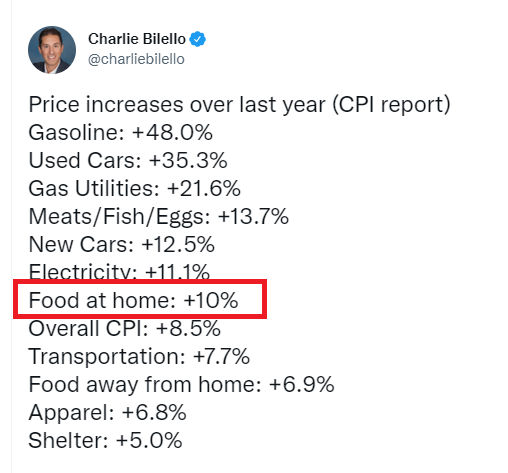
The simplest way to understand stagflation is by pondering the following tweet from financial commentator Charlie Bilello in a recent Consumer Price Index report.
Simply imagine a retiree on a fixed income, or a worker facing all of these increased expenses trying to cope.
What Assets Typically Do Well in Stagflation?
The most effective way to determine what assets do best in a stagflation is to be aware of the theory but ALWAYS keep your eyes on the scoreboard to see what is working and what is winning. Great traders focus on what “IS” happening. Bad traders are obsessed with what “SHOULD” occur.
In the 1970’s stagflation, investors ran to foreign bonds and foreign currencies in an attempt to escape the ravages of domestic inflation. That won’t work this time around as bond yields are about 5% less than inflation.
What I always advise traders and investors to do is to have a list of stocks that are WINNING. I define winning as outperforming the broader stock market indexes by a wide margin. We often cover these assets in our VantagePoint Stock of the Week.
Characteristics these stocks have are:
- Stocks that are either approaching or have recently made new 52-week highs.
- Stocks that are counter cyclical to the broader stock market indexes.
Usually, these stocks will be in sectors like Oil and Gas Exploration, Gold Mining, Agriculture and Food.
You need to be aware of the SCOREBOARD and see “WHAT IS WORKING.”
Let me explain with a few simple graphics and some links to some assets that we have recently covered in the Vantagepoint A.I. Stock of the week. This is not investment or trading advice. I am simply sharing a decision-making matrix which focuses on cross referencing what is winning with our patented artificial intelligence, machine learning and neural networks technology.
Stock of the Week June 8, 2022 – HF Sinclair ($DINO)
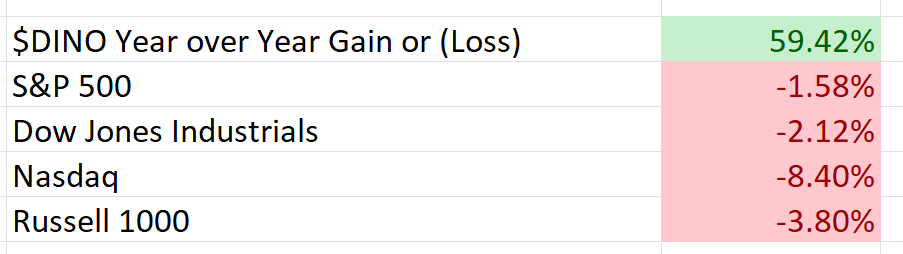
These were the performance results when we published our analysis.
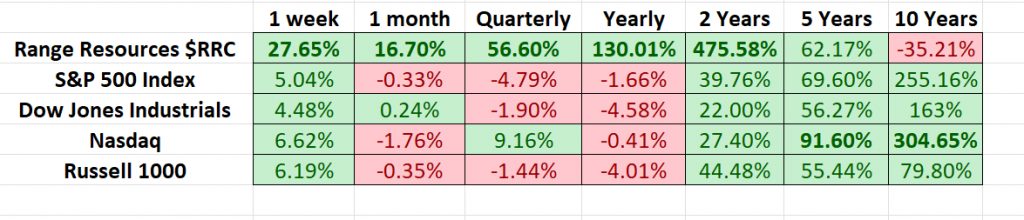
Stock of the Week June 1, 2022 – Range Resources ($RRC)
Stock of the Week May 25, 2022 – Callon Petroleum ($CPE)
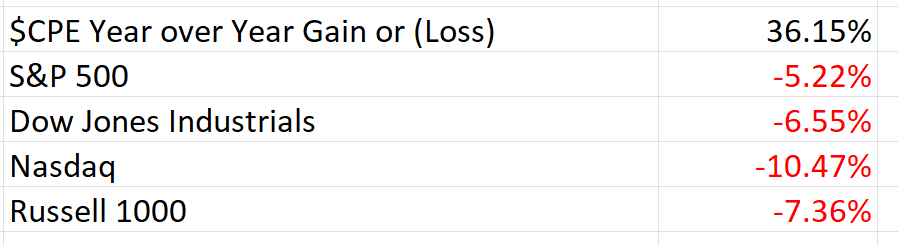
Please notice that in all three of these instances our focus was on stocks that were WINNING in comparison to the broader stock market indexes.
The strategies were defensive in nature emphasizing on assets that GO UP when the broader stock market indexes go DOWN.
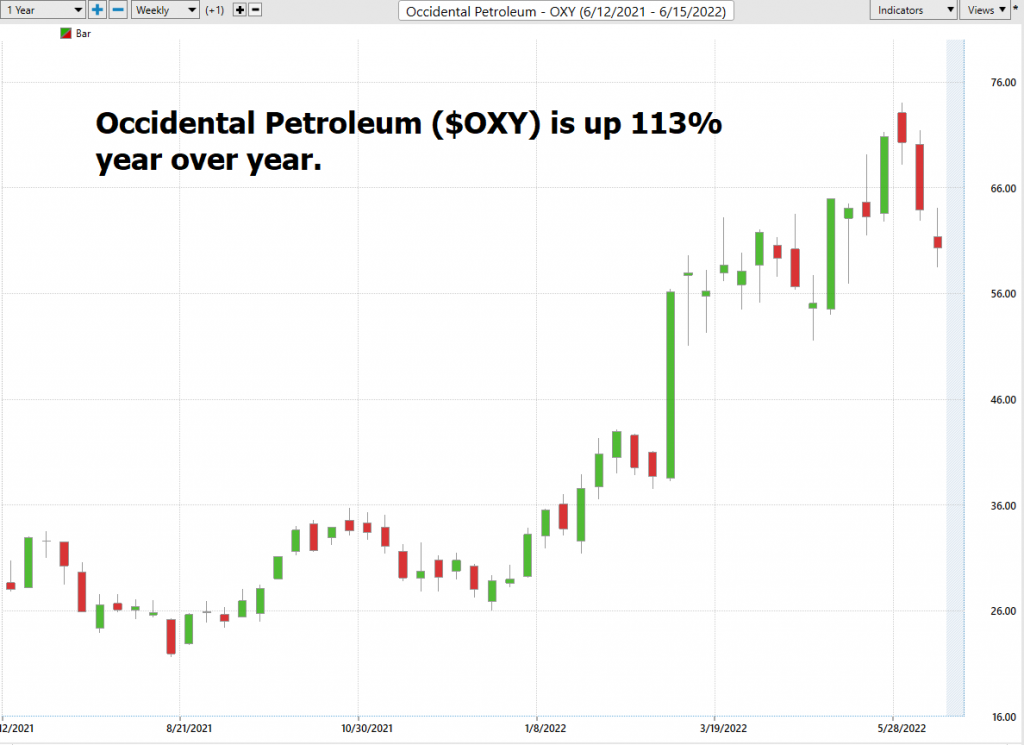
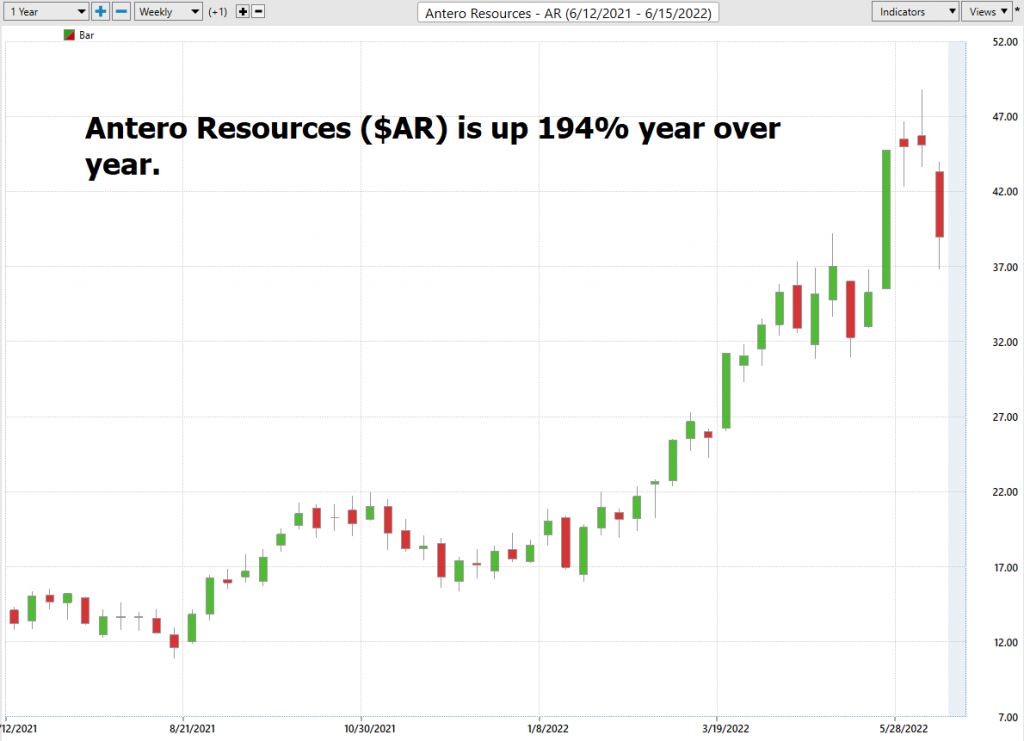
Also notice that all of these assets so far are in the oil and gas sector.
With the Vantagepoint A.I. software we could quickly locate these assets by looking for assets that were negatively correlated to the stock market indexes. This means that they move UP in price when the broader stock market moves down in price.
Next, here is a list of two stocks that are FIRMLY on my trading radar because they meet the criteria that I have emphasized in this article. They have consistently been making new 52-week highs and have been moving counter-cyclical to the broader stock market indexes.
The core of our trading philosophy is to find strong trends in which we can participate. The artificial intelligence, neural networks and machine learning provide Vantagepoint traders with very precise exact entry and exit signals always focusing on managing our risk.
The risks are huge in the current inflationary environment. Inflation is raging at 8.6% and the Fed just raised interest rates 75 basis points, which is the largest interest rate increase in 28 years.
The way I analyze the evidence, we are in a stagflationary economy.
If you don’t already use the Vantagepoint A.I. software, I invite you to visit with us at our complimentary “Learn To Trade With A.I.” master class. On this webinar we elaborate on the trends that the a.i. is focusing on and we forecast for specific assets.
I am watching very closely the mining and agricultural sectors looking at the leadership in those spaces for potential trades.
If you want to avoid having your portfolio, get squeezed during these difficult markets you need to become aware of “WHAT IS WINNING.”
When tough markets arrive the most empowering question a trader can ask is, who is winning? Or… what is working?
Are you capable of finding those markets with the best risk/reward ratios out of the thousands of trading opportunities that exist?
Knowledge.
Useful knowledge.
And its application is what A.I. delivers.
Isn’t that what we all want from the markets? Consistency.
So, imagine what might your portfolio would look like today had you applied artificial intelligence to it five years ago.
See for yourself how a machine-based learning software makes it easier to find statistically solid trends with less risk.
Most traditional indicators that traders use today were developed in the 1970’s and 1980’s. They are incapable of telling you what the market is going to do moving forward.
Once again, machine outperforms humanoid.
Since artificial intelligence has beaten humans at Chess, Poker, Blackjack, Go and Jeopardy, why do we think that trading would be any different?
It’s important that you find out more and discover why artificial intelligence keeps traders on the right side of the trend at the right time.
Join us for a FREE, Live Training.
We’ll show you at least three stocks that have been identified by the A.I. that are poised for big movement… and remember, movement of any kind is an opportunity!
Discover why artificial intelligence is the solution professional traders go-to for less risk, more rewards, and guaranteed peace of mind.
Intrigued? Visit with us and check out the A.I. at our Next Live Training.
It’s not magic. It’s machine learning.
Make it count.

IMPORTANT NOTICE!
THERE IS SUBSTANTIAL RISK OF LOSS ASSOCIATED WITH TRADING. ONLY RISK CAPITAL SHOULD BE USED TO TRADE. TRADING STOCKS, FUTURES, OPTIONS, FOREX, AND ETFs IS NOT SUITABLE FOR EVERYONE.
DISCLAIMER: STOCKS, FUTURES, OPTIONS, ETFs AND CURRENCY TRADING ALL HAVE LARGE POTENTIAL REWARDS, BUT THEY ALSO HAVE LARGE POTENTIAL RISK. YOU MUST BE AWARE OF THE RISKS AND BE WILLING TO ACCEPT THEM IN ORDER TO INVEST IN THESE MARKETS. DON’T TRADE WITH MONEY YOU CAN’T AFFORD TO LOSE. THIS ARTICLE AND WEBSITE IS NEITHER A SOLICITATION NOR AN OFFER TO BUY/SELL FUTURES, OPTIONS, STOCKS, OR CURRENCIES. NO REPRESENTATION IS BEING MADE THAT ANY ACCOUNT WILL OR IS LIKELY TO ACHIEVE PROFITS OR LOSSES SIMILAR TO THOSE DISCUSSED ON THIS ARTICLE OR WEBSITE. THE PAST PERFORMANCE OF ANY TRADING SYSTEM OR METHODOLOGY IS NOT NECESSARILY INDICATIVE OF FUTURE RESULTS. CFTC RULE 4.41 – HYPOTHETICAL OR SIMULATED PERFORMANCE RESULTS HAVE CERTAIN LIMITATIONS. UNLIKE AN ACTUAL PERFORMANCE RECORD, SIMULATED RESULTS DO NOT REPRESENT ACTUAL TRADING. ALSO, SINCE THE TRADES HAVE NOT BEEN EXECUTED, THE RESULTS MAY HAVE UNDER-OR-OVER COMPENSATED FOR THE IMPACT, IF ANY, OF CERTAIN MARKET FACTORS, SUCH AS LACK OF LIQUIDITY. SIMULATED TRADING PROGRAMS IN GENERAL ARE ALSO SUBJECT TO THE FACT THAT THEY ARE DESIGNED WITH THE BENEFIT OF HINDSIGHT. NO REPRESENTATION IS BEING MADE THAT ANY ACCOUNT WILL OR IS LIKELY TO ACHIEVE PROFIT OR LOSSES SIMILAR TO THOSE SHOWN.

