

PBF Energy Inc. is a petroleum refiner and supplier of unbranded transportation fuels, heating oils, lubricants, petrochemical feedstocks, and other petroleum products. Over the past 18 months oil refiners have seen tremendous volatility as crude oil prices went from negative values to over $70 per barrel. PBF is the countries 4th largest oil refiner.
Over the past year the company has been bleeding money to the tune of over $100 million per month and has been running at less than 80% of capacity over the last few years. With the recent dramatic rise in Crude Oil prices, it appears that PBF Energy’s fortunes have changed. On the negative side, PBF is faced with the reality that more electric cars are being sold worldwide further curtailing the demand for energy.
The company has $5.5 billion in debt which most analysts see that it is heavily leveraged. Hurricane IDA rocked the Louisiana coastline two months ago and further curtailed energy refiners. But as soon as the casualties from Ida were understood, $PBF made an important low in its price and has rallied over 94% in the last 60 days.
In this weekly stock study, we will look at and analyze the following indicators and metrics which are our guidelines which dictate our behavior in deciding whether to buy, sell, or stand aside on a particular stock.
- Wall Street Analysts’ Estimates
- 52-week high and low boundaries
- Best Case – Worst Case Scenarios of the past year.
- Vantagepoint A.I. Forecast (Predictive Blue Line)
- Neural Network Forecast
- Daily Range Forecast
- Intermarket Analysis
- Our trading suggestion
We featured PBF Energy in our Hot Stocks Outlook twice over the past few weeks.
The October 8th PBF Energy ($PBF) Hot Stocks Outlook is here.
The October 15th PBF Energy ($PBF) Hot Stocks Outlook is here.
We don’t base our trading decisions on things like earnings or fundamental cash flow valuations. However, we do look at them to better understand the financial landscape that a company is operating under.
Wall Street Analysts’ Estimates
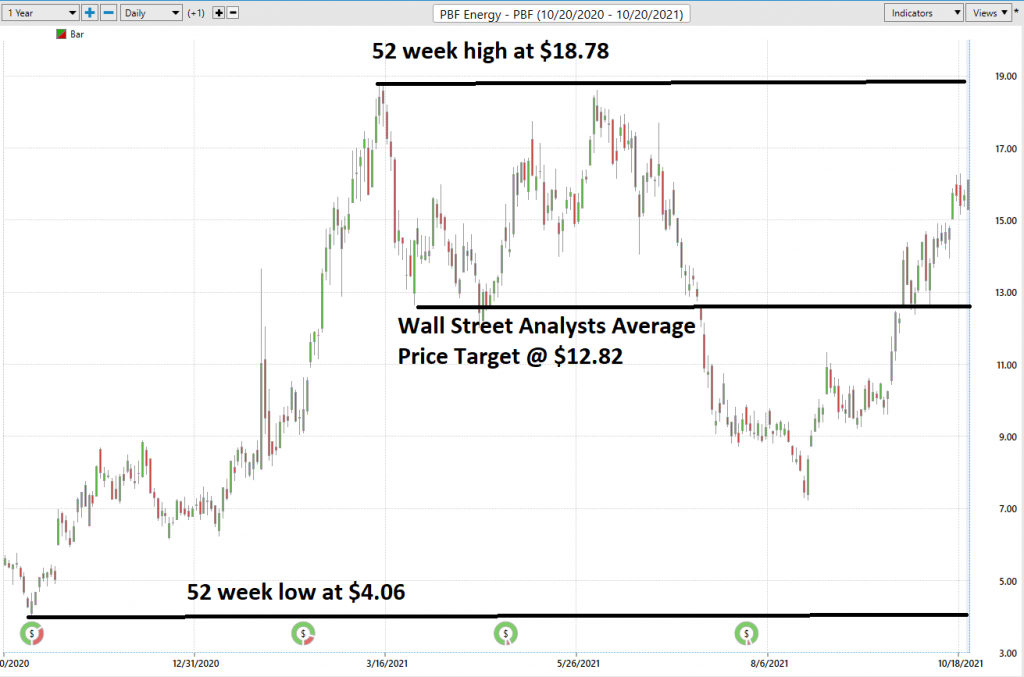
Based on 11 Wall Street analysts offering 12-month price targets for PBF Energy in the last 3 months. The average price target is $12.82 with a high forecast of $20.00 and a low forecast of $8.00. The average price target represents a -18.19% change from the last price of $15.67.
52-Week High and Low Boundaries
Looking at the Long-Term chart of PBF provides us with the 52-week high and low boundaries.
Over the past year we have seen PBF trade as low as $4.06 and as high as $18.78. This tells us that the average weekly trading range for $PBF is $.28.
We look to amplify this value greatly when trading with the artificial intelligence.
The first thing we like to do is place the 52 week high and low boundaries on the chart along with the Wall Street Analysts estimates to get an idea of the history of the stock and what the experts who follow it closely think.
Next let’s look at how PBF has performed over the past year and compare it to the broader stock market indexes.
Over the past year PBF is UP $178.83%
The S&P 500 Index is UP 31.27%
The Dow Jones Industrials are up 25.25%
The NASDAQ is UP 31.37%
The Russell 1000 (small cap) is UP 32%
These numbers clearly show that PBF has exponentially outperformed the broader market so far this year. However, if you zoom out to a 5 year time frame you will quickly realize that:
Over the last 5 years PBF is down 26.02%
The S&P 500 Index is up 111%
The Dow Jones Industrials are up 95.4%
The NASDAQ is UP 215.59%
The Russell 1000 (small cap) is UP 114.3%
So we have a conundrum here. Over the past year PBF has exponentially outperformed the stock indexes. But over the past 5 years it has been a huge laggard and money loser.
The momentum is clearly with the Bulls on PBF at present, but we also need to understand how poor of a performer it has been over the longer term.
Best Case – Worst Case Scenario
One of the most realistic and practical ways to determine risk is to look at the drawdowns an asset has had over the past year and see what can be learned from studying that experience.
When we apply this practical simplicity to PBF we see that the stock falls much quicker than it rises. Over the past year we have had 9 drawdowns of 15% or greater. Three of those drawdowns were over 30%.
What we can learn from this is that any time this asset falls 30% or more from a recent peak we should put it on our radar and wait for further guidance from the artificial intelligence.
Our North Star in trading is the artificial intelligence predictive blue line which we will discuss next.

Vantagepoint A.I. Forecast (Predictive Blue Line)
On the following chart you will see the power of the VantagePoint Predictive blue line which determines the medium-term trend price forecast.
The guidelines we abide by are as follows:
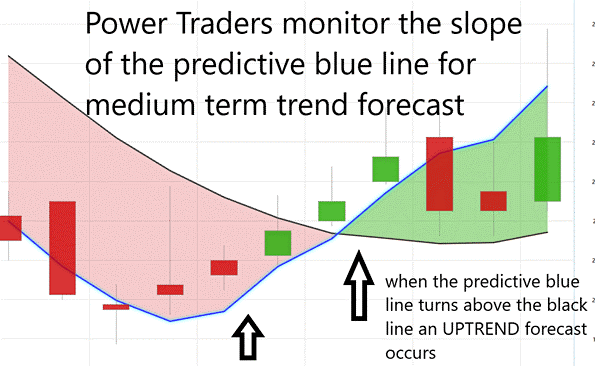
- The slope of the predictive blue line determines the trend and general direction of PBF
- Ideally, the VALUE ZONE is determined to try and buy the asset at or below the predictive blue line
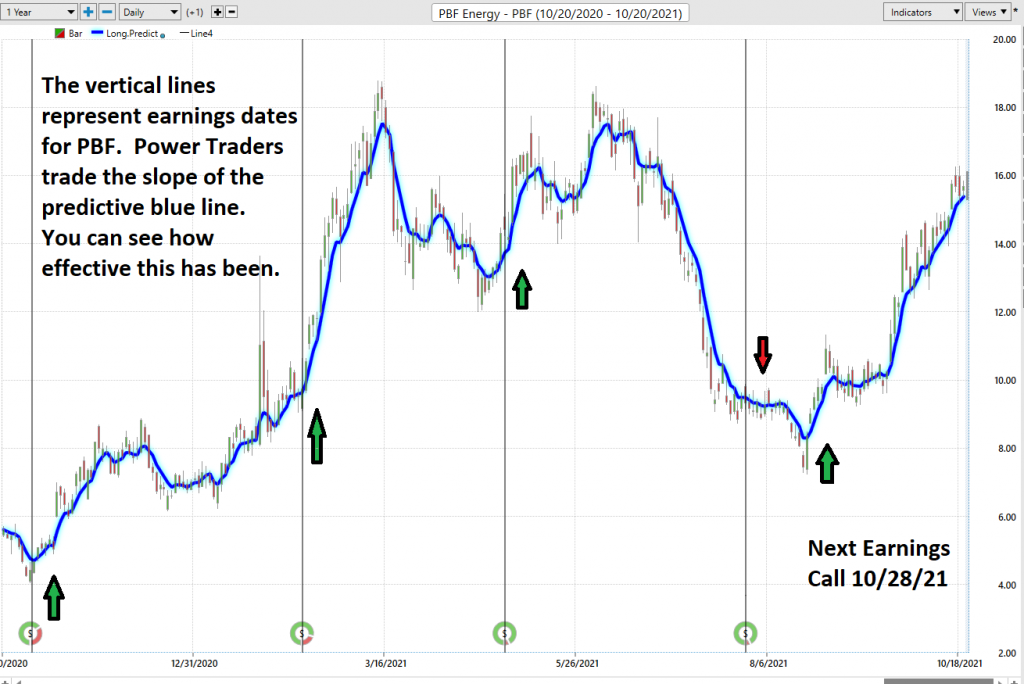
When you study this chart, one of the strategies that Power Traders have been utilizing to trade PBF is to wait for the predictive blue line to slope positive after an earnings announcement. Over the past year this has been a very effective way for medium term swing traders and longer-term investors to position themselves on the long side of this asset.
Naturally when the predictive blue line slopes lower traders would be anticipating lower prices and either moving to the sidelines or hedging their positions with options.
Using VantagePoint Software and the artificial intelligence, traders are alerted to trend forecasts by monitoring the slope of the predictive blue line.
The predictive blue line, however, utilizes the VantagePoint-patented Neural Network and Intermarket Analysis to arrive at its value. It looks at the strongest price drivers of an asset through artificial intelligence and statistical correlations to determine its value.
Where this information becomes extremely valuable is when we incorporate it into what the Wall Street Analysts are forecasting as fair value. On August 20, 2021, the predictive blue line turned up on PBF at $8.27 a share. Wall Street Analysts had their average estimate at $12.82.
Any time you can buy an asset 35% lower than the average Wall Street forecast and you have the artificial intelligence forecast in your favor, then this is a very high probability trade.
Neural Network Indicator (Machine Learning)
At the bottom of the chart is the Neural Network Indicator which predicts future short-term strength and/or weakness in the market.
The Neural Net forecast anticipates strength or weakness in the market over the next 48 hours. Traders cross reference the Neural Net with the predictive blue line for the appropriate high probability entry signal.
When the Neural Net Indicator is green it communicates strength. When the Neural Net is Red it is forecasting short term weakness in the market. When it is yellow it is anticipating sideways prices.
A Neural Net is a computational learning system that uses a network of functions to understand and translate massive amounts of data into a desired output, consistently monitoring itself and improving its performance.
We advocate that Power Traders cross reference the chart with the predictive blue line and neural network indicator to create optimal entry and exit points.
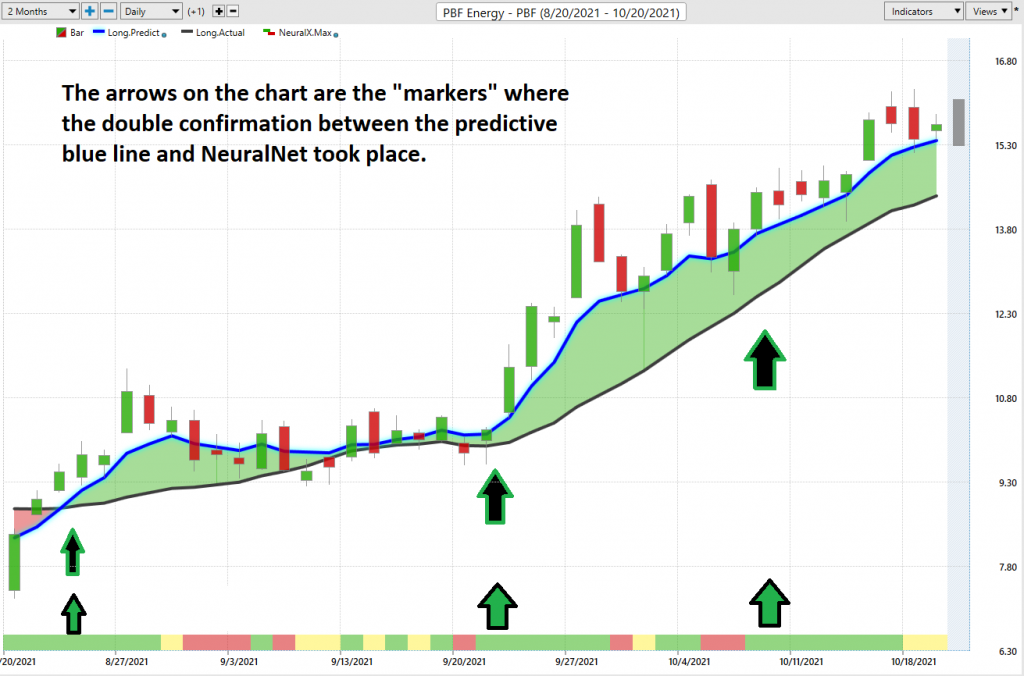
Traders look for confirmation on the NeuralNet to position themselves LONG or SHORT in the market. In other words, when the A.I. forecast is green, and The Neural Net is green, that presents a double confirmation buying opportunity.
The inverse is also true, when the A.I. forecast is red and the Neural Net is red, that is a selling opportunity. The arrows on the chart highlight the trading zones where Power Traders would’ve been using double confirmation to potentially buy in cross-referencing the A.I. forecast with the NeuralNet.
Power Traders are always looking to apply both the Neural Network and A.I. to the markets to find statistically sound trading opportunities.
So far in our analysis we have looked at the 52-week boundaries, the analysts’ forecasts, the drawdowns of PBF over the past year, its strength or weakness compared to the broader market and lastly the double confirmation signal that the Vantagepoint a.i. forecast provides.
Next, we are going to dig into the daily price action forecast the Vantagepoint software provides.
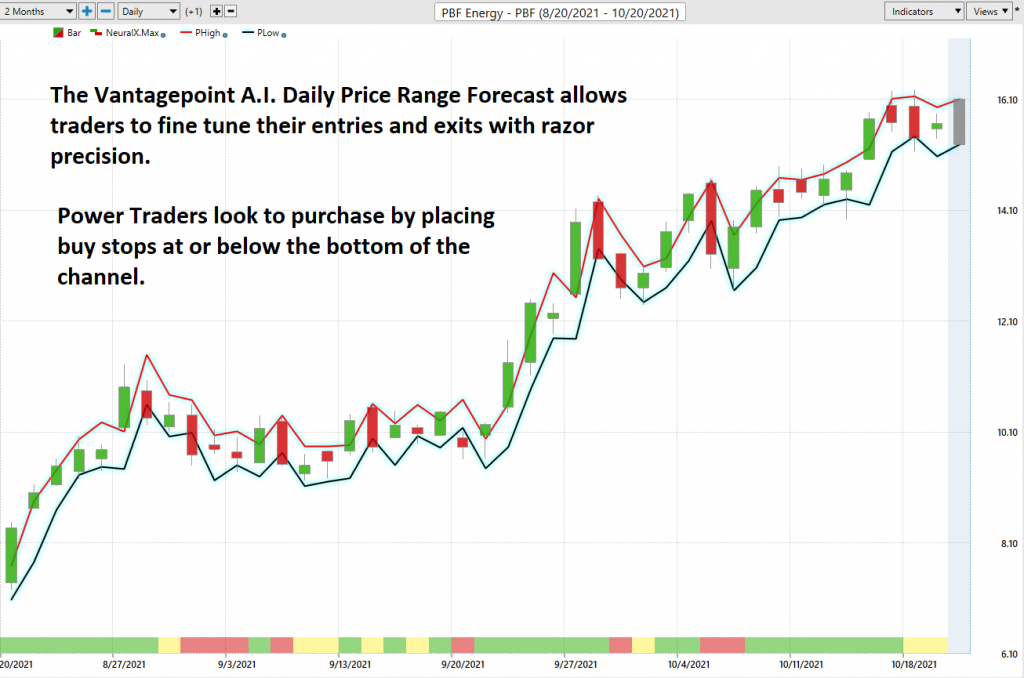
VantagePoint Software Daily Price Range Prediction
One of the powerful features in the VantagePoint Software which Power Traders use daily is the Price Range prediction forecast.
This forecast is what permits Power Traders to truly fine tune their entries and exits into the market.
Every day traders are faced with the anxiety and frustration of wondering where they should be looking to buy and sell the market. VantagePoint’s A.I. makes this decision super easy with the Daily Price Range Forecast.
For short term traders the important questions they have to confront every day are: Where should I buy? Where should I place my stop? Where should I sell? The Vantagepoint Daily Price Range forecast helps answer these questions with precision.
Here is the price chart of PBF during the most recent two-month run up featuring the Daily Price Range forecast with the Neural Net Indicator.
This chart helps traders decide where stop placement should occur. Observe how placing protective sell stops below the dark line on the chart was a powerful way to minimize risk on this trade.
See how the upper and lower bands of the price range forecast for a very clear channel of trading activity as well. Swing traders are always looking to buy towards the bottom of the predicted channel and try to sell above the top band.
Intermarket Analysis
Power lies in the way we respond to the truth we understand.
One of the supremely important questions in trading is what is driving the price? Headlines often create interesting narratives. But these “stories” only capture the imagination. Traders want and need to understand the cause and effect of price movement.
The only way to get an answer to this important question is through intermarket analysis which looks at statistical price correlations of assets.
We live in a global marketplace.
Everything is interconnected.
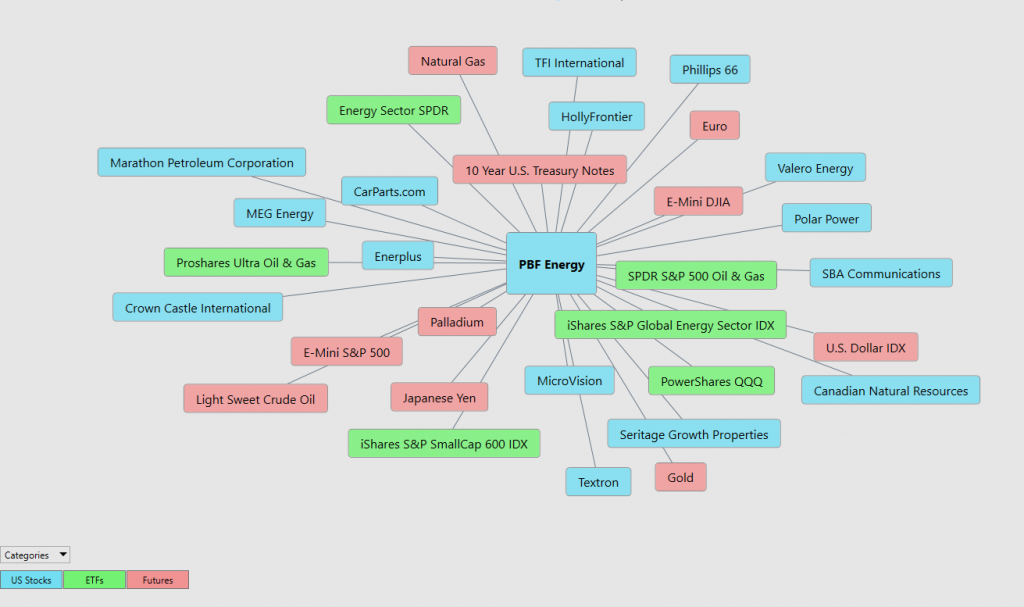
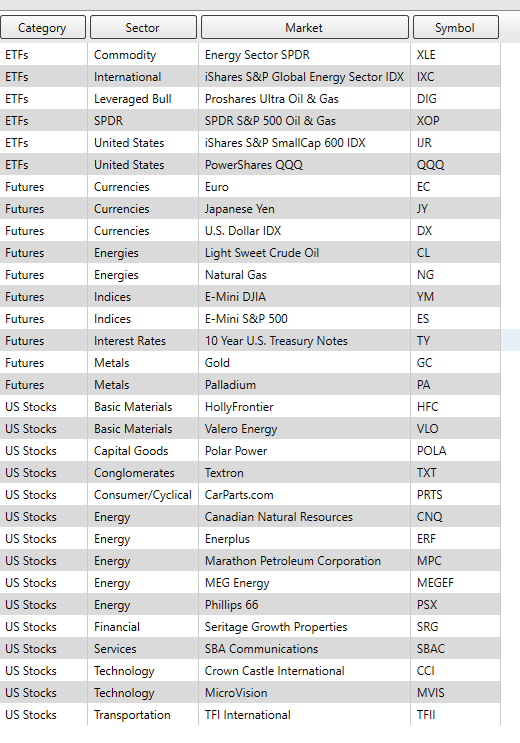
This information can also be displayed in a tabular format. These snapshots provide a huge confidence factor in knowing why you are on the right side of the right trend at the right time because you can see which markets are most positively and negatively correlated to the PBF price action.
In other words, these are the key driver to PBF price action.
Interest rates, Crude Oil Prices, and the volatility of the Dollar amongst thousands of other variables affect the decisions companies must make to flourish and prosper in these very challenging times. Trying to determine what these factors are is one of the huge problems facing investors and traders.
You always have a choice. You can tune in to the talking heads in the media who spin talking points which promote fear. Or you can rely on facts to base your decision making on.
Within these Intermarket Analysis graphics, you will see the 31 markets that are the key drivers to PBFs price.
There is great value to be had in studying and understanding the key drivers of PBF’s price action. This graphic provides a microcosmic view of what factors have been driving PBF higher.
A very elementary analysis allows a trader to see that Crude Oil, Natural Gas and Interest Rates are primary drivers in PBF’s recent ascendancy.
Trading Suggestion
Make no mistake about it, we like PBF a lot. Particularly considering the current energy shortages which are occurring around the world.
However, we think that PBF will encounter some strong headwinds at its recent 52 week high at $18.78. Once PBF makes new 52-week highs we think it will be an explosive ride higher. But in the interim we are expecting choppy price action and will continue to focus on the A.I. as our trading guide.
The next earnings call is October 28th, and we think it will provide fuel for the next major move. Our recommendation is to follow the predictive blue line. We like buying sharp breaks in this asset as long as they are aligned with the predictive blue line and Neural Net.
Wall Street Analysts will be forced to upgrade their estimates after the next earnings call should PBF come close to break even for the most recent quarter. By current Wall Street estimates PBF is overvalued. By 18%. This will lead to some nice volatility which we can exploit.
Our recommendation is to follow the A.I. trend analysis as outlined in this stock study and practice good money management on all trades.
We will re-evaluate based upon:
- New Wall Street Analysts’ Estimates
- New 52-week high and low boundaries
- Vantagepoint A.I. Forecast (Predictive Blue Line)
- Neural Network Forecast
- Daily Range Forecast
Let’s Be Careful Out There!
Remember, It’s Not Magic.
It’s Machine Learning.

IMPORTANT NOTICE!
THERE IS SUBSTANTIAL RISK OF LOSS ASSOCIATED WITH TRADING. ONLY RISK CAPITAL SHOULD BE USED TO TRADE. TRADING STOCKS, FUTURES, OPTIONS, FOREX, AND ETFs IS NOT SUITABLE FOR EVERYONE.
DISCLAIMER: STOCKS, FUTURES, OPTIONS, ETFs AND CURRENCY TRADING ALL HAVE LARGE POTENTIAL REWARDS, BUT THEY ALSO HAVE LARGE POTENTIAL RISK. YOU MUST BE AWARE OF THE RISKS AND BE WILLING TO ACCEPT THEM IN ORDER TO INVEST IN THESE MARKETS. DON’T TRADE WITH MONEY YOU CAN’T AFFORD TO LOSE. THIS ARTICLE AND WEBSITE IS NEITHER A SOLICITATION NOR AN OFFER TO BUY/SELL FUTURES, OPTIONS, STOCKS, OR CURRENCIES. NO REPRESENTATION IS BEING MADE THAT ANY ACCOUNT WILL OR IS LIKELY TO ACHIEVE PROFITS OR LOSSES SIMILAR TO THOSE DISCUSSED ON THIS ARTICLE OR WEBSITE. THE PAST PERFORMANCE OF ANY TRADING SYSTEM OR METHODOLOGY IS NOT NECESSARILY INDICATIVE OF FUTURE RESULTS. CFTC RULE 4.41 – HYPOTHETICAL OR SIMULATED PERFORMANCE RESULTS HAVE CERTAIN LIMITATIONS. UNLIKE AN ACTUAL PERFORMANCE RECORD, SIMULATED RESULTS DO NOT REPRESENT ACTUAL TRADING. ALSO, SINCE THE TRADES HAVE NOT BEEN EXECUTED, THE RESULTS MAY HAVE UNDER-OR-OVER COMPENSATED FOR THE IMPACT, IF ANY, OF CERTAIN MARKET FACTORS, SUCH AS LACK OF LIQUIDITY. SIMULATED TRADING PROGRAMS IN GENERAL ARE ALSO SUBJECT TO THE FACT THAT THEY ARE DESIGNED WITH THE BENEFIT OF HINDSIGHT. NO REPRESENTATION IS BEING MADE THAT ANY ACCOUNT WILL OR IS LIKELY TO ACHIEVE PROFIT OR LOSSES SIMILAR TO THOSE SHOWN.

