
Pfizer is an American multinational pharmaceutical and biotechnology corporation headquartered on 42nd Street in Manhattan, New York City.
Pfizer develops and produces medicines and vaccines for immunology, oncology, cardiology, endocrinology, and neurology. The company has several blockbuster drugs or products that each generate more than US$1 billion in annual revenues. In 2020, 50% of the company’s revenues came from the United States, 8% came from each of China and Japan, and 36% came from other countries.
Pfizer was a component of the Dow Jones Industrial Average stock market index from 2004 to August 2020. The company ranks 64th on the Fortune 500 and 49th on the Forbes Global 2000.
Over the last year with the pandemic and economic lockdown which ensued we have seen great interest in biotech and pharmaceutical stocks that can address the threats posed by the COVID-19 virus. Investors have given coronavirus vaccine stocks a lot of attention. Pfizer has benefited greatly from this attention.
When we focus on the coronavirus program and its contribution to income Pfizer appears to be sitting in an enviable monetary position.
Pfizer has signed agreements with the United States. for the delivery of 500 million doses by the first quarter of next year. The company has a supply agreement with the European Union until 2023 and that includes up to 1.8 billion doses. Pfizer also has agreements with other countries around the world. This year alone, Pfizer expects the vaccine to generate $ 33.5 billion in revenue.
Pfizer expects the vaccine to account for 42% of the company’s total sales this year. Looking ahead, Pfizer has the potential to generate similar or higher levels of revenue in the years to come.
Many health experts think that the coronavirus is here to stay. If so, we can anticipate that governments will order millions of more doses accordingly.
The United States Food and Drug Administration (FDA) has also just authorized a third dose of Pfizer’s vaccine as a booster for certain people 65 years of age and older or those belonging to high-risk groups.
Pfizer also has massive cash flow from its ownership of seven major drugs. This includes known names such as the anticoagulant Eliquis. On the flip side many of the companies’ patents expire in 2025. Pfizer’s valuation is attractive, the news surrounding the company is very supportive and they offer a very strong dividend.
Wall Street Analysts believe Pfizer has the potential will bring other blockbusters to market soon. The company has 100 new drugs in the pipeline — and 23 of those are in phase 3 trials. Recently Pfizer announced that it would acquire Trillium Therapeutics. The deal strengthens has been looked upon favorably by Wall Street as it strengthens Pfizer’s position in oncology.
Management at Pfizer has committed to 6% annual revenue growth. Analysts believe that will translate to double-digit growth to Pfizer’s bottom line. Analysts also believe if management delivers 6% revenue growth that the fair value of the stock is above $70 even without the vaccine. It currently trades for about $43 per share. We don’t base our trading decisions on things like earnings or fundamental cash flow valuations. However, we do look at them to better understand the financial landscape that a company is operating under.
In this weekly stock study, we will look at and analyze the following indicators and metrics as are our guidelines which dictate our behavior in deciding whether to buy, sell, or stand aside on a particular stock.
- Wall Street Analysts’ Estimates
- 52-week high and low boundaries
- Best Case – Worst Case Analysis and Takeaways
- Vantagepoint A.I. Forecast (Predictive Blue Line)
- Neural Network Forecast
- Daily Range Forecast
- Intermarket Analysis
- Our trading suggestion
We don’t base our trading decisions on things like earnings or fundamental cash flow valuations. However, we do look at them to better understand the financial landscape that a company is operating under.
Analysts Ratings
The 18 analysts offering 12-month price forecasts for Pfizer Inc have a median target of $44.00, with a high estimate of $61.00 and a low estimate of $39.00. The median estimate represents a +2.21% increase from the last price of $43.05.
52-week Boundaries
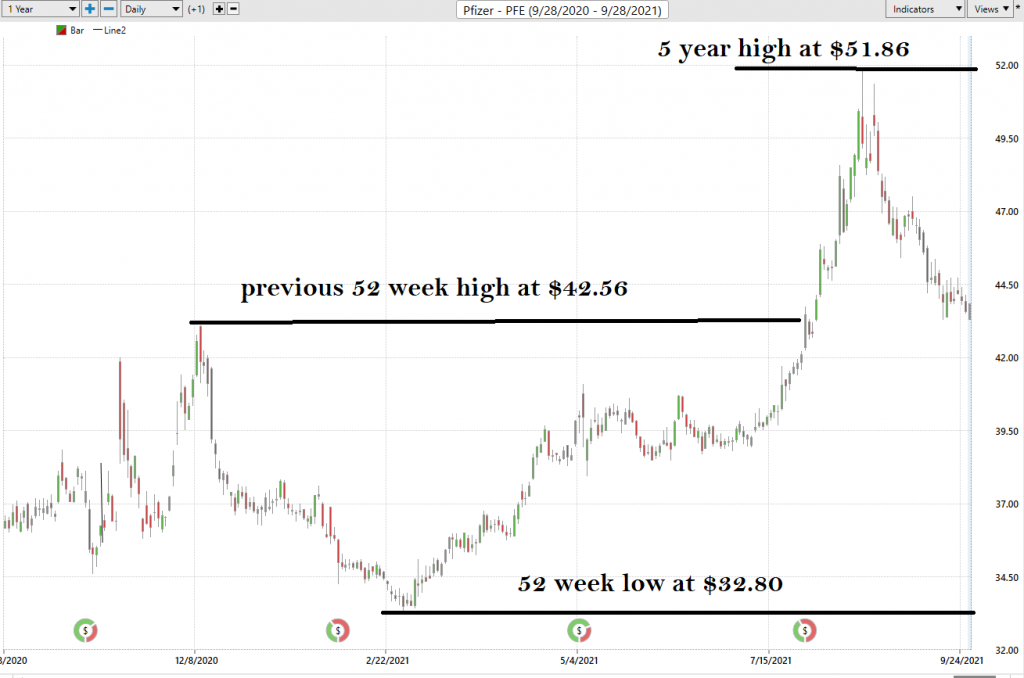
Looking at the Long-Term chart of PFE provides us with the 52-week high and low boundaries.
Over the past year we have seen PFE trade as low as $32.83 and as high as $51.86. The annual trading range has been $19.03. This tells us that the average weekly trading range for PFE is $.36.
Currently the stock is trading at its 53rd percentile related to its annual range and looks like it is going to test its previous 52 week high of $42.56 as it looks to find support. As we publish this stock study the trend is clearly down.
Though Pfizer is currently leading the battle against COVID-19, the company is by no means overvalued. In the past five years, its price-to-earnings ratio has gone as low as 11 and as high as 32, averaging 20 for the entire period.
Best Case – Worst Case Scenario
When we study the long term 52-week chart we can look at the best case and worst-case scenarios just to get an eyeball perspective of the risk and volatility of this asset. This is worth doing anytime you invest or trade to monetarily understand what the potential risks and rewards have been over the past year.
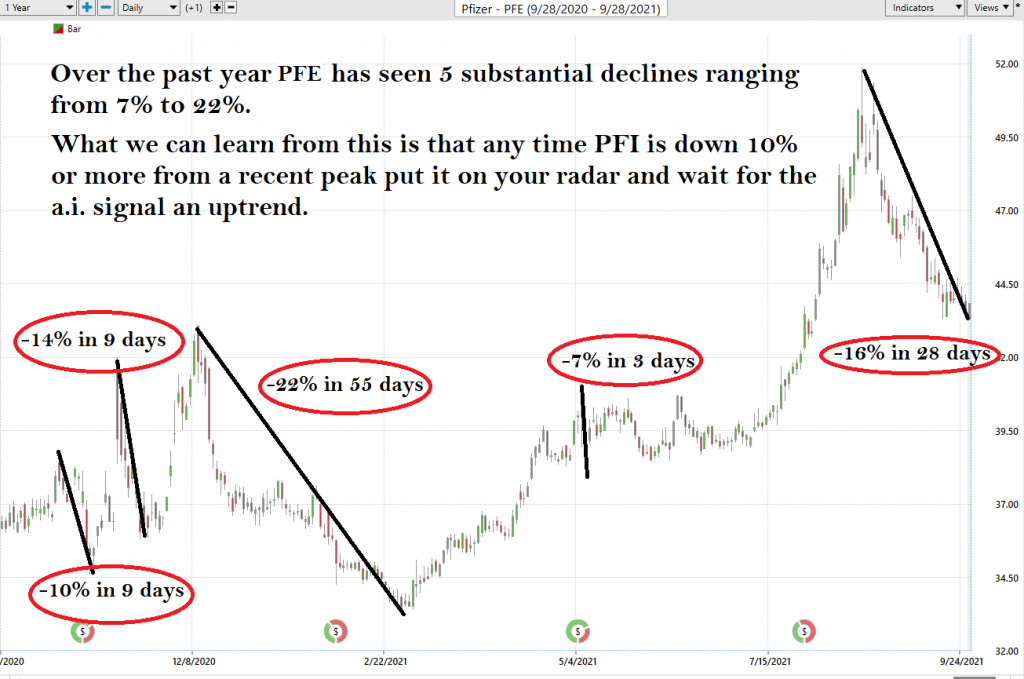
It is worth doing this type of baseline analysis because it allows you to visually ascertain how quickly a stock drops in comparison to the speed with which it moves higher.
Next, we want to compare the performance of PFE to the major broad market indexes.
Over the past year PFE is up 24.51%.
NASDAQ is UP 31.3%
Russell 1000 (small cap) is UP 31.11%
S&P 500 is UP 29.97%
Dow Jones Industrials is UP 24.56
So, in PFE we have an asset which is performing similarly to the DOW Jones Industrials but lagging the other broader market indexes. In the past year the worst-case downside was -22% and the best-case upside was +34%. In between those boundaries is where all the price action occurred.
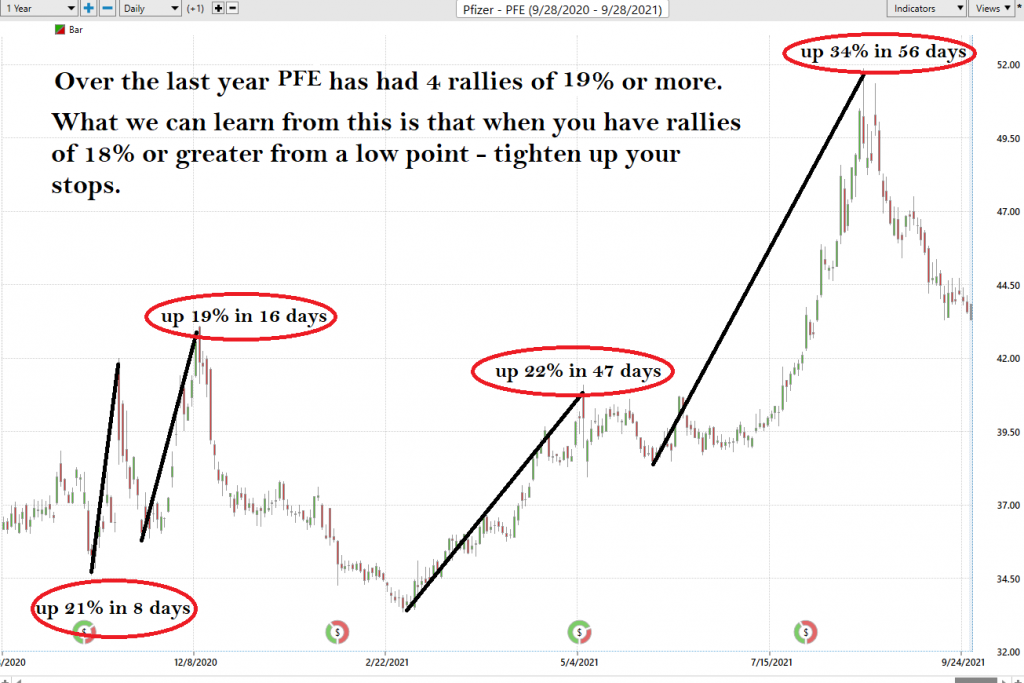
This simple analysis tells us that any time PFE loses 10% of its value we should place it on our trading radar as a candidate to watch closely. When the a.i. forecasts confirm an UPTREND in place price has tended to accelerate very quickly. The stock rises much faster than it falls. On the inverse, we can alsosee that when PFE rallies 18% from its lows it encounters a lot of volatility and traders who are onboard should use that as a means of tightening their stops.
We advise Power Traders to always place close attention the 52-week high and low boundaries as these markers often provide great trading opportunities and create a great deal of volatility in an asset.
PFE was currently trading at a NEW 5 year high before the recent selloff. By analysts estimates it is still valued.
Earnings dates have also been a key driver in PFE price action. The next PFE earnings call is slated for November 2, 2021.
The Vantagepoint A.I. Analysis
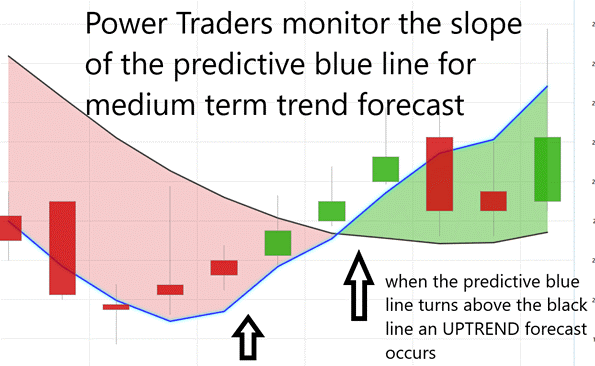
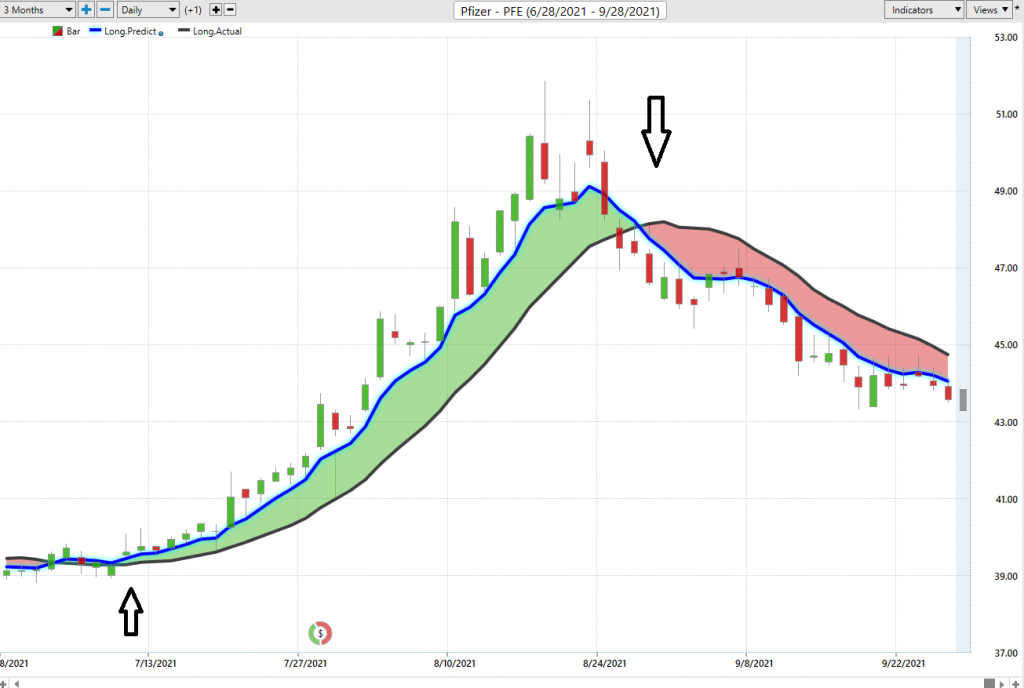
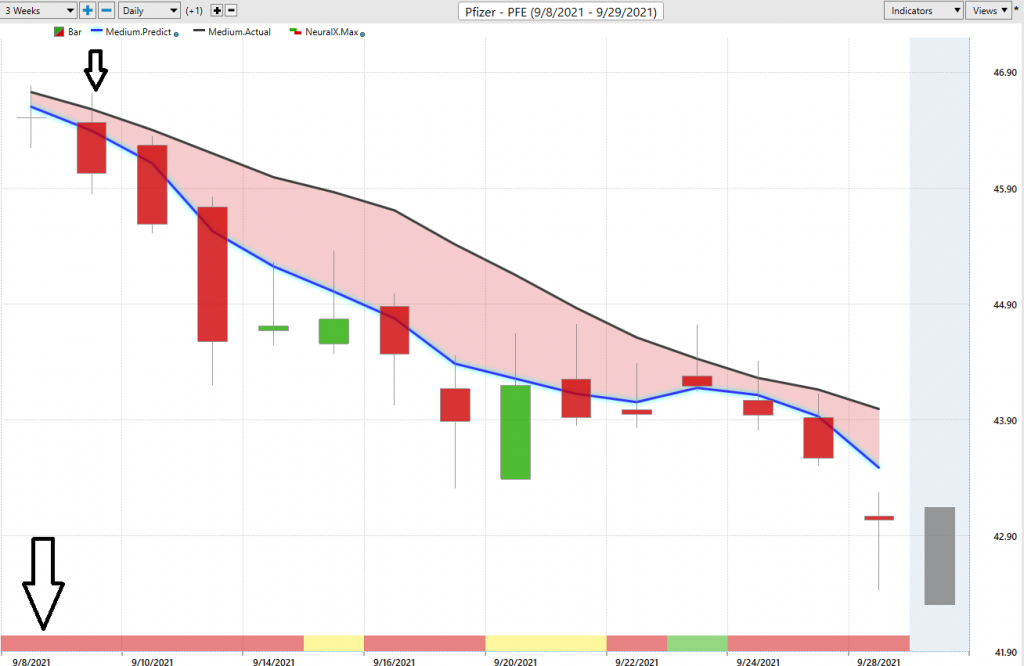
On the following chart you will see the power of the VantagePoint Predictive blue line which determines the medium-term trend price forecast.
The guidelines we abide by are as follows:
- The slope of the predictive blue line determines the trend forecast and general direction of PFE
- Ideally, the VALUE ZONE is determined to try and find buy opportunities at or below the predictive blue line, or to sell opportunities above the predictive blue line during a downtrend.
Naturally when the predictive blue line slopes lower traders would be anticipating lower prices and either moving to the sidelines or hedging their positions.
Using VantagePoint Software and the artificial intelligence, traders are alerted to trend forecasts by monitoring the slope of the predictive blue line.
The predictive blue line, however, utilizes the VantagePoint-patented Neural Network and Intermarket Analysis to arrive at its value. It looks at the strongest price drivers of an asset through artificial intelligence and statistical correlations to determine its value.
What is fascinating about the chart is that by simply eyeballing the chart we can see that the slope of the predictive blue line is like the NORTH STAR in providing directional guidance to traders. In other words, don’t fight the trend. The trading opportunities might last a few days or several weeks, but the focus is always to keep the trader on the right side of the right trend at the right time. The blue line ALWAYS determines the forecast and the best move forward.
Normally an UPTREND forecast occurs when you have two consecutive closes above the predictive blue line. On the downside the inverse is also true. A downtrend forecast normally occurs when you have two consecutive closes below the predictive blue line.
The Up Move saw maximum gains of 30.7% in 29 days.
The DOWN move which is still currently in play has PFE down 8.15% in the last 22 trading sessions. This down move has occurred despite the numerous news stories supporting Pfizer’s battle with COVID-19.
Fine Tuning Entries with The Neural Net Indicator
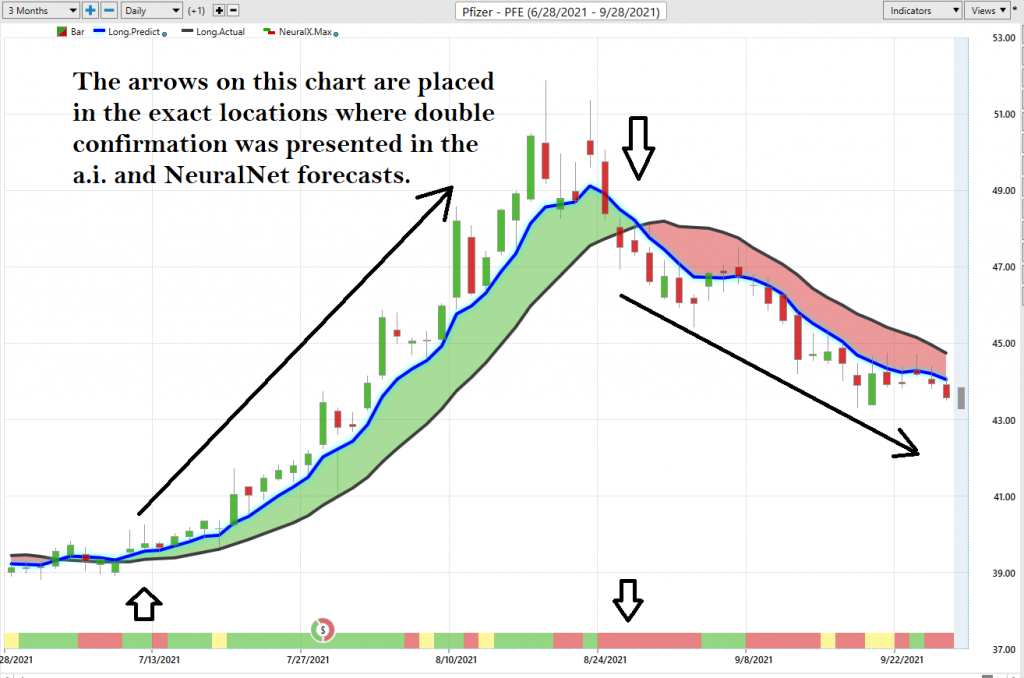
At the bottom of the chart is the Neural Network Indicator which predicts future short-term strength and/or weakness in the market. When the Neural Net Indicator is green it communicates strength. When the Neural Net is Red it is forecasting short term weakness in the market. When it is yellow it is anticipating sideways prices.
A Neural Net is a computational learning system that uses a network of functions to understand and translate massive amounts of data into a desired output, consistently monitoring itself and improving its performance.
Neural Networks are essentially trainable algorithms that emulate aspects of the human brain. This means they can be trained based upon criteria for assessing risk and potential reward to determine the best move forward. This allows them to make high probability forecasts based on available historical information.
We advocate that Power Traders cross reference the chart with the predictive blue line and neural network indicator to create optimal entry and exit points.
For the serious trader, neural networks are a next-generation trading tool that can detect subtle non-linear interdependencies and patterns that traditional methods of technical analysis are unable to uncover.
Traders look for confirmation on the NeuralNet to position themselves LONG or SHORT in the market. In other words, when the A.I. forecast is green, and The Neural Net is green, that presents a buying opportunity.
The inverse is also true, when the A.I. forecast is red and the Neural Net is red, that is a selling opportunity. The arrows on the chart below highlight the trading zones where Power Traders would’ve been using double confirmation to BUY in cross referencing the A.I. forecast with the NeuralNet.
Power Traders are always looking to apply both the Neural Network and A.I. to the markets to find statistically sound trading opportunities.
VantagePoint Software Daily Price Range Prediction
We will zoom in in on the last 3 months of price action so that you can see for yourself how the a.i. and machine learning combine to create a very accurate daily price range forecast that keep traders focused on optimal trade placement.
One of the powerful features in the VantagePoint Software which Power Traders use daily is the Price Range prediction forecast.
This forecast is what permits Power Traders to truly fine tune their entries and exits into the market.
Every day traders are faced with the anxiety and frustration of wondering where they should be looking to buy and sell the market. VantagePoint’s A.I. makes this decision super easy with the Daily Price Range Forecast.
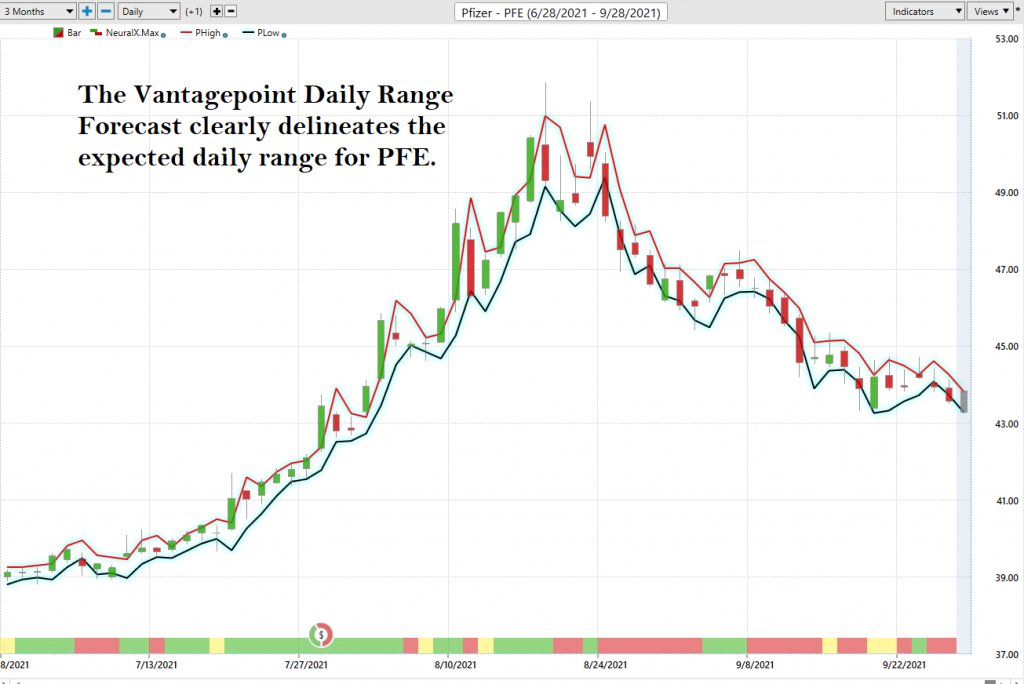
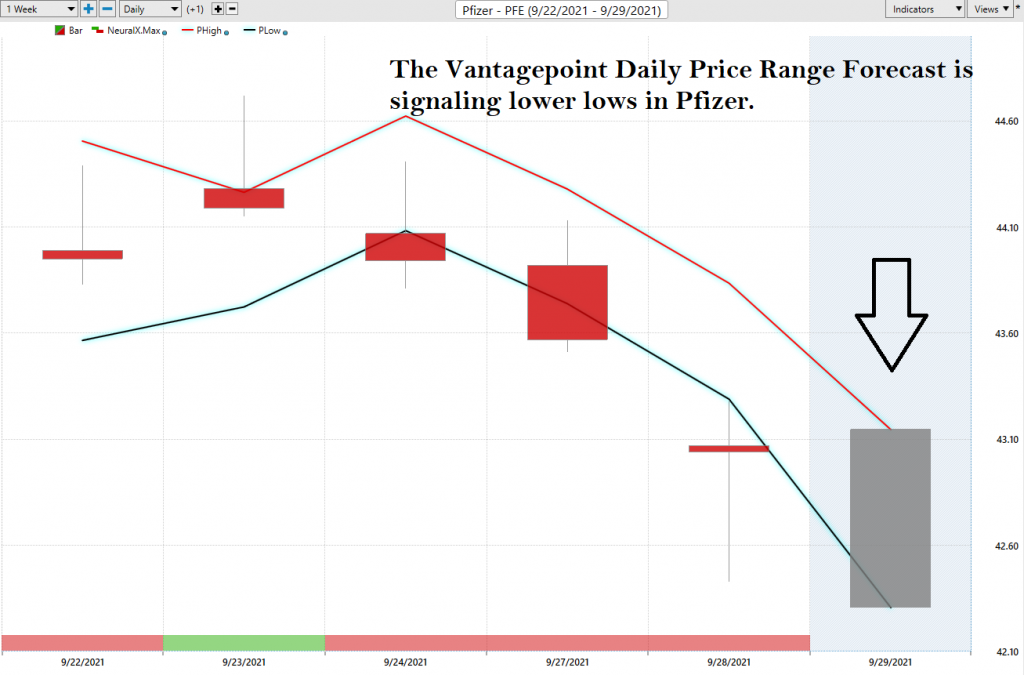
This chart helps traders decide where stop placement should occur. Observe how placing protective sell stops below the dark line on the chart was a powerful way to minimize risk on this trade.
See how the upper and lower bands of the price range forecast for a very clear channel of trading activity as well. Swing traders are always looking for buying opportunities towards the bottom of the predicted channel and try to find selling opportunities above the top band.
Intermarket Analysis
Power lies in the way we respond to the truth we understand.
One of the supremely important questions in trading is what is driving the price? Headlines often create interesting narratives. But these “stories” only capture the imagination. Traders want and need to understand the cause and effect of price movement.
The only way to get an answer to this important question is through intermarket analysis which looks at statistical price correlations of assets.
We live in a global marketplace.
Everything is interconnected.
Interest rates, Crude Oil Prices, and the volatility of the Dollar amongst thousands of other variables affect the decisions companies must make to flourish and prosper in these very challenging times. Trying to determine what these factors are is one of the huge problems facing investors and traders.
You always have a choice. You can tune in to the talking heads in the media who spin talking points which promote fear. Or you can rely on facts to base your decision making on.
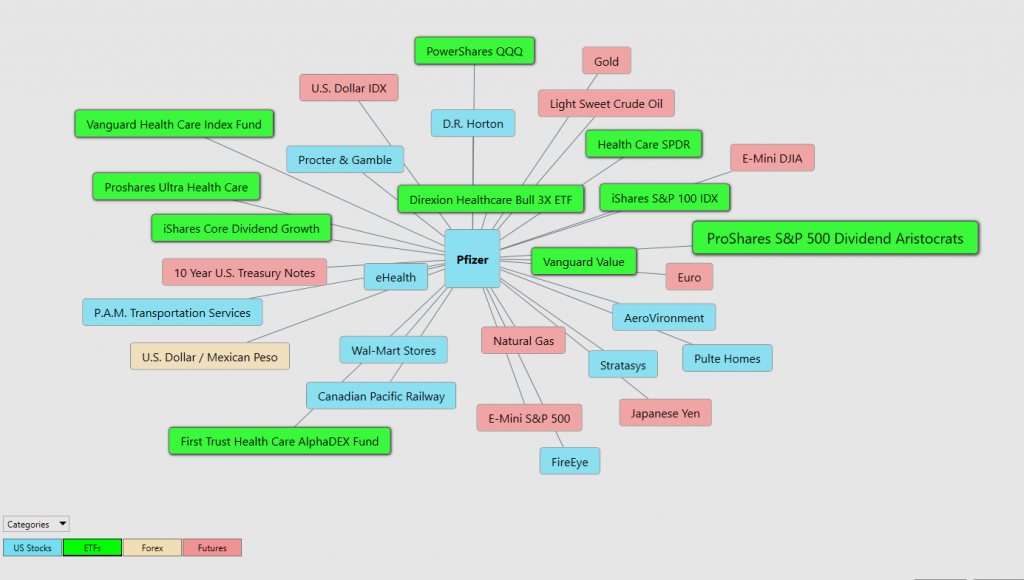
Within the following Intermarket Analysis graphic, you will see the 31 markets that are the key drivers to PFE’s price.
There is great value to be had in studying and understanding the key drivers of PFE’s price action. This graphic provides a microcosmic view of what factors have been driving PFE’s higher. You will find a handful of biotech and pharmaceutical ETF’s whose price action is very statistically correlated to PFE.
Our Suggestion
Charts are the footprints of money flows.
In an up market the footprint left on the chart is that the market is making higher high prices and higher lows.
In a down market the footprint on the chart is a series of lower highs and lower lows.
Currently Pfizer is in a downtrend. It continues to make new lows and is down over 8% from its 5-year high.
We think the stock has great long-term potential but are currently unwilling to commit to the long side of the market while the a.i. forecast and the NeuralNet are signaling that the downtrend is not over yet.
One very simple indicator that we advocate using is simply looking at the trading range for the last ten days. This means that we denote the highest high price of the last ten days and the lowest low price for the last ten days. The very valuable rule of thumb is that downtrends make lower lows and uptrends make higher highs.
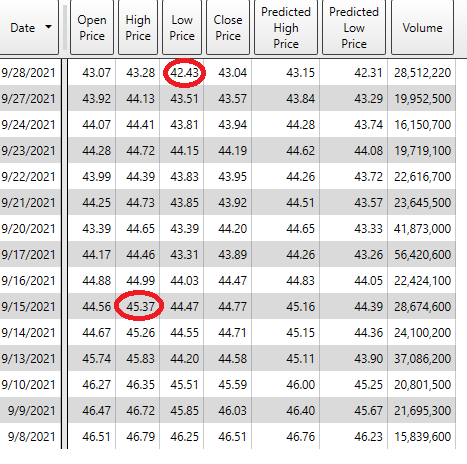
We can look at the price data for Pfizer in a tabular format which will outline this principle. Over the last ten days the highest price was $45.37. The lowest price was $42.43. If lower lows are being made in this downtrend it is fair to conclude that it will persist. When PFE makes a new ten-day high is normally a good idea to pay attention as the trend is starting to reverse.
We do not advocate trying to counter-trend trade or to buy something cheaply. That is a surefire way to destroy your portfolio. The trend is down. We think there is great value in this asset longer term, but it is still early. Patience is key at this moment.
Using the Vantagepoint Software I can zoom in on this time frame and view the artificial intelligence and NeuralNet forecast which confirms the downtrend analysis.
We like the PFE narrative and think the upside can be explosive. We like the reality that the stock is fairly valued, and the most optimistic Wall Street Analysts still think the stock has potential to run into the $70’s should management be able to grow revenue.
However, despite the fundamental factors which we like, we trade the trend. Currently the trend is DOWN. This means we place this asset on our trading radar and watch and wait for the a.i. forecast to signal that the trend has changed.
Our Daily Price Range Forecast is also signaling that the recent lows at $42.43 will be broken. Our advice in these situations is to eliminate the word “cheaper” from your vocabulary and focus on the words “value” and strength.” We would much rather look for buying opportunities at a higher price when the uptrend has asserted itself than guess to where the bottom might be in Pfizer.
Whenever we encounter this type of potentially bullish scenario, we review our process for market selection.
Our recommendation is to follow the A.I. trend analysis as outlined in this stock study and practice good money management on all trades.
We will re-evaluate daily based upon:
- New Wall Street Analysts’ Estimates
- New 52-week high and low boundaries
- Vantagepoint A.I. Forecast (Predictive Blue Line)
- Neural Network Forecast
- Daily Range Forecast
The trend in PFE is down. We want to get long but will not disrespect the current trend.
Let’s Be Careful Out There!
Remember, It’s Not Magic.
It’s Machine Learning.

IMPORTANT NOTICE!
THERE IS SUBSTANTIAL RISK OF LOSS ASSOCIATED WITH TRADING. ONLY RISK CAPITAL SHOULD BE USED TO TRADE. TRADING STOCKS, FUTURES, OPTIONS, FOREX, AND ETFs IS NOT SUITABLE FOR EVERYONE.
DISCLAIMER: STOCKS, FUTURES, OPTIONS, ETFs AND CURRENCY TRADING ALL HAVE LARGE POTENTIAL REWARDS, BUT THEY ALSO HAVE LARGE POTENTIAL RISK. YOU MUST BE AWARE OF THE RISKS AND BE WILLING TO ACCEPT THEM IN ORDER TO INVEST IN THESE MARKETS. DON’T TRADE WITH MONEY YOU CAN’T AFFORD TO LOSE. THIS ARTICLE AND WEBSITE IS NEITHER A SOLICITATION NOR AN OFFER TO BUY/SELL FUTURES, OPTIONS, STOCKS, OR CURRENCIES. NO REPRESENTATION IS BEING MADE THAT ANY ACCOUNT WILL OR IS LIKELY TO ACHIEVE PROFITS OR LOSSES SIMILAR TO THOSE DISCUSSED ON THIS ARTICLE OR WEBSITE. THE PAST PERFORMANCE OF ANY TRADING SYSTEM OR METHODOLOGY IS NOT NECESSARILY INDICATIVE OF FUTURE RESULTS. CFTC RULE 4.41 – HYPOTHETICAL OR SIMULATED PERFORMANCE RESULTS HAVE CERTAIN LIMITATIONS. UNLIKE AN ACTUAL PERFORMANCE RECORD, SIMULATED RESULTS DO NOT REPRESENT ACTUAL TRADING. ALSO, SINCE THE TRADES HAVE NOT BEEN EXECUTED, THE RESULTS MAY HAVE UNDER-OR-OVER COMPENSATED FOR THE IMPACT, IF ANY, OF CERTAIN MARKET FACTORS, SUCH AS LACK OF LIQUIDITY. SIMULATED TRADING PROGRAMS IN GENERAL ARE ALSO SUBJECT TO THE FACT THAT THEY ARE DESIGNED WITH THE BENEFIT OF HINDSIGHT. NO REPRESENTATION IS BEING MADE THAT ANY ACCOUNT WILL OR IS LIKELY TO ACHIEVE PROFIT OR LOSSES SIMILAR TO THOSE SHOWN.

