
One of the ongoing themes of these blog articles is the idea that trading is an ongoing learning experience. Learning does not have to be difficult, time consuming or costly. It literally boils down to concisely and effectively answering the question: “What did you learn from that experience?”
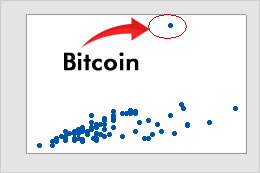
Many years ago, I was talking with a world class trader who shared something extremely profound with me. We were discussing markets and trading opportunities when he said, “If you want outlier results, trade the outliers!”
It was a brilliantly concise statement of defining opportunity.
An outlier is a value, or data point that differs substantially from the rest of the data series. Mathematically speaking, an outlier is a value that is at least two standard deviations from the average. A standard deviation is the quantitative measure of how dispersed out the numbers are in a comparative series.
When you ponder outliers there are two distinct possibilities which you must evaluate.
- The outlier represents an anomaly which is expected to revert to the average of the data series.
- Or… the outlier represents an abnormality which forces you to redefine what “normal” is. In other words, when you discover an outlier, it is often something unusual occurring which is how we discover opportunity.
2021 Returns for Q1 thru Q3
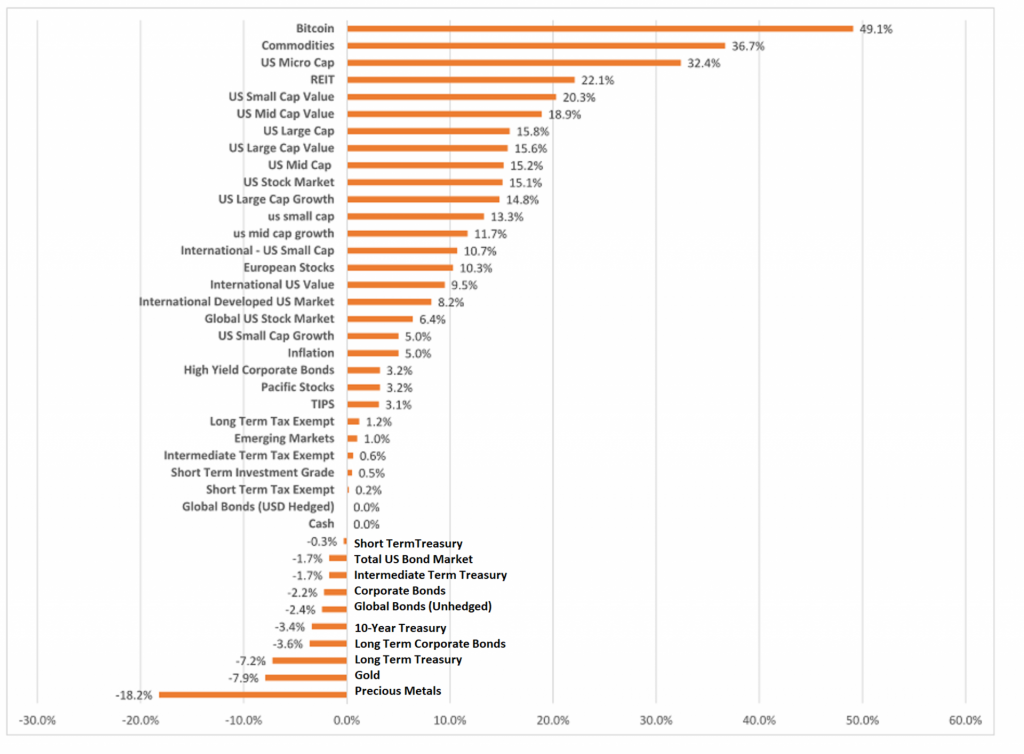
October 1, 2021 marked the beginning of the 4th Quarter, so we have a report card of how all of the different asset classes have performed for the first three quarters of 2021. I encourage you to study these returns as they tell a very profound macroeconomic story.
The top three performers for 2021 so far were Bitcoin at +49.1%, Commodities at +36.7% and U.S. Micro Caps at +32.4%.
The worst performers were anything U.S. Treasury Debt related and Precious Metals.
If you have had exceptional results so far this year, my guess is that you would have had to be trading the strongest and weakest asset classes because that is where the “price action” and greatest volatility is.
Comparatively speaking here is how the FAANG stocks traded:
Facebook is up 26%
Apple is up 14%
Amazon is up 4%
Netflix is up 22%
Google is up 61.7%
Microsoft is up 35.8%
Almost all interest rate related vehicles were negative yielding before we take inflation into account. Economists are forecasting that inflation will be anywhere from 3% to 5% for 2021, so we must additionally subtract these estimates from these returns to get an idea of how much purchasing power was gained or lost.
The U.S. Treasury market has a market capitalization of $47 trillion and this sector is getting decimated.
I have written extensively over the last two years about U.S Debt and inflation. You can see how the results bear out how impossible it currently is to save money through traditional means. People have no choice but to speculate if they want to maintain their purchasing power, which has led many economists to refer to the U.S as a casino economy.
The purpose of this article is not to make you a bitcoin bull. Rather it is to make you look at a data series for any period and to carefully study the “outliers.” These results for 2021 represent the strongest and weakest trends which we need to be aware of. Bitcoin just happens to lead the field again, and again which is worth making note of.
All portfolio managers are looking at these returns for the first 9 months of the years and pruning their holdings accordingly. Two questions are front and center:
- If this trend continues what will the 4th Quarter results look like?
- If this trend reverses who will be the beneficiaries?
One of the fascinating things that is occurring in bitcoin is that as it strives to become the reserve currency of the world you are hearing more and more about it. I have noticed is that since bitcoin became the reserve currency in El Salvador on September 7th, that more and more heads of state are being asked about it. This may seem trivial, but when is the last time you heard of a head of state of central bank being asked what they thought of Apple, Microsoft, Facebook, or Google stock?
You can’t buy this type of publicity! Love it, or hate it, bitcoin has become the dominant alternative monetary network offering a digital store of value to its participants.
Good, bad, or indifferent bitcoin is dominating the news cycle as heads of state evaluate it and compare it to their currencies.
Currently bitcoin legislation for adoption is occurring in countries like Panama, Brazil, Mexico, Argentina, Ecuador, Paraguay, Honduras, and Ukraine. The on-chain analytics show that over 350,000 new users are adopting bitcoin every week.
Everyone is trying to bet and get on the fastest horse in the race. Analyzing the markets in this manner from quarter to quarter allows you to look at leadership and prune accordingly.
One of the largest stories in the last quarter was that CHINA banned bitcoin, while the tiny country of El Salvador adopted it. Interesting contrast to say the least.
Here is what previous bitcoin bans from China have looked like:
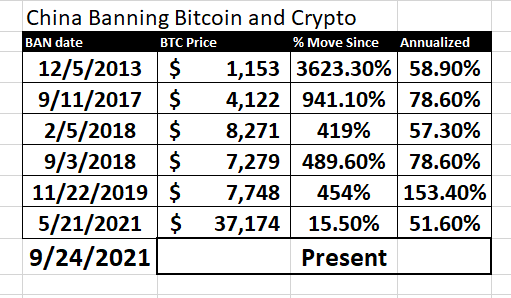
You can see that over the last eight years the Chinese government has banned bitcoin multiple times and it has only benefited the asset class.
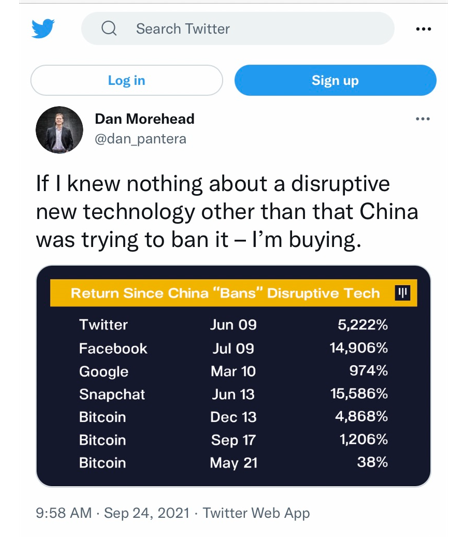
This led Dan Morehead from Pantera Capital to make the following observation on Twitter, showing the returns on other assets that China has banned and how they have performed since the ban went into place.
It might be important to ask, why has China had to ban bitcoin multiple times since 2013?
There might be some serious wisdom in that answer.
But bitcoin despite its antifragile qualities is not without risk. If we drill down on the asset, we can see that it has tremendous volatility. We can get a pretty good idea of this by looking at bitcoin performance quarter to quarter over the last ten years. I have taken the liberty of highlighting the best and worst performances per quarter to provide you with a quick representation of how volatile this asset can be.
Bitcoin Returns Quarter by Quarter 2011 to Present
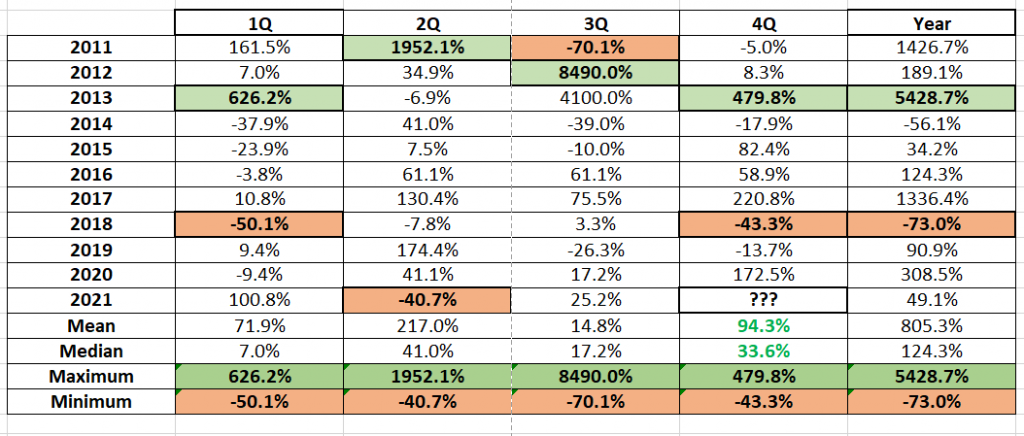
You can see that in the second quarter of 2021, bitcoin lost over 40% of its value. Yet in spite of that brutal selloff the asset is still up 425% year over year. To paraphrase what the world class trader told me, “If you want outlier returns, be aware of the outliers!”
The best up performance occurred in bitcoin in the 3rd quarter of 2013 when it did 8,490%. Its worst quarter was the 3rd quarter of 2011 when it lost 70.1% of its value.
The median for the 4th quarter is 33.6% for bitcoin.
While the average is 94.3% with a worst performance of -43.3% in 2018.
What can we learn from this?
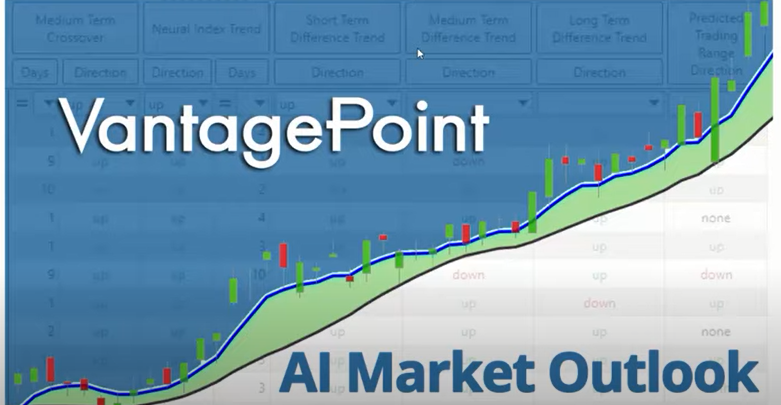
Looking for uptrend forecasts in the artificial intelligence in bitcoin is priceless for traders interested in this asset class!
When bitcoin sells off more than 30% in a quarter, place this asset class firmly on your trading radar and be patient for the a.i. to signal that an a.i. uptrend forecast is in play.
In the world of trading, it is NEVER about how much money you make when you are right. It is always about how little you lose when you are wrong.
Nobody likes losing money. But your long-term success will completely depend on keeping your losses manageable.
Here’s the secret to trading success in ONE simple sentence.
“Manage your risk, or it will manage you!”
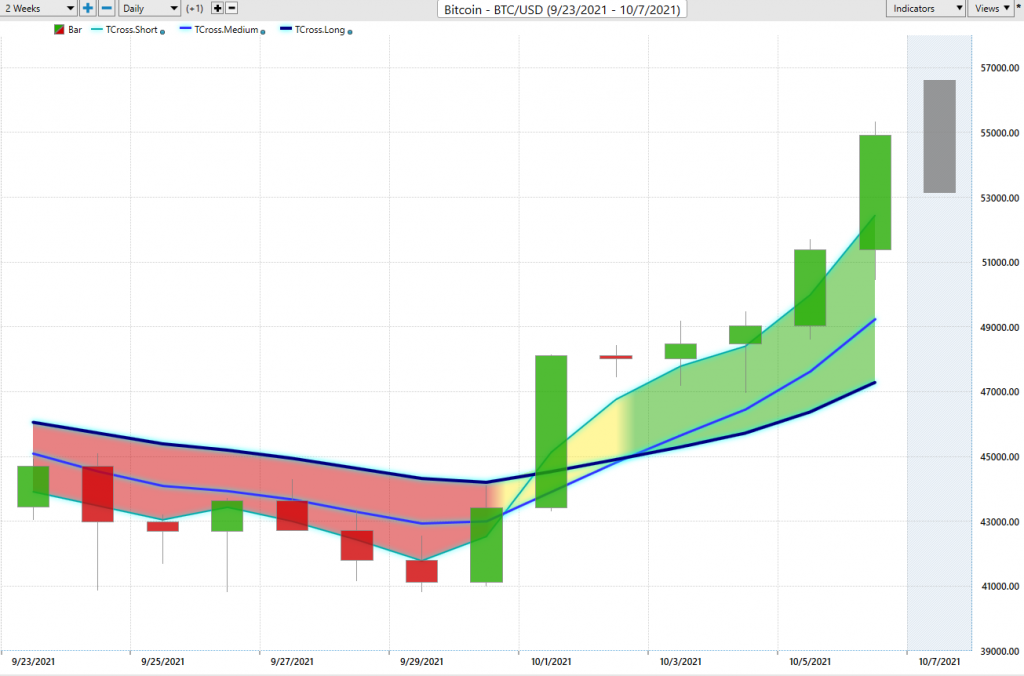
You can tune in to our weekly financial insights on bitcoin by watching our Vantagepoint A.I. Market Outlook here:
Traders are bombarded with tons of information every day.
As a trader, one of the most important realizations you will have is recognizing you need to be tuned in to the PRICE ACTION and REAL DRIVERS that are affecting the markets you are trading. That is rarely portrayed in the form of reporters’ stories about what they think is happening in the economy, the market you are trading and the world. Since we live in a global marketplace the critical factors that affect a trader’s portfolio lie in recognizing and understanding the key drivers of an assets price. All markets are statistically correlated in some manner. Artificial intelligence, machine learning, and neural networks focuses exclusively on these relationships to create very accurate forecasts.
Most traders constantly bewilder themselves by trying to relate the top news stories to their trading decisions
Do you ever read the headlines in the media and wonder how it is going to affect your trading?
- COVID-19
- Trade War with China
- New Government Regulations
- Unemployment Forecasts
- Currency Instability
- Debt Growth
- Recession Concerns
- Negative Interest Rates
How do you make sense of it all? How does it affect your portfolio?
You need to discern what is important and what is not. Every moment there appears to be an infinite amount of new data entering the marketplace.
The questions and concerns can be endless, and the amount of time required to get answers can be overwhelming. In other words, every trader needs to be focused on where is the risk and where is the reward?
But just doing that alone is never going to make you proactive.
The ultimate question that has eluded traders until now, is how do you find the most profitable opportunities?
Here is your link to register for the Artificial Intelligence LIVE online training that can change your financial future. During this online webinar we will show you how artificial intelligence with neural networks focuses on finding the strongest trends and then finds the best move forward by keeping you on the right side of the trend at the right time.
Successful traders are obsessed at finding solid trends.
How good are you at making decisions?
What has your performance been this year?
What’s Your Best Chance to Make Money in The Financial Markets Today?
The Answer A.I. Offers Will Surprise You. Intrigued?
You too can start finding the best trend at the right time regardless of your experience.
After all, a.i. has beaten humans at Poker, Chess, Checkers, Jeopardy and Go. Why should trading be any different?
Intrigued?
Visit with us and check out the A.I. at our Next Live Training.
Discover why artificial intelligence is the solution professional traders go-to for less risk, more rewards, and guaranteed peace of mind.
It’s not magic. It’s machine learning.
Make it count.

IMPORTANT NOTICE!
THERE IS SUBSTANTIAL RISK OF LOSS ASSOCIATED WITH TRADING. ONLY RISK CAPITAL SHOULD BE USED TO TRADE. TRADING STOCKS, FUTURES, OPTIONS, FOREX, AND ETFs IS NOT SUITABLE FOR EVERYONE.
DISCLAIMER: STOCKS, FUTURES, OPTIONS, ETFs AND CURRENCY TRADING ALL HAVE LARGE POTENTIAL REWARDS, BUT THEY ALSO HAVE LARGE POTENTIAL RISK. YOU MUST BE AWARE OF THE RISKS AND BE WILLING TO ACCEPT THEM IN ORDER TO INVEST IN THESE MARKETS. DON’T TRADE WITH MONEY YOU CAN’T AFFORD TO LOSE. THIS ARTICLE AND WEBSITE IS NEITHER A SOLICITATION NOR AN OFFER TO BUY/SELL FUTURES, OPTIONS, STOCKS, OR CURRENCIES. NO REPRESENTATION IS BEING MADE THAT ANY ACCOUNT WILL OR IS LIKELY TO ACHIEVE PROFITS OR LOSSES SIMILAR TO THOSE DISCUSSED ON THIS ARTICLE OR WEBSITE. THE PAST PERFORMANCE OF ANY TRADING SYSTEM OR METHODOLOGY IS NOT NECESSARILY INDICATIVE OF FUTURE RESULTS. CFTC RULE 4.41 – HYPOTHETICAL OR SIMULATED PERFORMANCE RESULTS HAVE CERTAIN LIMITATIONS. UNLIKE AN ACTUAL PERFORMANCE RECORD, SIMULATED RESULTS DO NOT REPRESENT ACTUAL TRADING. ALSO, SINCE THE TRADES HAVE NOT BEEN EXECUTED, THE RESULTS MAY HAVE UNDER-OR-OVER COMPENSATED FOR THE IMPACT, IF ANY, OF CERTAIN MARKET FACTORS, SUCH AS LACK OF LIQUIDITY. SIMULATED TRADING PROGRAMS IN GENERAL ARE ALSO SUBJECT TO THE FACT THAT THEY ARE DESIGNED WITH THE BENEFIT OF HINDSIGHT. NO REPRESENTATION IS BEING MADE THAT ANY ACCOUNT WILL OR IS LIKELY TO ACHIEVE PROFIT OR LOSSES SIMILAR TO THOSE SHOWN.

