

Callon Petroleum is an independent oil and natural gas company focused on the acquisition, exploration, and development of high-quality assets in the leading oil plays of West and South Texas. The company has a market cap of $2.61 billion and trades on average 1.76 million shares a day. $CPE has been a high-flier over the past year having posted gains of 1,060%!
Over the past year Callon Petroleum has taken advantage of improving oil market conditions to refinance and restructure its debt obligations and refinance using the current low-interest rate environment. Analysts feel that the improving oil market prices with this refinancing benefit the companies free cash flow and dramatically improve their financial flexibility. Most recently CPE offered $650 million of senior unsecured notes which are due in 2028. This new financing was used to replace and consolidate $542 million in debt which was due in 2023. Callon Petroleum has been growing earnings very successfully over the past year and far exceeded Wall Street Analysts expectations.
The price of oil is a good barometer of economic health. Many struggling economies around the world are struggling with gas shortages and fuel supplies. The media is saying that it these shortages are the result of consumer panic buying, but with winter approaching and oil rising dramatically in price it appears that shortages in oil have developed while governments have been focused on COVID-19. European Natural Gas prices have increased 650% over the last 18 months.
All you must do is look at the reality that an alternate energy product like coal has almost quadrupled in price within the past year to know that something is wrong. Prices of Gas, Electricity, Carbon Futures… all have a corresponding exponential increase which lends a very serious tone to the competing crude oil and petroleum markets. These huge price increases have led to supply disruptions in many countries including China and Europe.
Over the last two months the top-performing sectors have been petroleum and oil exploration stocks. All these factors confirm that a global energy crunch is underway, and we should anticipate more and more supply chain disruptions.

In this weekly stock study, we will look at and analyze the following indicators and metrics which are our guidelines which dictate our behavior in deciding whether to look for opportunities to buy, sell, or stand aside on a particular stock.
- Wall Street Analysts’ Estimates
- 52-week high and low boundaries
- Vantagepoint A.I. Forecast (Predictive Blue Line)
- The Best Case – Worst Case Scenarios
- Neural Network Forecast
- Daily Range Forecast
- Intermarket Analysis
- Our trading suggestion
We don’t base our trading decisions on things like earnings or fundamental cash flow valuations. However, we do look at them to better understand the financial landscape that a company is operating under.
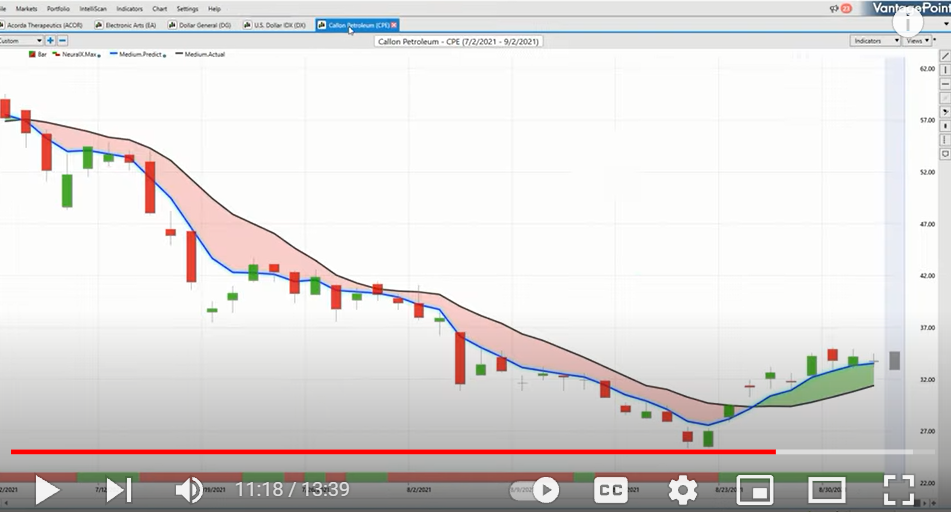
We have featured Callon Petroleum in our Weekly Hot Stocks Outlook several times over the past year. Here is the most recent analysis from August 27th and then again on September 3rd, which highlights how the artificial intelligence tracked this very powerful uptrend and forecasted the giant up move. You can click on these graphics and watch the two-minute analysis on YouTube. Prices at the time the video was published were between $29 and $31.
8/27/21 Hot Stocks Outlook Analysis of Callon Petroleum
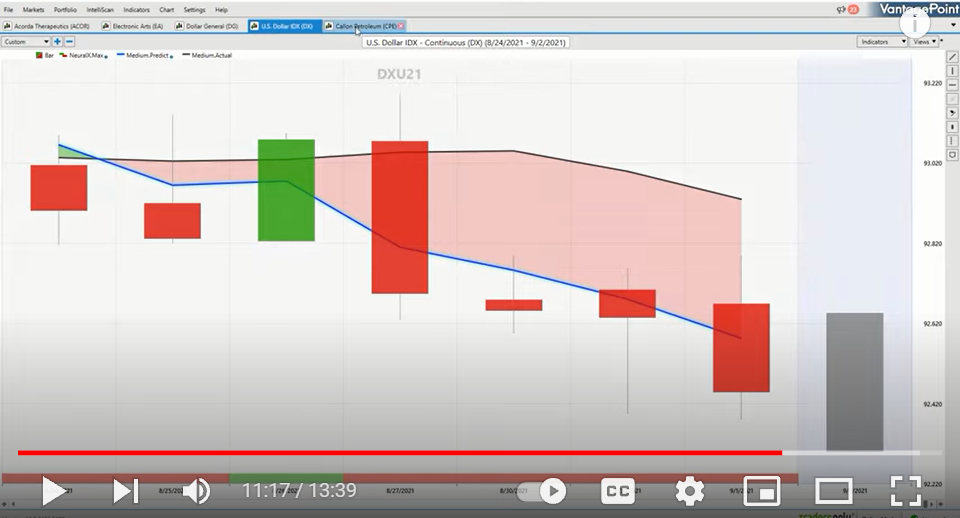
9/3/21 Hot Stocks Outlook Analysis of Callon Petroleum
These videos explain how powerful, simple, and potentially profitable our dynamic artificial intelligence stock forecasting is.
Wall Street Analysts’ Estimates
The 13 analysts offering 12-month price forecasts for Callon Petroleum Co have a median target of $50.00, with a high estimate of $75.00 and a low estimate of 37.00. The median estimate represents a -11.33% decrease from the last price of $56.39. The current consensus among 14 polled investment analysts is to hold the stock. Earnings are expected to grow at 36% per year.
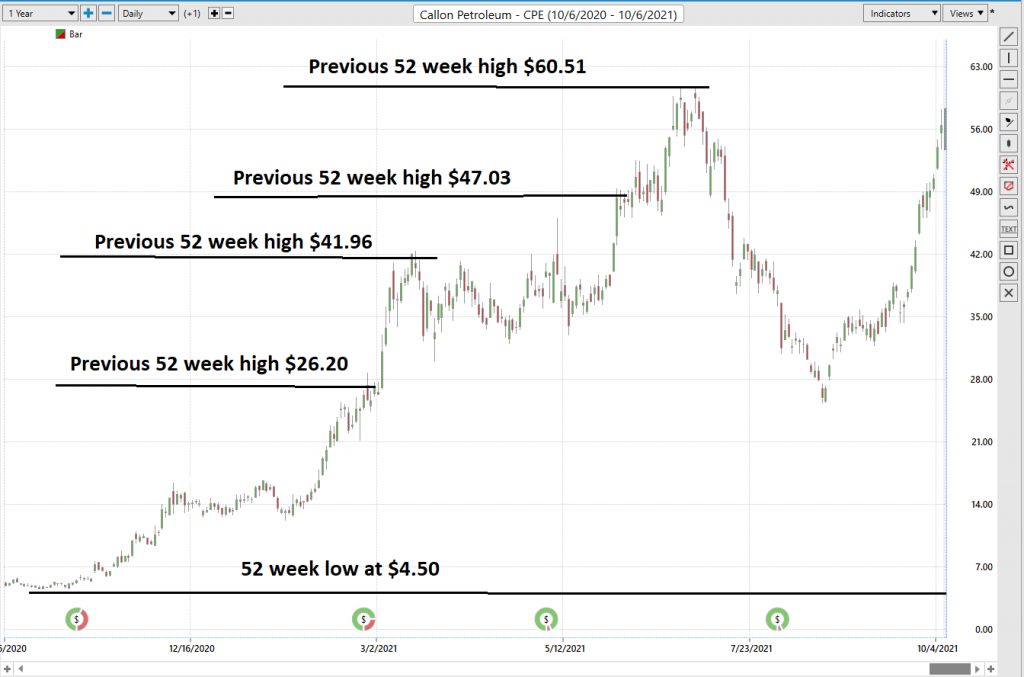
52-Week High and Low Boundaries
Looking at the Long-Term chart of CPE provides us with the 52-week high and low boundaries.
Over the past year we have seen CPE trade as low as $4.50 and as high as $60.51. This tells us that the average weekly trading range for CPE is $1.07. This represents a minimum of 1.7% expected weekly volatility based upon its current price.
We look to amplify this value greatly when trading with the artificial intelligence.
When we study the 52-week chart, by simply eyeballing the chart you can quickly see that for the ideal Power Strategy for the past year was paying attention to all the times the company broke through to a new 52-week high and surrendering to this monster trend.
We like to study the 52-week chart before doing anything else just so that we can get a feel for how the company has performed over the past year and compare that to other opportunities and the broader market indexes.
Over the past year the Dow Jones Industrial is up 22.3%. The S&P 500 Index is UP 28.43% and the NASDAQ Composite is UP 28.9%. CPE over this same time frame is UP 987.04% and has exponentially outperformed the broader market indexes. But as you are tempted by that additional upside gain you also need to look at the DOWNSIDE and CPE has had numerous pullbacks greater than 120%.
Best Case – Worst Case Scenario $CPE
The chart below shows the numerous sharp declines that CPE had over the past year.
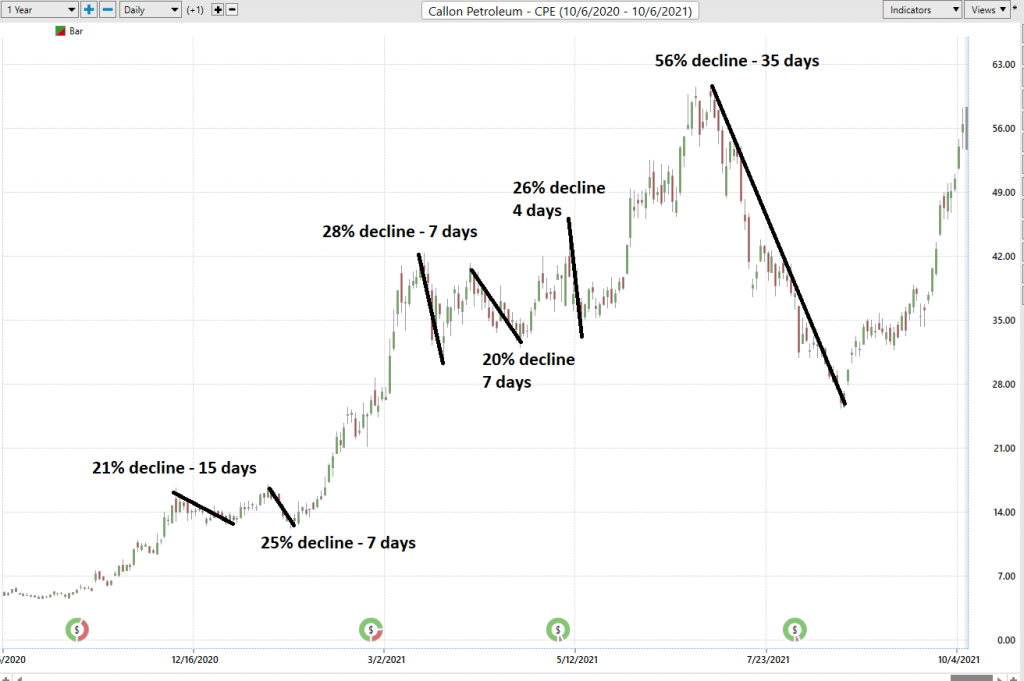
The declines ranged from 20% and as much as 56%. The stock falls much faster than it rises.
Market rallies ranged from 75% to 229% and took anywhere from 33 to 46 trading sessions.
What we can learn from this very basic worst-case analysis is that should CPE fall 22% or more from a recent peak, this asset should immediately go on your trading radar, and you should wait for the A.I. forecast to signal an UPTREND. Each time this occurred the up moves were swift and dramatic.
This price volatility is ideal for SWING traders who can exploit the upside without having to experience the steep decline.
Vantagepoint A.I. Forecast (Predictive Blue Line)
On the following chart you will see the power of the VantagePoint Predictive blue line which determines the medium term trend price forecast.
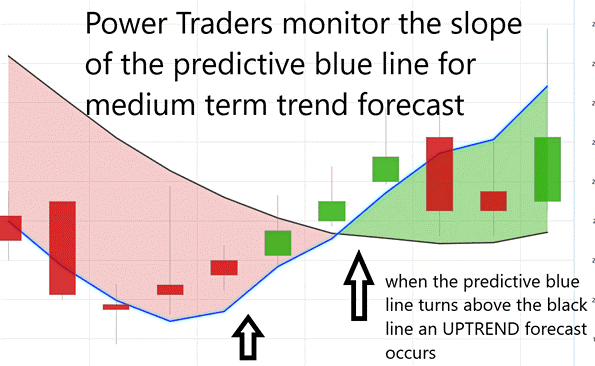
The guidelines we abide by are as follows:
- The slope of the predictive blue line determines the trend and general direction of CPE
- Ideally, the VALUE ZONE is determined to try and buy the asset at or below the predictive blue line.
Here is a snapshot of the last years price action. The slope of the predictive blue line is a beautiful trend forecasting tool and has yielded huge returns for Power Traders.
But let’s do some basic trend forecasting analysis based upon looking at the Vantagepoint predictive blue line and $CPE Earnings announcement. I have taken the liberty of highlighting the areas on the chart below when earnings were announced.
What is immediately visible is that the a.i. trend forecast going into the earnings announcement is very highly statistically correlated to what we can expect in the stock’s performance post-earnings.
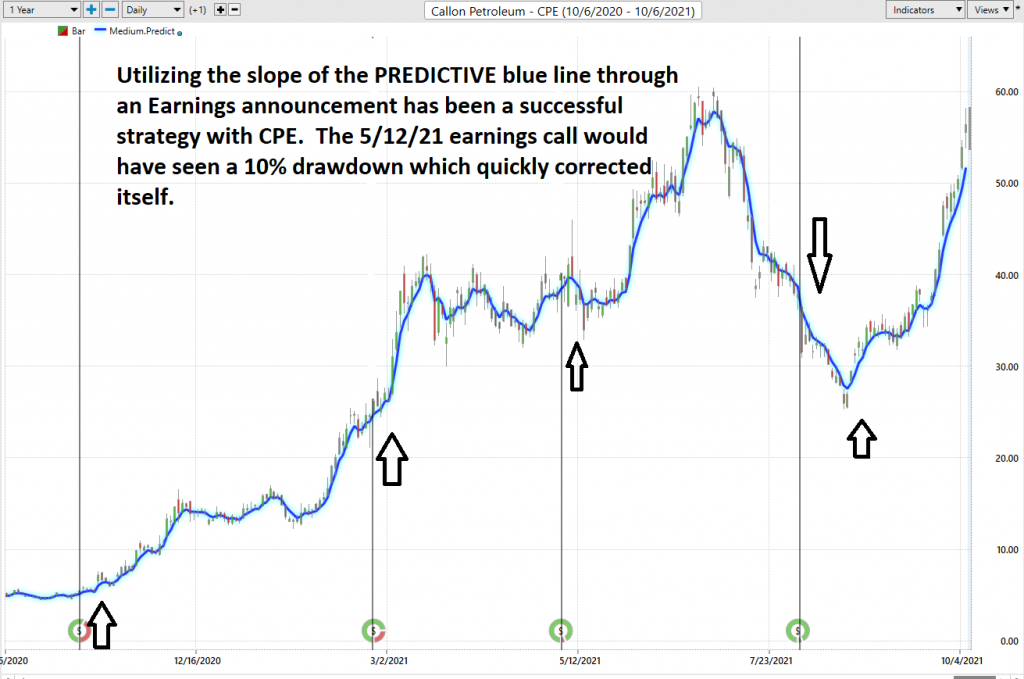
The earnings announcement on 5/5/21 saw the market chop 10% higher and lower before the uptrend reasserted itself.
Place your attention on how the predictive blue line turned positive on August 19th and 20th and how the stock has rallied over 100% since then. Next CPE earnings call is scheduled for November 4th.
One of the giant obstacles that traders face is trying to integrate and interpret news evens into their trading. Let me explain:
Earnings call November 2, 2020, earnings were expected to be at 10 cents per share. They came in at 64 cents.
Earnings on February 24, 2021, were expected at 41 cents. They came in at $1.00.
Earnings on May 5, 2021, were expected at 95 cents. They came in at $1.49.
Earnings on August 3rd, 2021, were expected at .10 cents and came in at $1.49. You can quickly see how Callon Petroleum massively exceeded expectations in their earnings for the last 4 quarters. This would traditionally be viewed as massively explosive for price. But what we saw was incredible volatility before an uptrend resumed.
We always suggest traders focus on the predictive blue line as the medium-term trend forecast regardless of the news story. As a trader the only thing that matters is how price responds. Price is what will create wealth or destroy your account. Understand the focus on the medium-term forecast of the predictive blue line is important.
Many traders will buy the news that earnings are explosive, and they would potentially have faced a 56% + drawdown in their accounts. Ouch!
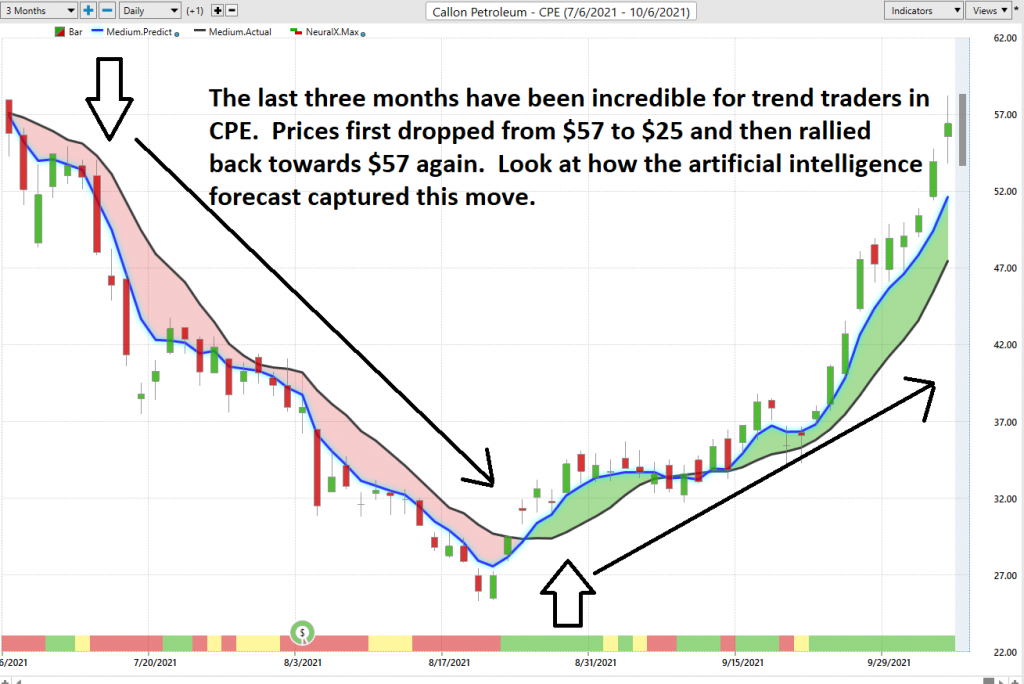
Let’s zoom in on the last three months of price action in Callon Petroleum.
You can quickly see that starting on August 9th the a.i. trend forecast was negative, and prices cratered from the 57 level to as low as $25 over the first six weeks. However, the trend forecast changed from DOWN to UP on August 23rd at $29 a share. Looking only at price and the predictive blue line observe how price closed for two consecutive days above the predictive blue line initiating a change of trend forecast.
Prices traded sideways for the next thirteen sessions before their upward trajectory back to $57 per share.
Neural Network Indicator (Machine Learning)
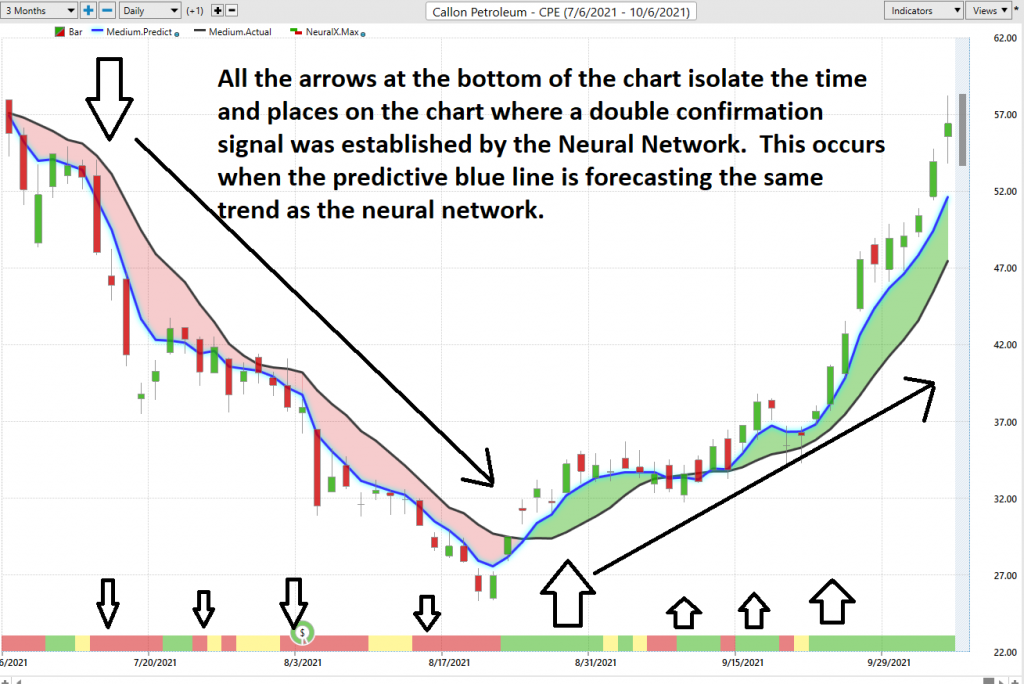
At the bottom of the chart is the Neural Network Indicator which predicts future short-term strength and/or weakness in the market. When the Neural Net Indicator is green it communicates strength. When the Neural Net is red it is forecasting short term weakness in the market.
A Neural Net is a computational learning system that uses a network of functions to understand and translate massive amounts of data into a desired output, consistently monitoring itself and improving its performance.
Whenever Power Traders are looking for statistically valid trading setups, they look for a DOUBLE confirmation signal. This signal occurs whenever the blue predictive line and the Neural Net at the bottom of the chart suggest the same future expected outcome.
We advocate that Power Traders cross reference the chart with the predictive blue line and neural network indicator to create optimal entry and exit points.
Traders look for confirmation on the Neural Net to position themselves LONG or SHORT in the market. In other words, when the A.I. forecast is green, and The Neural Net is green, that presents a buying opportunity.
The inverse is also true, when the A.I. forecast is red and the Neural Net is red, that is a SELLING opportunity. The arrows on the chart below highlight the trading zones where Power Traders would’ve been using double confirmation to BUY in cross referencing the A.I. forecast with the Neural Net.
Power Traders are always looking to apply both the Neural Network and A.I. to the markets to find statistically sound trading opportunities.
VantagePoint Software Daily Price Range Prediction
One of the powerful features in the VantagePoint Software which Power Traders use daily is the Price Range prediction forecast.
This forecast is what permits Power Traders to truly fine tune their entries and exits into the market.
Every day traders are faced with the anxiety and frustration of wondering where they should be looking to buy and sell the market. VantagePoint’s A.I. makes this decision super easy with the Daily Price Range Forecast.
For short term traders the important question that they have to confront every day is where should I buy? Where should I place my stop? Where should I sell? The VantagePoint Daily Price Range forecast can help them answer this question.
Here is the price chart of CPE during the most recent three months. The markets fell during the first six weeks and then rallied sharply.
Observe how the channel is very clearly delineated and it is very easy to observe where anticipated support and resistance over the short terms are. Traders look to buy near the bottom of the channel and sell at or above the top of the channel.
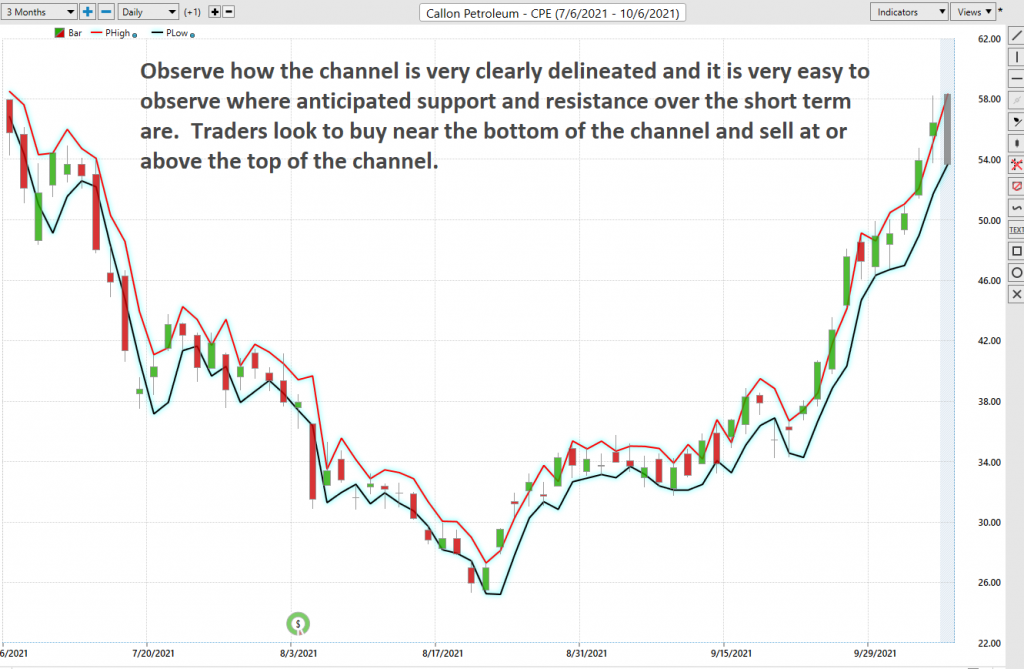
See how the upper and lower bands of the price range forecast form a very clear channel of trading activity as well. Swing traders are always looking for opportunities to buy towards the bottom of the predicted channel and selling opportunities above the top band.
Intermarket Analysis
Power lies in the way we respond to the truth we understand.
Callon Petroleum has a great narrative. It has solid earnings, great financials.
Management has made the company more financially flexible by restructuring its debt obligations.
One of the supremely important questions in trading is what is driving the price? Headlines often create interesting narratives. But these “stories” only capture the imagination. Traders want and need to understand the cause and effect of price movement.
The only way to get an answer to this important question is through intermarket analysis which looks at statistical price correlations of assets.
We live in a global marketplace.
Everything is interconnected.
Interest rates, Crude Oil Prices, and the volatility of the Dollar amongst thousands of other variables affect the decisions companies must make to flourish and prosper in these very challenging times. Trying to determine what these factors are is one of the huge problems facing investors and traders.
You always have a choice. You can tune in to the talking heads in the media who spin talking points that promote fear. Or you can rely on facts to base your decision-making on.
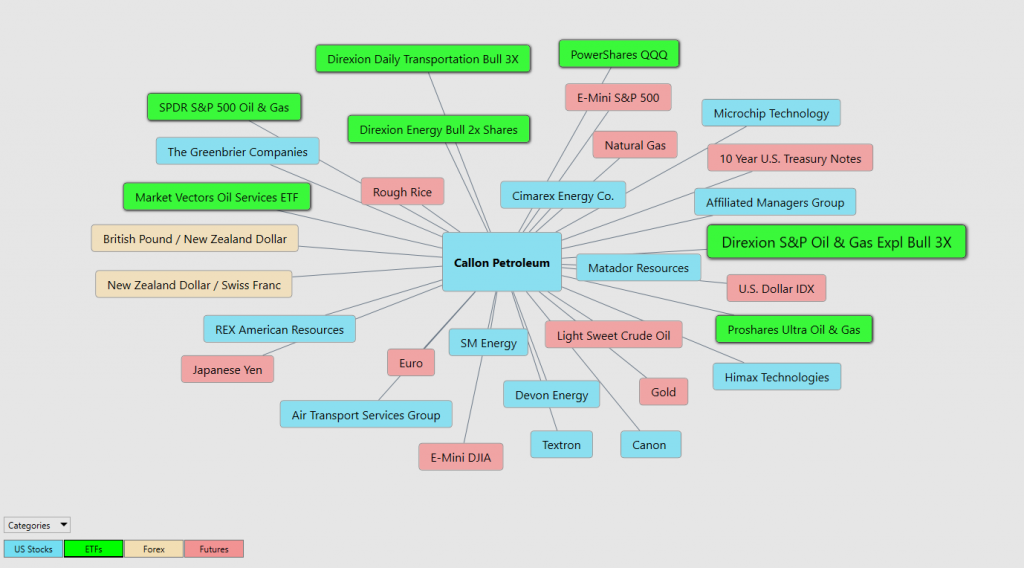
Within the following Intermarket Analysis graphic, you will see the 31 markets that are the key drivers to CPEs price. This graphic illustrates some of the other energy sector highflyers like SM Energy (SM), Devon Energy (DVN), Textron (TXT), Matador Resources (MTDR) all of which are up as much as several hundred in the past year. These assets have been on the radar of Power Traders as this explosive move has unfolded.
There is great value to be had in studying and understanding the key drivers of CPE’s price action. This graphic provides a microcosmic view of what factors have been driving CPE’s price higher.
Suggestion for Traders
We think that there is a giant supply/demand imbalance in the energy sector. As we analyze the energy sector, we see several oil explorations companies continuing to make new 52 week high. We think that on any pullbacks traders should use the a.i. daily price range forecast to get long CPE. While we anticipate some resistance at the 52-week highs at 61 we think this is a massive bull market that is underway.
Option savvy traders could consider looking for opportunities for selling puts and opportunities for buying deep out of the money calls with about 6 months before they expire.
Our recommendation is to follow the A.I. trend analysis as outlined in this stock study and practice good money management on all trades.
We will re-evaluate based upon:
- New Wall Street Analysts’ Estimates
- New 52-week high and low boundaries
- Vantagepoint A.I. Forecast (Predictive Blue Line)
- Neural Network Forecast
- Daily Range Forecast
Let’s Be Careful Out There!
Remember, It’s Not Magic.
It’s Machine Learning.

IMPORTANT NOTICE!
THERE IS SUBSTANTIAL RISK OF LOSS ASSOCIATED WITH TRADING. ONLY RISK CAPITAL SHOULD BE USED TO TRADE. TRADING STOCKS, FUTURES, OPTIONS, FOREX, AND ETFs IS NOT SUITABLE FOR EVERYONE.
DISCLAIMER: STOCKS, FUTURES, OPTIONS, ETFs AND CURRENCY TRADING ALL HAVE LARGE POTENTIAL REWARDS, BUT THEY ALSO HAVE LARGE POTENTIAL RISK. YOU MUST BE AWARE OF THE RISKS AND BE WILLING TO ACCEPT THEM IN ORDER TO INVEST IN THESE MARKETS. DON’T TRADE WITH MONEY YOU CAN’T AFFORD TO LOSE. THIS ARTICLE AND WEBSITE IS NEITHER A SOLICITATION NOR AN OFFER TO BUY/SELL FUTURES, OPTIONS, STOCKS, OR CURRENCIES. NO REPRESENTATION IS BEING MADE THAT ANY ACCOUNT WILL OR IS LIKELY TO ACHIEVE PROFITS OR LOSSES SIMILAR TO THOSE DISCUSSED ON THIS ARTICLE OR WEBSITE. THE PAST PERFORMANCE OF ANY TRADING SYSTEM OR METHODOLOGY IS NOT NECESSARILY INDICATIVE OF FUTURE RESULTS. CFTC RULE 4.41 – HYPOTHETICAL OR SIMULATED PERFORMANCE RESULTS HAVE CERTAIN LIMITATIONS. UNLIKE AN ACTUAL PERFORMANCE RECORD, SIMULATED RESULTS DO NOT REPRESENT ACTUAL TRADING. ALSO, SINCE THE TRADES HAVE NOT BEEN EXECUTED, THE RESULTS MAY HAVE UNDER-OR-OVER COMPENSATED FOR THE IMPACT, IF ANY, OF CERTAIN MARKET FACTORS, SUCH AS LACK OF LIQUIDITY. SIMULATED TRADING PROGRAMS IN GENERAL ARE ALSO SUBJECT TO THE FACT THAT THEY ARE DESIGNED WITH THE BENEFIT OF HINDSIGHT. NO REPRESENTATION IS BEING MADE THAT ANY ACCOUNT WILL OR IS LIKELY TO ACHIEVE PROFIT OR LOSSES SIMILAR TO THOSE SHOWN.

