
Every trader wants and needs to be able to find strong high probability trends if they intend to prosper. The challenge of trading is that there are tens of thousands of markets, and this abundance of choices often makes market selection a very confusing task. Add on to this problem that many of these markets often fluctuate wildly, traders are often feeling that they are left with a Rubik’s Cube puzzle trying to figure out where they should commit their focus in trading. This is an age-old problem in trading which clearly communicates how important market selection is towards long term success.
To understand this problem and its solution we need to answer the question of how we define strength? And what is a trend? My experience has been that newbies have no response to these two questions, and it sets them up for huge problems in their trading. Seasoned traders understand that the answers to these questions can be highly subjective, but by digging in to risks they pose we can begin to comprehend the potential rewards and realities that great traders face.
Every trader needs to know how to identify trends. This is what allows us to trade with confidence and with the probabilities in our, which in turn increases the odds of a favorable outcome.
There is an abundance of technical indicators and techniques that often overwhelm traders as they try to answer the simple question, “Is this market trending?”
At its core a trend is nothing more than a bias. Ideally the bias should be backed up and confirmed by at least three separate and distinct data points that show a prevailing directional movement.
While this definition is very practical, the first problem traders obsess over is they see a binary choice.
Traders can make money in up markets or down markets. The reality is markets only trend about 30% of the time. That means that 70% of the time a market is not tradeable. It is in an undefined sideways range which presents no bias of directional movement.
This means there is a third observation which traders must apply to their analysis – a trend can be Up, DOWN or UNDEFINED (SIDEWAYS).
New traders encounter huge problems trading sideways markets which is very low probability trading. However, there are three very simple observational techniques that will make determining trend strength a very practical and manageable task. Let’s get started!
Characteristics of a Trending Market
Of primary importance is we need to know how to identify a trending market. Traders and analysts have complicated the topic for years, but it’s very simple, I promise. The greatest obstacle that exists is the formidable nonsensical vocabulary that exists to classify a trend as UP, DOWN or SIDEWAYS.
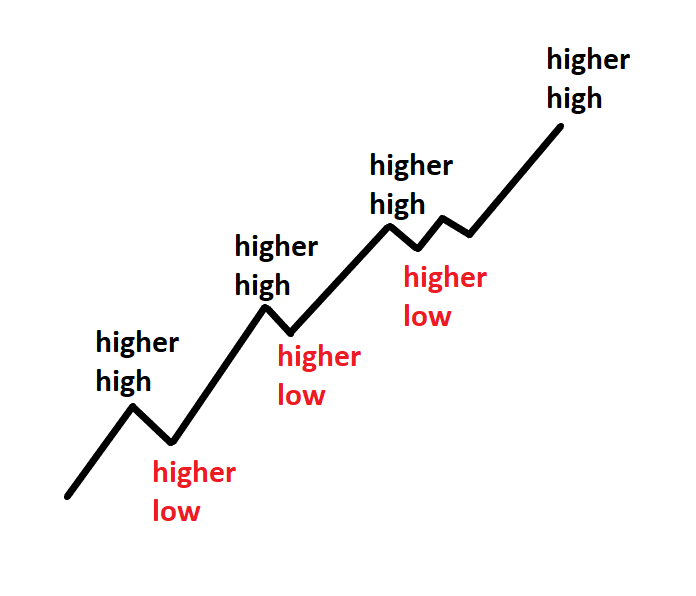
An up-trending market shows directional bias that is making higher highs followed by higher lows.
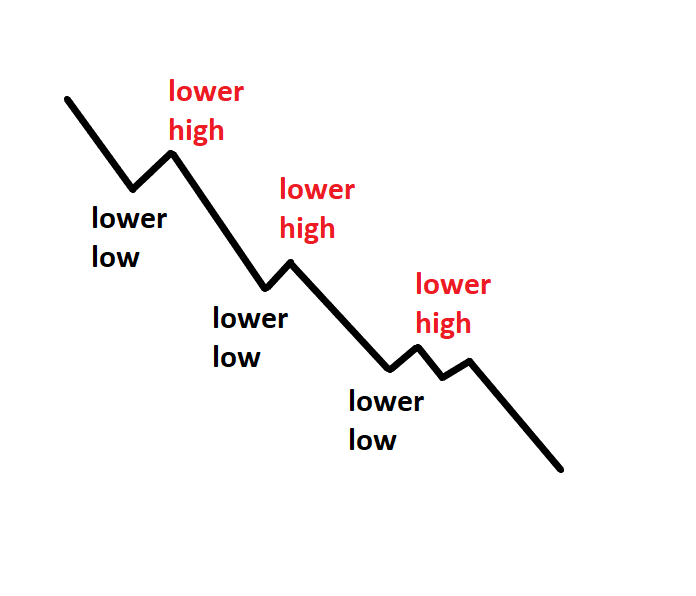
A down trending market shows directional bias that is making lower lows and lower highs.
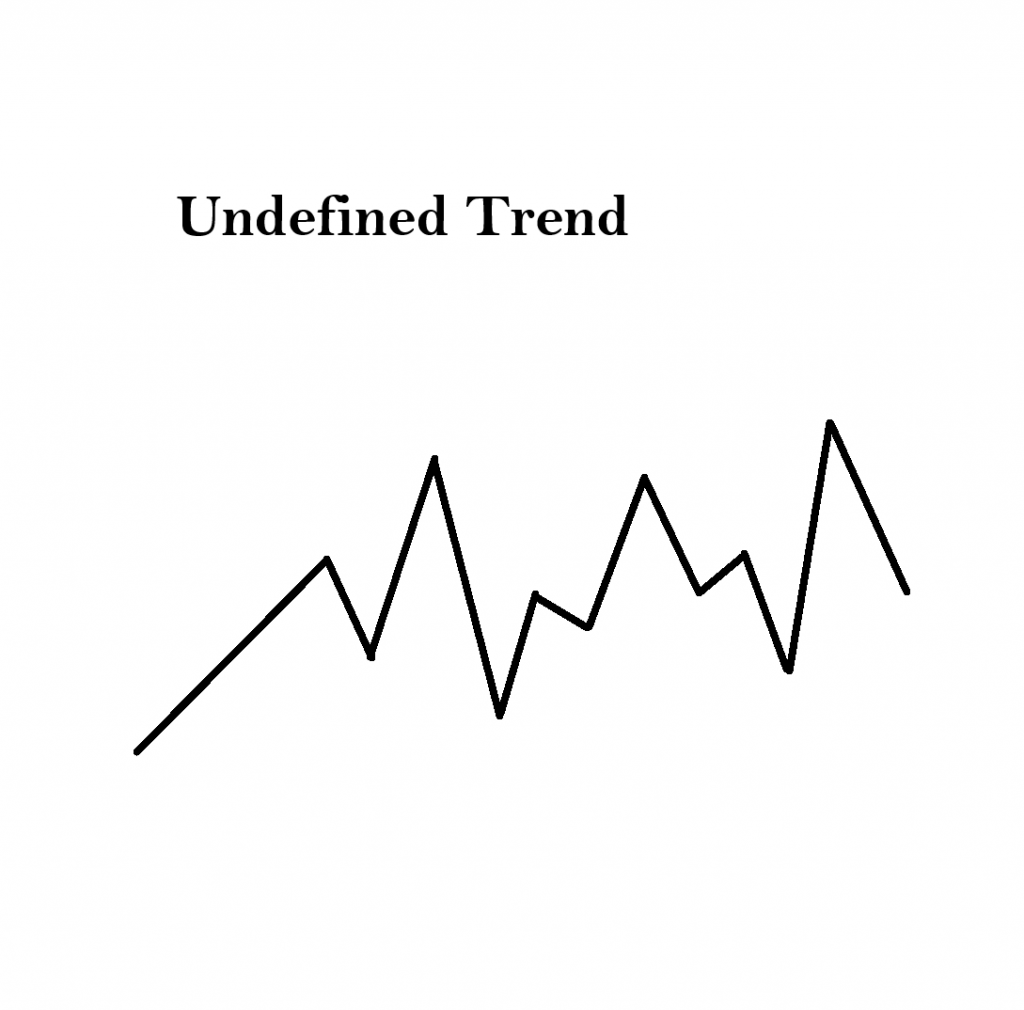
A sideways or undefined market shows no directional bias.
That’s it. Pretty basic stuff, right?
I will tell you right now that 90%of the problems traders have is ignoring this simplicity. They either fight the trend or get involved with non-trending markets.
But now comes the fun part. We need to take this very basic concept of directional movement, highs and lows and turn it into actionable information.
Let’s measure directional bias over 4 different time frames. These times frames are for illustrative purposes only. You can choose your own times frames. The point is, by measuring change over four distinct time frames, we will be able to detect what all trends consist of.
Burrow this one word into your trading consciousness: REPETITION.
TREND TRADERS need to become obsessed about observable REPETITION and ignore everything else!
Changes are either obvious or they are not. Our focus is to organize and classify information on what is obvious so that we can make the best trading decisions.
Stated another way, we ignore undefined trends and only engage with those markets that are showing a directional bias. Show me a great trader and I will show you someone who has learned the fine art of making great decisions by being very discriminating and requiring that certain factors be in place before they proceed.
How?
Let’s measure the changes that have occurred over four different time frames.
What has the market done for the last 3 months?
What has the market done for the past month?
What has the market done for the past week?
What has the market done for the past day?
By simply measuring the change that has occurred we are essentially collecting and categorizing a series of plusses or minuses that allow us to begin to see a repetitive pattern.
The ideal pattern of repetition that we are looking for is uniformity in terms of trend direction.
I refer to this as “the footprint” that the market has left for us to examine.
In an upmarket our ideal trend is:
- Positive motion over 3 months. (+)
- Positive motion over the past 1 month. (+)
- Positive motion over 1 week. (+)
- Positive motion over the past day. (+)
I can abbreviate this up trending footprint by simply showing the four + marks, + + + +.
Each + indicates a positive directional movement for the time period measured.
When a market displays this footprint, we want it on our radar as it is trending.
On the downside the ideal market trend is:
- Negative motion over 3 months. (-)
- Negative motion over the last month (-)
- Negative motion over the past week (-)
- Negative motion over the past day. (-)
I can abbreviate this down trending footprint by simply showing the four – negative marks, – – – -.
The most conservative but highest probability trades will focus on simply trading this type of uniformity.
Most traders ignore getting involved with non-trending markets which lend themselves to horrible whipsaws and volatility. They try to predict when the market will trend. It is a losing hand anyway you look at it.
Great traders find great trends and then they learn how to surrender to them while managing their risk.
You can visualize the trading footprint that an undefined market provides it is a series of non-repetitive plusses and minuses which clearly communicates that no trend is in place.
Determining the strength and repetition of a trend doesn’t need to be a complex time-consuming operation. Something as simple as the technique discussed above are what great trend traders become obsessed with.
Keep in mind this is as useful in bearish markets as it is in bullish markets. Most importantly, it keeps you out of choppy markets by requiring repetition in the time frames that you are measuring.
The best thing any trader can do for themselves whether they are analyzing any market is to get back to basics. A trending market is what builds wealth in your account. Not a story about its earnings, management team, or takeover possibilities.
Every market tells its story minute by minute, hour by hour, day by day, month by month. What we as traders need to be obsessed about is TRENDS.
What we as traders must focus upon is REPETITION.
Your job as a trader is not to know what will happen next.
Rather, your job is to organize the information the market provides so you can make the best trading decisions by assembling them in a way that stacks the odds in your favor.
This is why, in today’s day and age, the technology of artificial intelligence can offer you a huge indispensable advantage.
Artificial intelligence combined with Neural Networks helps to isolate and locate through pattern recognition those trends which most traders are completely unaware of. It looks for patterns and correlations that are invisible to the average trader.
You’ve now learned how to organize information into UP, DOWN, and UNDEFINED trends.
Artificial intelligence and Neural Networks do this with unparalleled power and effectiveness.
Take a look at a few charts which show how a.i. will outperform humans every time.
The slope of the predictive blue line determines the trend.
As you look at the accompanying charts ask yourself, were you aware of this market?
Were you aware of this repetition?
Or were you distracted by any of the millions of stimuli that traders wrestle with daily?
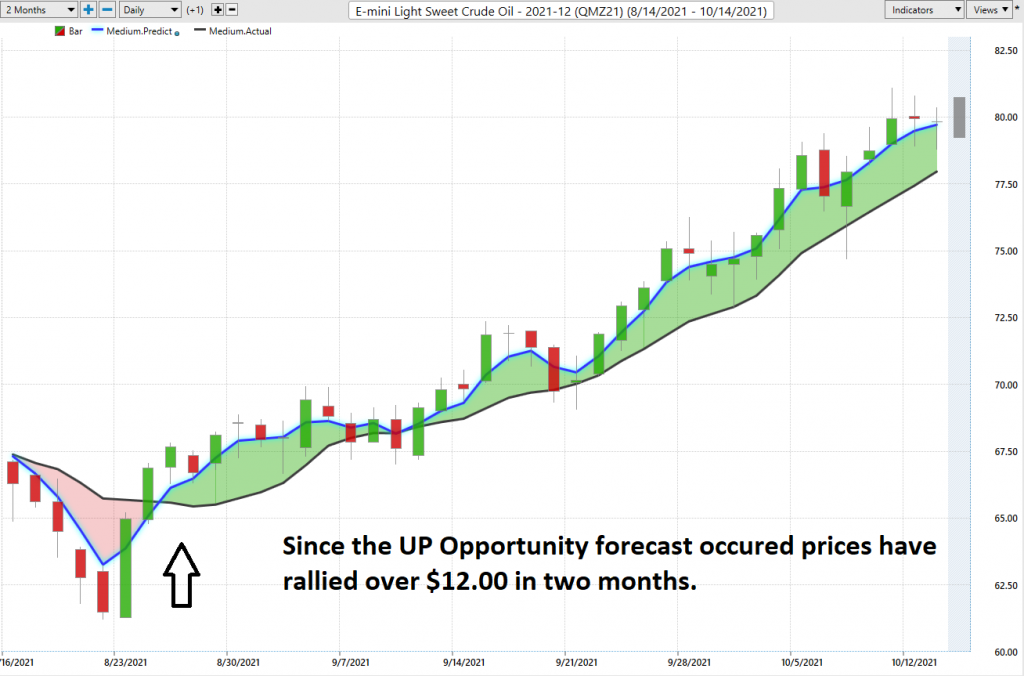
Here is a chart of Crude Oil.
When the blue line turns above the black line the artificial intelligence is seeing a REPETITION unfold that is forecasting higher prices. Prices rallied almost 18% since the up forecast occurred.
Here is a chart of Pfizer Inc which we recently featured in our stock study which you can find here.
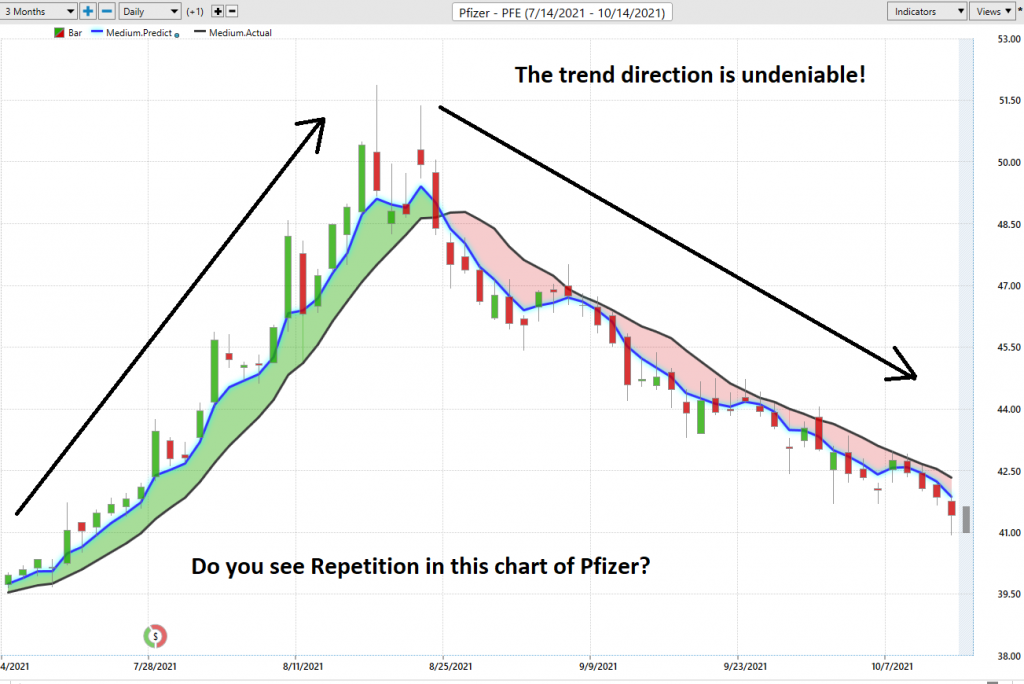
The artificial intelligence kept traders on the right side of the right trend at the right time. Pfizer rallied 21% over thirty days and then gave back almost all of its gains in the past month.
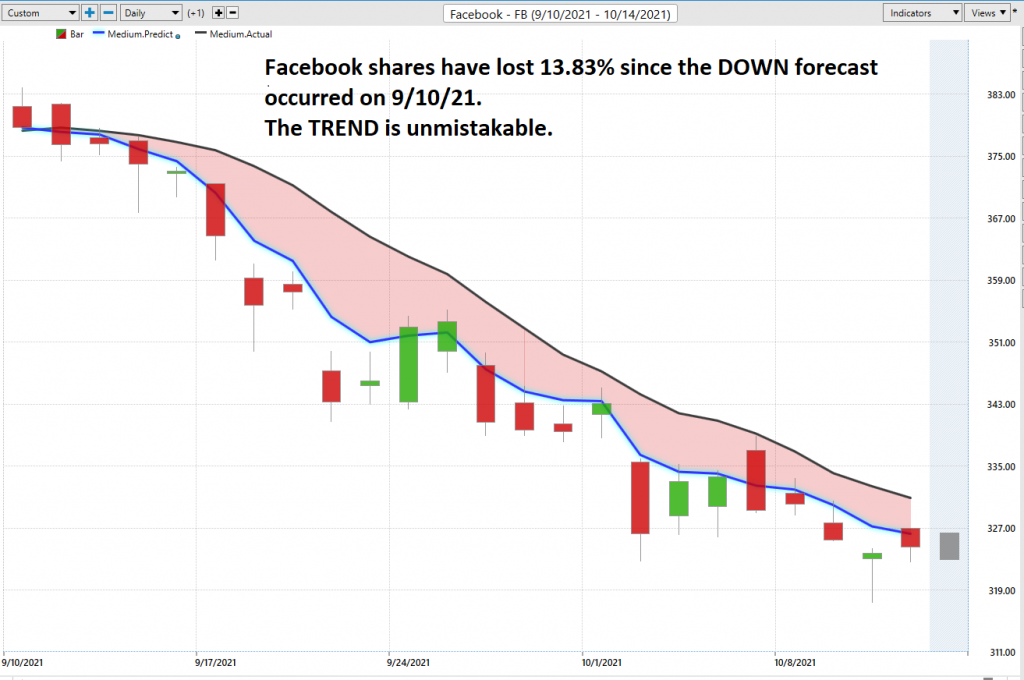
Here is Facebook over the past month which has lost almost 14% in value. We featured Facebook recently in our Hot Stocks Outlook which you can find here.
Trading with artificial intelligence is the best way to minimize risk by having statistical certainty that you are on the right side of the right market at the right time.
We live in unique times.
Since artificial intelligence has beaten humans in Poker, Chess, Jeopardy and Go! do you really think trading is any different?
How do you think your investment portfolio compares when pitted against artificial intelligence?
Are you capable of finding those markets with the best risk/reward ratios out of the thousands of trading opportunities that exist?
Knowledge. Useful knowledge. And its application is what A.I. delivers.
What has your performance been this year?
What’s Your Best Chance to Make Money in The Financial Markets Today?
The Answer A.I. Offers Will Surprise You. Intrigued?
You too can start finding the best trend at the right time regardless of your experience.
Intrigued? Visit with us and check out the A.I. at our Next Live Training.
Discover why Vantagepoint’s artificial intelligence is the solution professional traders go-to for less risk, more rewards, and guaranteed peace of mind.
It’s not magic. It’s machine learning.
Make it count.

IMPORTANT NOTICE!
THERE IS SUBSTANTIAL RISK OF LOSS ASSOCIATED WITH TRADING. ONLY RISK CAPITAL SHOULD BE USED TO TRADE. TRADING STOCKS, FUTURES, OPTIONS, FOREX, AND ETFs IS NOT SUITABLE FOR EVERYONE.
DISCLAIMER: STOCKS, FUTURES, OPTIONS, ETFs AND CURRENCY TRADING ALL HAVE LARGE POTENTIAL REWARDS, BUT THEY ALSO HAVE LARGE POTENTIAL RISK. YOU MUST BE AWARE OF THE RISKS AND BE WILLING TO ACCEPT THEM IN ORDER TO INVEST IN THESE MARKETS. DON’T TRADE WITH MONEY YOU CAN’T AFFORD TO LOSE. THIS ARTICLE AND WEBSITE IS NEITHER A SOLICITATION NOR AN OFFER TO BUY/SELL FUTURES, OPTIONS, STOCKS, OR CURRENCIES. NO REPRESENTATION IS BEING MADE THAT ANY ACCOUNT WILL OR IS LIKELY TO ACHIEVE PROFITS OR LOSSES SIMILAR TO THOSE DISCUSSED ON THIS ARTICLE OR WEBSITE. THE PAST PERFORMANCE OF ANY TRADING SYSTEM OR METHODOLOGY IS NOT NECESSARILY INDICATIVE OF FUTURE RESULTS. CFTC RULE 4.41 – HYPOTHETICAL OR SIMULATED PERFORMANCE RESULTS HAVE CERTAIN LIMITATIONS. UNLIKE AN ACTUAL PERFORMANCE RECORD, SIMULATED RESULTS DO NOT REPRESENT ACTUAL TRADING. ALSO, SINCE THE TRADES HAVE NOT BEEN EXECUTED, THE RESULTS MAY HAVE UNDER-OR-OVER COMPENSATED FOR THE IMPACT, IF ANY, OF CERTAIN MARKET FACTORS, SUCH AS LACK OF LIQUIDITY. SIMULATED TRADING PROGRAMS IN GENERAL ARE ALSO SUBJECT TO THE FACT THAT THEY ARE DESIGNED WITH THE BENEFIT OF HINDSIGHT. NO REPRESENTATION IS BEING MADE THAT ANY ACCOUNT WILL OR IS LIKELY TO ACHIEVE PROFIT OR LOSSES SIMILAR TO THOSE SHOWN.

