

Tata Motors Limited is an Indian multinational automotive manufacturing company, headquartered in the city of Mumbai, India. The company produces passenger cars, trucks, vans, coaches, buses, luxury cars, sports cars, construction equipment. The company has a market cap of $25.1 billion and trades on average 1.75 million shares per day.
Over the past 18 months $TTM has been adversely affected by chip shortages which have affected all car manufacturers.
Tata is the largest Indian car manufacturer with a market share of over 37%. They own the Jaguar – Land Rover brands and produce their own electric vehicles like Tigor, Nexon and others. With such a dominant and established leadership position within the Indian market, Tata bulls believe $TTM is a stock for all season.
Sales growth in the last five years for $TTM have been sluggish.
Tata has its own Electric Vehicle product line.
The portfolio of EV offerings faces very stiff and severe competition from General Motors (NYSE:GM), Ford Motor (NYSE:F), Volkswagen (OTCMKTS:VWAGY), and Tesla (NASDAQ:TSLA), all of whom are aggressively positioning themselves to compete in the Indian market.
Tata Motors recently announced an agreement with TPG Group to raise $1 billion to expand its position into electric cars. The new subsidiary will focus on battery electric vehicles, battery technology, and charging infrastructure, among other things, and aims to build a portfolio of 10 EVs in five years.
Over the next five years, this company will create a portfolio of 10 electric vehicles and establish a charging infrastructure across India, in partnership with Tata Power Ltd, to spur the rapid adoption of such eco-friendly vehicles. Over the next five years, this company will create a portfolio of 10 electric vehicles and establish a charging infrastructure across India, in partnership with Tata Power Ltd, to spur the rapid adoption of such eco-friendly vehicles.
On its most recent October 11th Earnings call the company reported:
- Total sales were up 24% year over year.
- Commercial vehicle sales were up 57%.
- Passenger vehicle sales were up 11%.
- Jaguar Land Rover sales were down 14%.
In this weekly stock study, we will look at and analyze the following indicators and metrics as are our guidelines which dictate our behavior in deciding whether to buy, sell, or stand aside on a particular stock.
- Wall Street Analysts’ Estimates
- 52-week high and low boundaries
- Best Case – Worst Case Analysis
- Vantagepoint A.I. Forecast (Predictive Blue Line)
- Neural Network Forecast
- Daily Range Forecast
- Intermarket Analysis
- Our trading suggestion
We don’t base our trading decisions on things like earnings or fundamental cash flow valuations. However, we do look at them to better understand the financial landscape that a company is operating under.
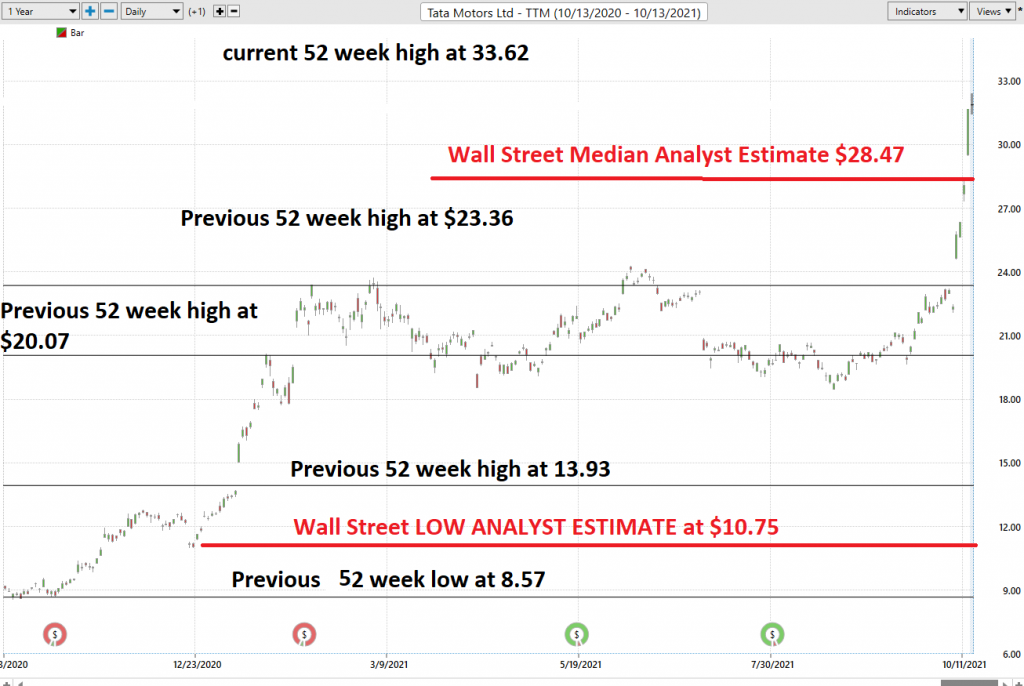
Analysts Ratings
The first set of boundaries which we explore in our stock study is what do the professionals think who monitor the stock for a living. We can acquire this information by simply looking at the boundaries that the top Wall Street Analysts set for $TTM. This initial set of boundaries provides us with an idea of what is expensive, fairly value and cheap. The 31 analysts offering 12-month price forecasts for Tata Motors Ltd have a median target of $28.47, with a high estimate of $42.78 and a low estimate of $10.75.
The median estimate represents a -14.75% decrease from the last price of 33.40.
From this simple analysis we can see that $TTM is more than fairly valued at present time but some on Wall Street think that is has the potential to run another $10+ dollars per share.
52-week High-Low Chart
Over the last 52 weeks $TTM has traded as high as $33.62 and as low as $8.57. This means provides us with an annual trading range of $25.05. We refer to these as the commonsense metrics which we use as baseline measurements of understanding normal value. When using artificial intelligence, we look to amplify our returns based upon these baseline measurements.
Whenever we trade, we always pay attention to where we are in relation to the 52-week trading range. It is very common to see the 52-week high provide very strong resistance to the market until it is breached. Often when the 52-week high is breached we will see the stock price explode higher very quickly over a very short period.
Stocks which breach their 52-week highs multiple times a year are often in very strong trends which we want to be aware of. The 52-week boundary often acts as significant resistance in thwarting trends. As price bounces off this level, we want to become extremely focused on what the artificial intelligence forecast is signaling.
I like to place all these boundaries, including the Wall Street Analysts Estimates on a chart to quickly visualize the history of the stocks performance and to be able to see how that relates to what professional analysts are thinking.
You can see in the following chart of $TTM that the analyst markers of value accompanied by the 52-week range give us a very effective backdrop of “perceived value.” These boundaries are what we think drives the news narrative and informs us as to the most solid trading opportunities in the stock.

Best Case – Worst Case Analysis
Next, we want to evaluate $TTM in comparison to the performance of the major stock market indexes which we have greater familiarity with and then look at the drawdowns of the stock over the past year to get a worst-case scenario idea for any conclusions that we might reach when we trade this asset.
Over the past year $TTM is up 24.19%
The Dow Jones Industrials are up 19.32% over the past year.
S&P 500 is UP 23.6% over the last year.
Russell 1000 Small Cap is up 24.23% in the past year.
The NASDAQ is up 56.08%
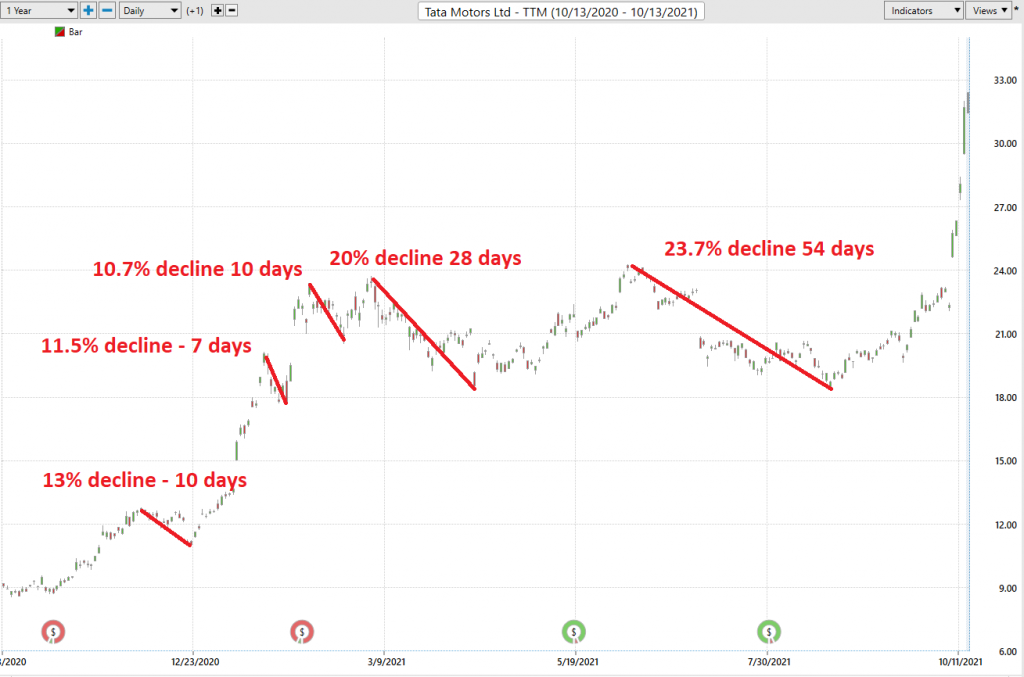
As the chart above illustrates, we had 5 declines of 10% or larger over the past year. The maximum decline was 23.7% over a period of 54 days. Three of these five declines occurred as the price encountered resistance at its previous 52 week high at $23.36.
What we can learn from this track record is that any time the stock falls 10% or more from a recent peak we should look to put this asset on our trading radar and wait for further guidance from the artificial intelligence.
The Vantagepoint A.I. Analysis
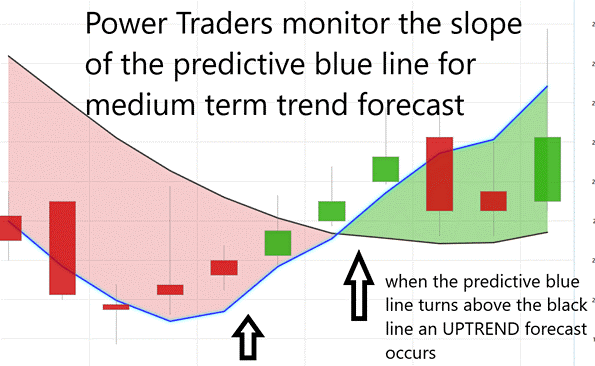
Using VantagePoint Software and the artificial intelligence, traders are alerted to trend forecasts by monitoring the slope of the predictive blue line. The black line is a simple 10 day moving average of price which simply tells you what has occurred in the market. The predictive blue line also acts as value zone where in uptrends traders try to purchase the asset at or below the blue line.
In studying the chart above pay close attention to the relationship between the black line and predictive blue line. The black line is just a simple 10 day moving average. It is calculated by taking the closing prices of the last 10 days and dividing that sum by 10. All that the black line tells you is what has occurred. It tells you where prices have been and what the average price over the last ten days is.
The predictive blue line, on the other hand utilizes that Vantagepoint patented Neural Network and Intermarket Analysis to arrive at its value. It looks at the strongest price drivers of an asset through artificial intelligence and statistical correlations to determine its value.
We will analyze the last two months for $TTM stock so that you can appreciate the power of the artificial intelligence in a real time trading situation.
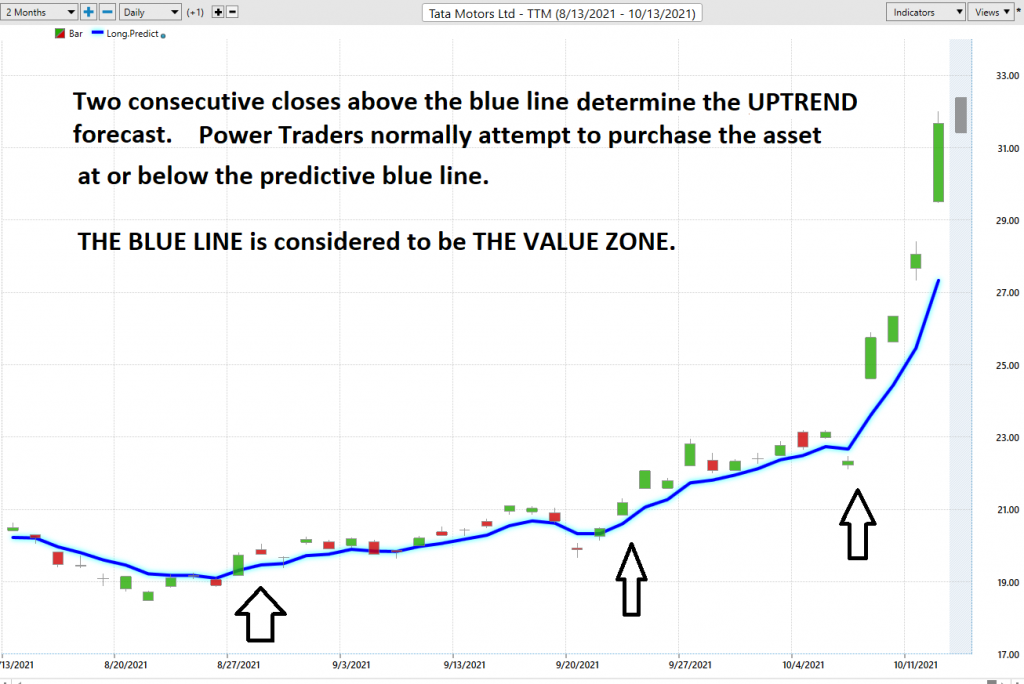
Whenever we see the predictive blue line move above the black line, we are presented with an UP-forecast entry opportunity. This is what occurred on August 30, 2021, at $19.76.
Power traders use the predictive blue line in helping to determine both the value zone as well as the trend direction. Pullbacks to or below the predictive blue line present buying opportunities at or below the value zone.
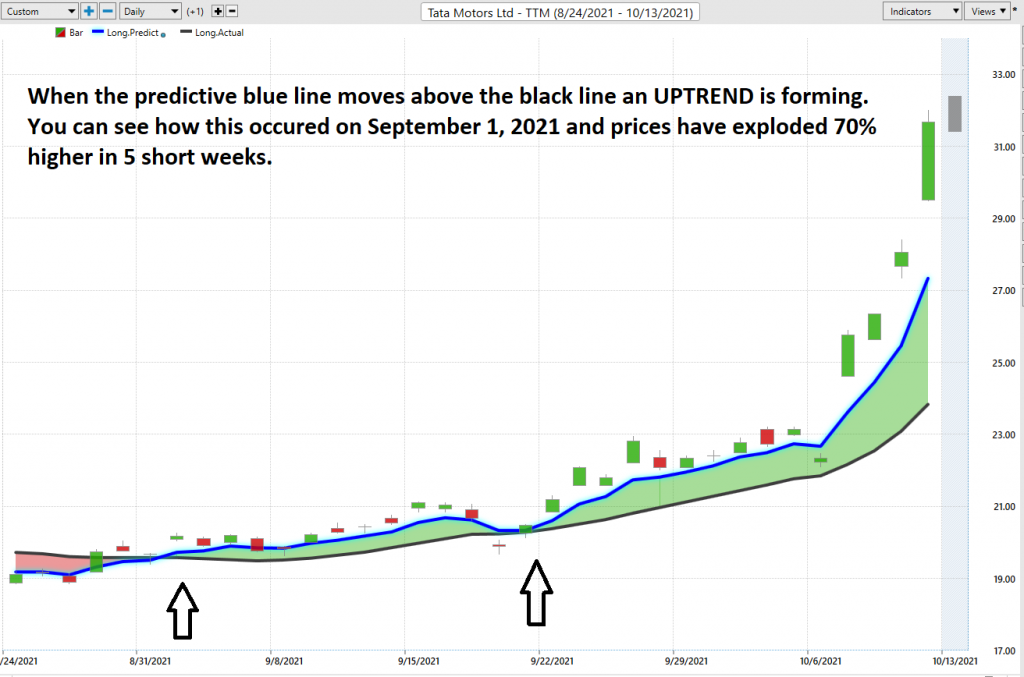
Observe how the SLOPE of the predictive blue line started moving higher a few days before its moving above the black line. Prices declined marginally into September 20th and have exploded over 70% higher in the past three weeks.
Here is what the chart of complete a.i. forecast looked like for the past two months.
Fine Tuning Entries with The Neural Net Indicator
At the bottom of the chart is the Neural Network Indicator which predicts future strength and/or weakness in the market. When the Neural Net Indicator is green it communicates strength. When the Neural Net is Red it is forecasting short-term weakness in the market.
We advocate that Power Traders cross-reference the chart with the predictive blue line and neural network indicator to create optimal entry and exit points.
A Neural Net is a computational learning system that uses a network of functions to understand and translate massive amounts of data into a desired output, consistently monitoring itself and improving its performance.
Power Traders are always looking to apply both the neural network and A.I. to the markets to find statistically sound trading opportunities. We refer to this as a “double confirmation” setup and look for the predictive blue line to slope higher and to be confirmed by the Neural Net at the bottom of the chart.
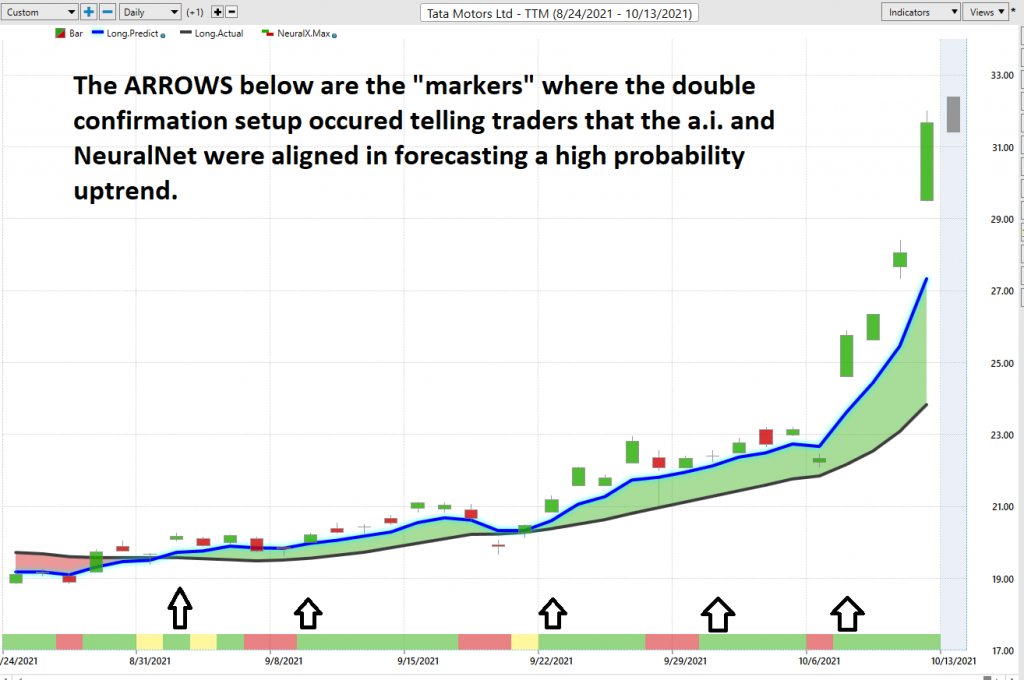
We advise Power Traders to cross-reference the predictive blue line with the Neural Net for the best entry opportunities. Observe how the slope of the predictive blue line has remained positive from the time earnings were announced.
You can see in the chart above how the Neural Net offered several opportunities of double confirmation to Power Traders, when the predictive blue line and the Neural Net aligned with the same forecast. These instances provide very high probability trading opportunities to exploit the trend.
VantagePoint Software Daily Price Range Prediction
One of the powerful features in the Vantagepoint A.I. Software which Power Traders use daily is the Daily Price Range prediction forecast.
This forecast is what permits Power Traders to truly fine tune their entries and exits into the market.
Here is the price chart of $TTM during the most recent runup featuring the Daily Price Range forecast and the Neural Net Indicator.
The $1 billion partnership and investment by TPG group was announced on October 11. Yet you can see that the daily forecast was clearly indicating higher prices for one month preceding the recent move.
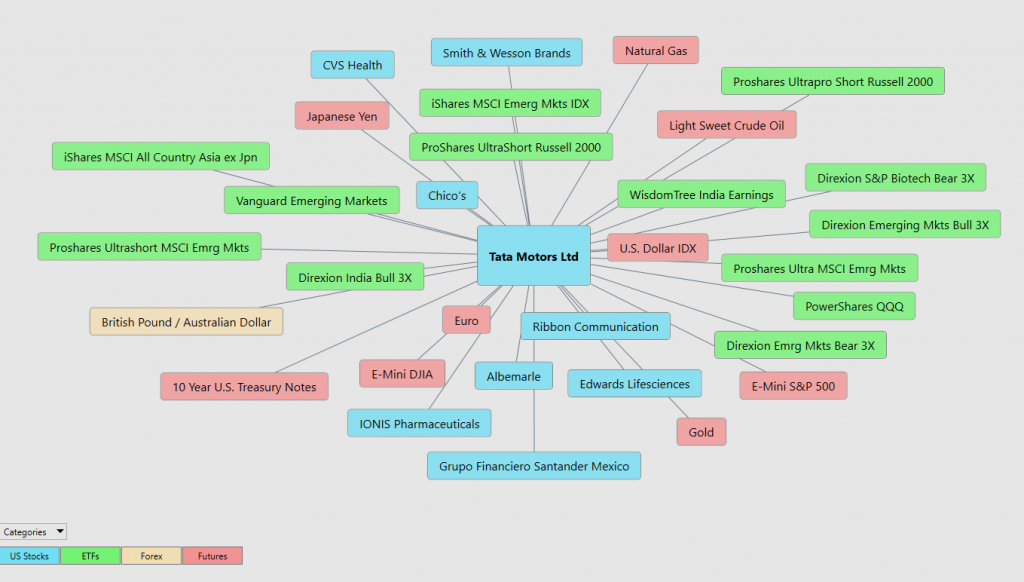
Intermarket Analysis
What makes the Vantagepoint Software truly unique is its ability to perform Intermarket analysis and to locate those assets which are most interconnected that are responsible for driving the price of $TTM higher or lower.
Studying the charts can always provide objective realities in terms of locating support and resistance levels which become very clear on a chart. But we live in a global marketplace. Everything is interconnected. The billion-dollar question for traders is always what are the key drivers of price for the underlying asset that I am trading?
These intangibles are invisible to the naked eye yet show very high statistical correlations.
Small changes in Interest rates, Crude Oil Prices, and the Volatility of the dollar amongst thousands of other variables affect the decisions companies must make to survive in these very challenging times. Trying to determine what these factors are is one of the huge problems facing investors and traders.
There is great value to be had in studying and understanding the key drivers of $TTM price action.
By doing so you can often see which ETFs are most likely acquiring $TTM as well as uncovering other industries which affect $TTM price movement.
Trading Suggestion
$TTM has had an incredible run over the past few weeks. We think that this asset can go much higher but at the present time we would expect the stock to revert back to the value zone identified by the predictive blue line.
Volatility on $TTM has escalated over the past two weeks. Our expectation is the stock will revert to the Wall Street Median Analysts estimate of $28.47 before moving higher. That represents a 15% potential decline. As mentioned earlier in this report showing the worst-case scenarios of the past year, this would be customary for $TTM based upon its history.
However, the trend is clearly UP but after a 70% move in the past 5 weeks, we do not think it is prudent to chase this asset. The high estimate for $TTM over the next 12 months is $42.78 which we think is very possible. However, it may be a choppy ride.
Momentum is very strong on this asset based upon the recent $1 billion investment from TPG. This tailwind will propel prices higher, but it will not be a straight shot.
The competition will be severe between TESLA, Ford, GM, and VW in the INDIAN marketplace, but TATA MOTORS should be able to expand its market share as the established leader. The Indian government also aspiring for 30% of new vehicle sales in the nation to be electric by 2030, Tata Motors could see a lot of success ahead if it can continue to dominate vehicle sales in India.
Our advice: Follow the a.i. trend analysis and practice good money management on all your trades. The chart looks very strong on $TTM but the risk is much higher now that prices have moved 70% in the last 5 weeks.
Options traders could look to sell PUTS and collect premium, or simultaneously could sell PUTS and buy CALLS creating synthetic long positions.
Let’s Be Careful Out There!
Remember, It’s Not Magic.
It’s Machine Learning.

IMPORTANT NOTICE!
THERE IS SUBSTANTIAL RISK OF LOSS ASSOCIATED WITH TRADING. ONLY RISK CAPITAL SHOULD BE USED TO TRADE. TRADING STOCKS, FUTURES, OPTIONS, FOREX, AND ETFs IS NOT SUITABLE FOR EVERYONE.
DISCLAIMER: STOCKS, FUTURES, OPTIONS, ETFs AND CURRENCY TRADING ALL HAVE LARGE POTENTIAL REWARDS, BUT THEY ALSO HAVE LARGE POTENTIAL RISK. YOU MUST BE AWARE OF THE RISKS AND BE WILLING TO ACCEPT THEM IN ORDER TO INVEST IN THESE MARKETS. DON’T TRADE WITH MONEY YOU CAN’T AFFORD TO LOSE. THIS ARTICLE AND WEBSITE IS NEITHER A SOLICITATION NOR AN OFFER TO BUY/SELL FUTURES, OPTIONS, STOCKS, OR CURRENCIES. NO REPRESENTATION IS BEING MADE THAT ANY ACCOUNT WILL OR IS LIKELY TO ACHIEVE PROFITS OR LOSSES SIMILAR TO THOSE DISCUSSED ON THIS ARTICLE OR WEBSITE. THE PAST PERFORMANCE OF ANY TRADING SYSTEM OR METHODOLOGY IS NOT NECESSARILY INDICATIVE OF FUTURE RESULTS. CFTC RULE 4.41 – HYPOTHETICAL OR SIMULATED PERFORMANCE RESULTS HAVE CERTAIN LIMITATIONS. UNLIKE AN ACTUAL PERFORMANCE RECORD, SIMULATED RESULTS DO NOT REPRESENT ACTUAL TRADING. ALSO, SINCE THE TRADES HAVE NOT BEEN EXECUTED, THE RESULTS MAY HAVE UNDER-OR-OVER COMPENSATED FOR THE IMPACT, IF ANY, OF CERTAIN MARKET FACTORS, SUCH AS LACK OF LIQUIDITY. SIMULATED TRADING PROGRAMS IN GENERAL ARE ALSO SUBJECT TO THE FACT THAT THEY ARE DESIGNED WITH THE BENEFIT OF HINDSIGHT. NO REPRESENTATION IS BEING MADE THAT ANY ACCOUNT WILL OR IS LIKELY TO ACHIEVE PROFIT OR LOSSES SIMILAR TO THOSE SHOWN.

