
The biggest financial story in the world today is how quickly interest rates have been rising. In a capitalist economy, the cost of money is the most important price as everything else is based on that value. Over the last 14 years, since the Great Financial Crisis, the Federal Reserve has pushed interest rates to the ZERO % level. What was promised was the low cost of money would increase economic growth. Instead, what occurred is that we created $7 dollars of new debt for every $1 of GDP growth. Now as the Federal Reserve tries to reverse course, the economy is literally between a rock and a hard place. Why? The headwinds are that the economic landscape has high inflation and low economic growth. To lessen the inflationary pressures, the Federal Reserve has raised interest rates. This is the fastest pace of interest rate increases in the last 40 years.
The adage on Wall Street is that when interest rates are low, stocks will grow. When interest rates are high, stocks will die. We did a deep dive analysis on $TBT ProShares Ultra Short Treasury on March 31, 2022. We are revisiting that analysis today.
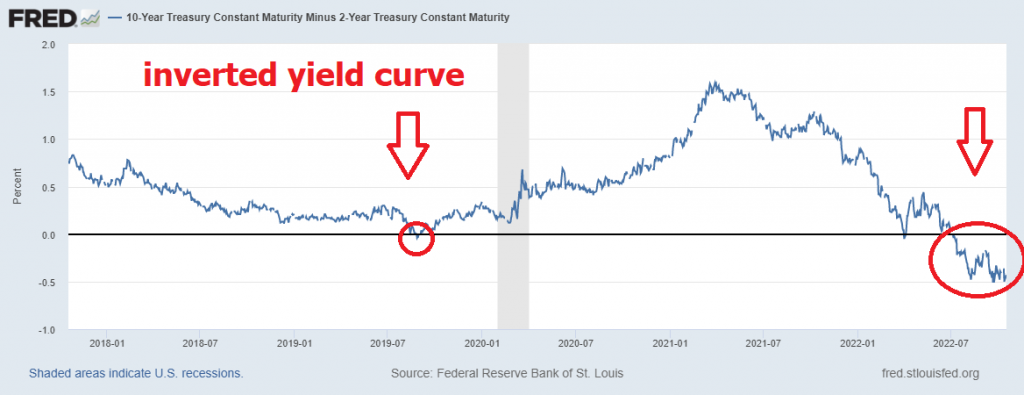
Several things have occurred which are worth noting. The yield curve which represents the cost of money across different treasury maturities has clearly remained inverted for an extended period. This historically speaking has always signaled a recession.
.

What is noteworthy in the current interest rate environment is the exponential increase in borrowing costs that has occurred. While it is true that interest rates are up a few percentage points, an educated trader needs to understand that the percentage increase represents that increased borrowing cost of funds that a business or government faces.
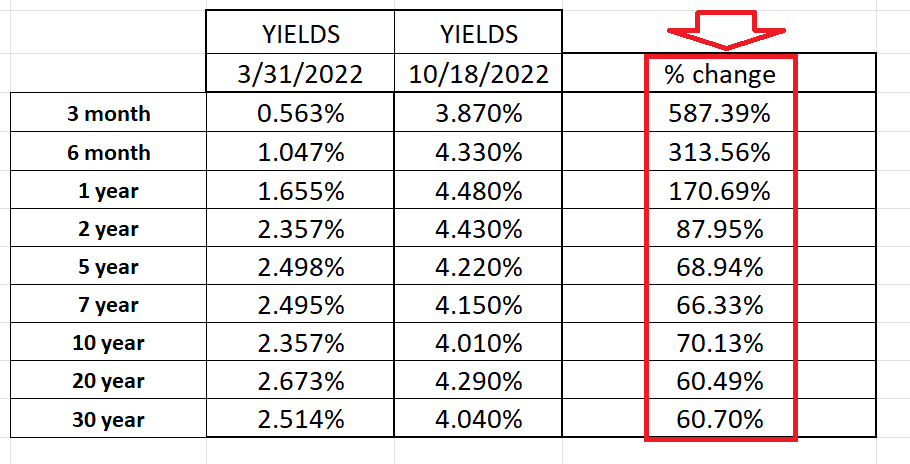
This has occurred in a period of 28 weeks!
On March 31, 2022, we wrote:
“For investors and traders this is something that you need to be aware of. In this stagflationary environment, an idea worth considering is looking at investment opportunities and trades that increase in value with higher interest rates.
Regardless of how you evaluate the Interest Rate environment, the TREND is clearly UP which means bond prices are falling.”
Today we would add to this reality by simply recognizing that the evidence is mounting that we are also experiencing a sovereign debt crisis internationally. A sovereign debt crisis occurs when a government struggles to pay its debt obligations, leading to a sharp increase in borrowing costs and often resulting in a debt default. Debt crises are usually precipitated by a combination of factors, including high levels of debt, negative real returns on government bonds, and currency debasement. As debt levels rise, investors become increasingly unwilling to hold government bonds, driving up borrowing costs and making it more difficult for the government to service its debt. At the same time, currency debasement can lead to high inflation, further eroding the value of government bonds. If left unchecked, a sovereign debt crisis can devastate an economy and lead to widespread financial instability. Since governments control the monetary printing press they rarely default. Instead, they debase the value of the currency which is a very real threat.
At present time the Federal Reserve is engaged in QT which is quantitative tightening. The Federal Reserve has been engaged in a process of quantitative easing (QE) since the 2008 financial crisis. QE involves the Fed buying government bonds and other assets in order to inject money into the economy and boost economic activity. The Fed began winding down QE in 2015, and finally ended the program in early 2019. However, rather than simply selling off the assets it acquired during QE, the Fed has been engaging in a process known as quantitative tightening (QT). QT involves slowly reducing the size of the Fed’s balance sheet by allowing bonds to mature without being replaced. This process helps to raise interest rates and reduce the money supply, which can help to prevent inflation from becoming a problem. While QT is often seen as a negative development by investors, it is a necessary step in ensuring that the economy remains healthy in the long term. The long and short of it for investors and traders is that the Fed is looking to clear its balance sheet which is composed of 9 trillion in Treasury related assets.
In this environment, we are looking at inverse Treasury ETF’s but as trading vehicles. An inverse ETF is also known as a “Short ETF” or “Bear ETF.” Traders use inverse ETFs to inversely track an underlying index or group of investments you believe will drop in value. Or they use these instruments to hedge against downside risk in similar investments you own (in a long position).
Inverse ETFs allow investors to try to make money when the market or the underlying index declines, but without having to sell anything short. The value of the ETF is directly inverse to the value of the Index it is tracking.
The largest and most successful inverse ETFs aim to deliver the opposite returns of major indexes it tracks. As interest rates rise, bond prices fall. As bond prices fall, $TBT price rise.
In this weekly stock study, we will look at and analyze the following indicators and metrics as are our guidelines to determine how to trade the $TBT ETF.
- 52-week high and low boundaries
- Best Case-Worst Case Analysis
- Vantagepoint A.I. Forecast (Predictive Blue Line)
- Neural Network Forecast
- Daily Range Forecast
- Intermarket Analysis
- Our trading suggestion
Readers may want to review an article we wrote before the Federal Reserve began their discussion of interest rate increases. It is entitled: The Great Unraveling. What Happens When You Push on A String? That article lays out a fundamental trading thesis, but we always wait for the a.i. to correlate to that opinion before we take any action in the marketplace.
52-week High-Low Chart
We are huge believers in monitoring where a stock is trading in relation to its 52-week range. Our perspective is that winners continuously make new 52-week highs, and we want to be on board for those types of moves. We pay a great deal of attention to how an asset reacts and performs in relation to its 52-week high and low boundaries.
First, let’s look at the very long-term trend. Here is a ten-year chart of $TBT.
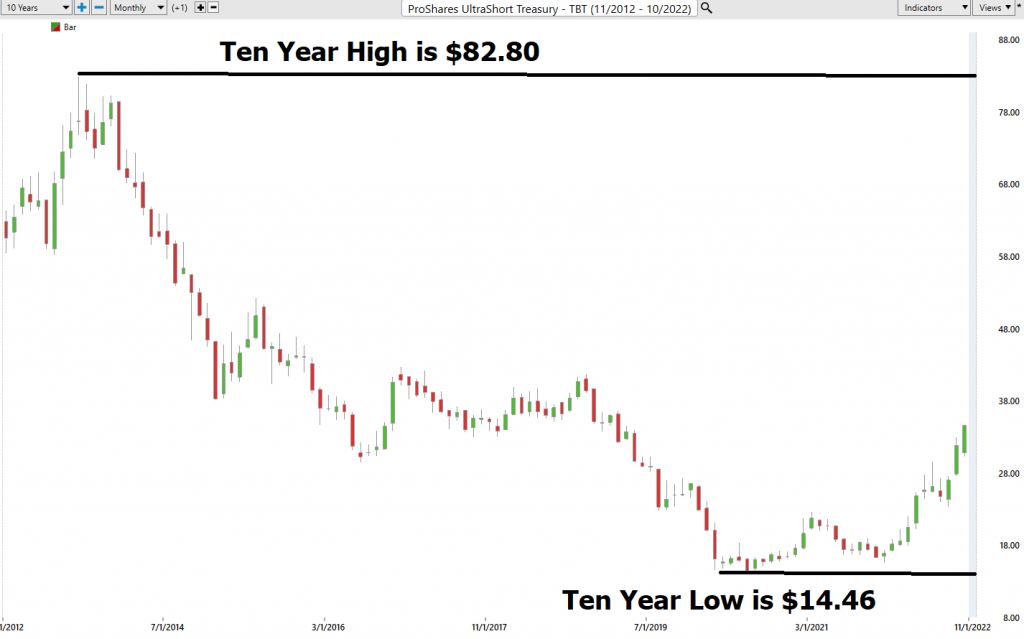
We find two points of great interest on this chart. First it bottomed during the start of the pandemic and second, it continues to make new 52-week highs which you can see on the following 52-week chart.
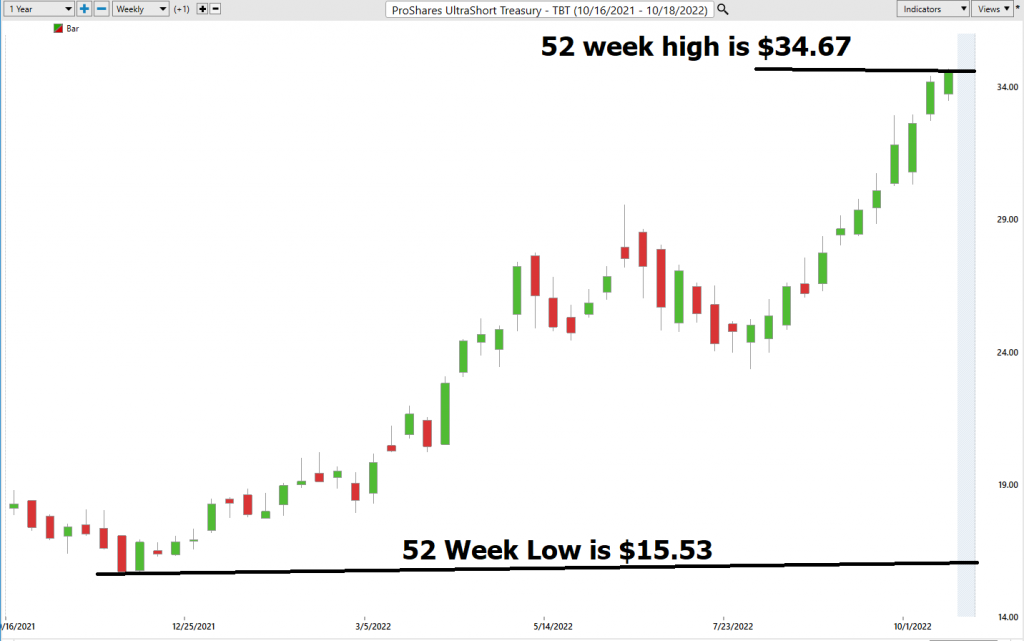
Over the last 52 weeks $TBT has traded as high as $34.67 and as low as 15.53. We expect some consolidation at this 52-week boundary, but for the last 12 weeks $TBT has continued to make new weekly highs and higher lows. Clearly this is an UPTREND. The first sign of a consolidation would be when the chart makes a lower weekly low.
What we like about this situation:
The Fed has promised to raise interest rates into the next year.
While we don’t trade on fundamentals, we have learned that when the a.i. creates an UP forecast and it aligns with what the Fed is saying they are doing, it creates a great trading opportunity.
Best Case – Worst Case Analysis
Before we move forward on a trade, we always suggest that traders look at the best case and worst-case scenarios. We suggest this primarily so that you can see real time volatility of a trade and determine beforehand if you have the stomach to handle the potential risk.
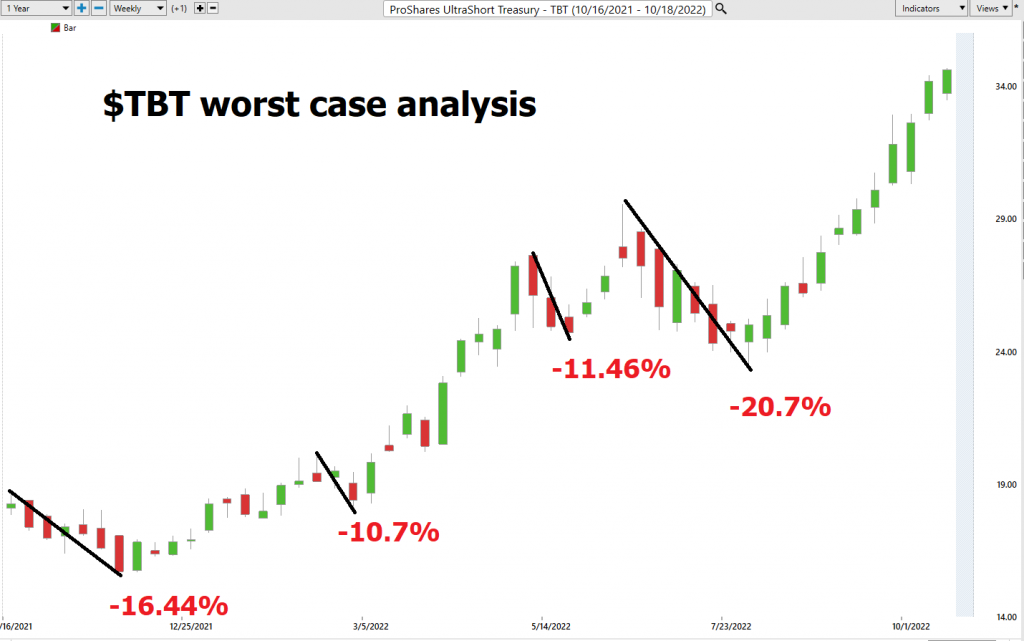
To perform this simple and practical analysis we look at a 52-week chart and look at both the uptrends and downtrends. This comparison allows us to quickly see how quickly the underlying asset rises and falls and more importantly determine which side of the market is in control.
First off here is the worst-case analysis:
Followed by the best-case analysis.
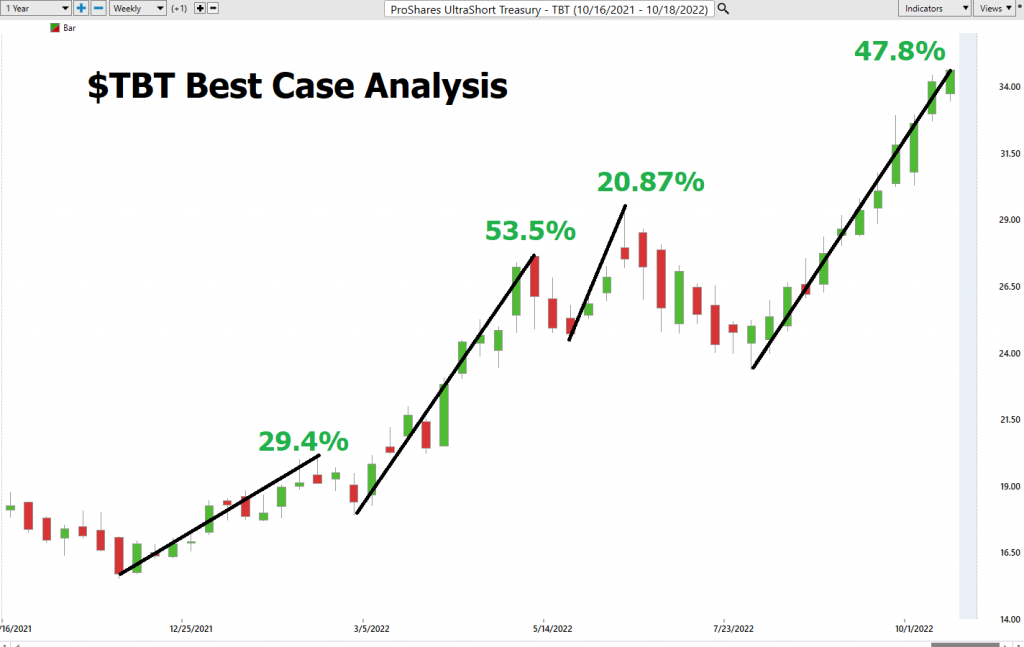
Over the past year clearly the bulls have the advantage. The largest gain is still two and a half times bigger than the largest loss.
Next, we compare $TBT to the broader stock market indexes to determine performance over the past year, month, and week.
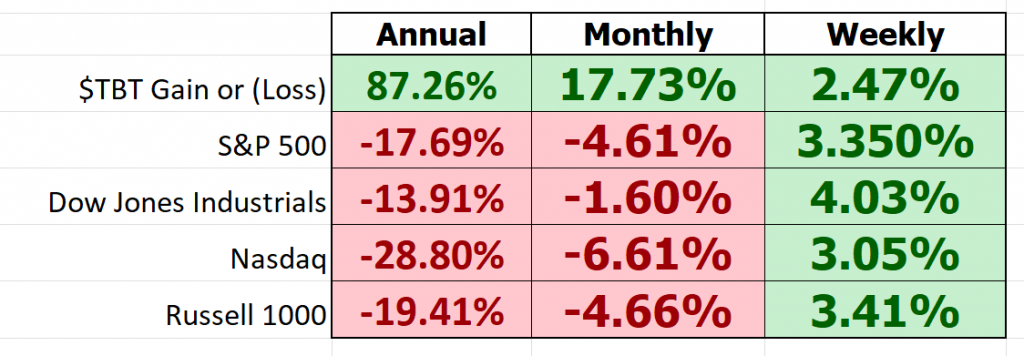
What is absolutely fascinating about this analysis is how $TBT has outperformed everything by a very wide margin.
Vantagepoint A.I. Forecast (Predictive Blue Line)
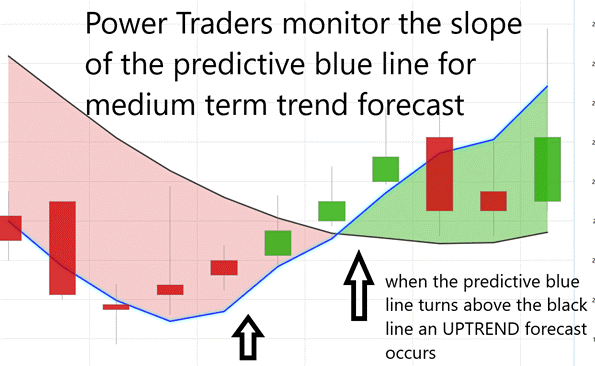
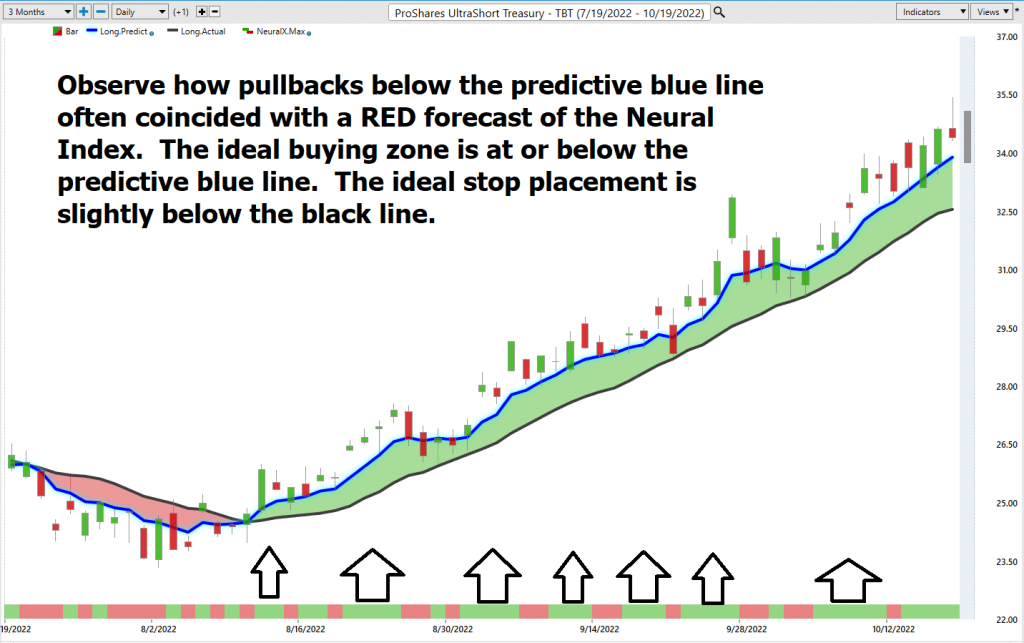
Using VantagePoint Software and the artificial intelligence, traders are alerted to trend forecasts by monitoring the slope of the predictive blue line. The black line is a simple 10 day moving average of price which simply tells you what has occurred in the market. The predictive blue line also acts as value zone where in uptrends traders try to purchase the asset at or below the blue line.
In studying the chart below pay close attention to the slope of the blue line. Anytime the blue line crosses the zero intercept is a trend signal. If the line crosses from down to up, an UP-trading opportunity exists. If the line crosses from Up to down the down trading opportunity exists.
The guidelines we abide by are as follows:
- The slope of the predictive blue line determines the trend and general direction of $TBT
- Ideally, the VALUE ZONE is determined to try and buy the asset at or below the predictive blue line.
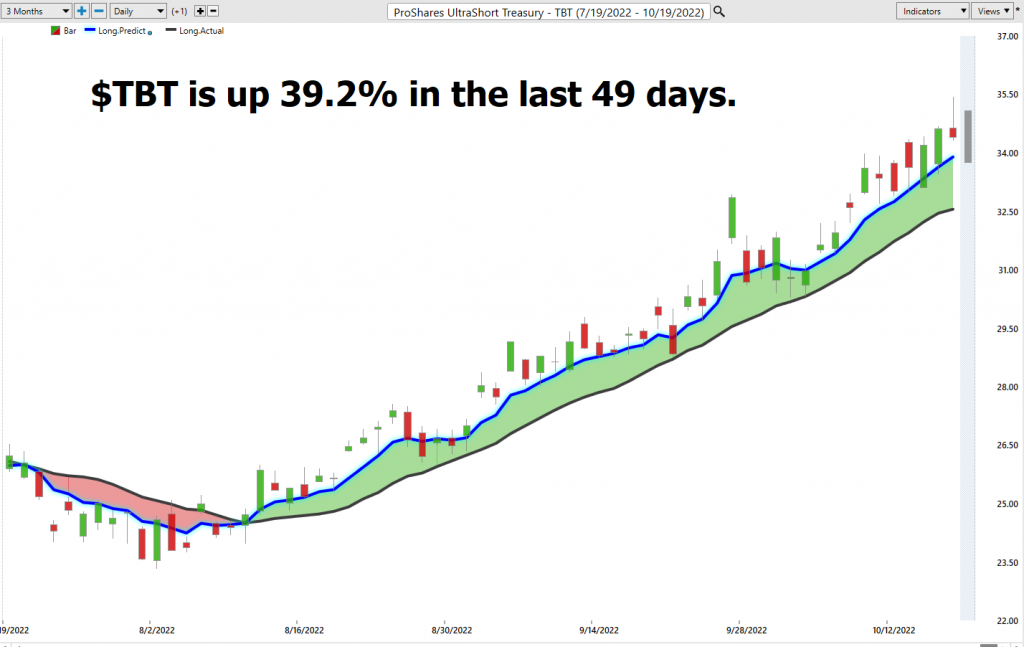
Fine Tuning Entries with The Neural Net Indicator
At the bottom of the chart is the Neural Network Indicator which predicts future strength and/or weakness in the market with a 48-to-72-hour time horizon.
A Neural Net is a computational learning system that uses a network of functions to understand and translate massive amounts of data into a desired output, consistently monitoring itself and improving its performance.
When the Neural Net Indicator is green it communicates strength. When the Neural Net is Red it is forecasting short term weakness in the market.
We advocate that Power Traders cross reference the chart with the predictive blue line and neural network indicator to create optimal entry and exit points. This provides what we refer to as the DOUBLE CONFIRMATION setup.
Power Traders are always looking to apply both the neural network and a.i. to the markets to find statistically sound trading opportunities.
A neural network is a computer system that is designed to simulate the way the human brain learns and processes information. Neural networks are often used to identify patterns in data, and they have been shown to be particularly effective at identifying correlations. For traders, this can be immensely valuable, as it can help them to quickly identify relationships between different stock prices. In addition, neural networks can also help traders to understand the statistical probability of certain market events occurring. This, in turn, can help them to make more informed trading decisions and reduce the amount of risk they take on. Ultimately, neural networks are a powerful tool that can help traders to make more informed and successful trades.
Neural networks were initially developed in the 1940s to simulate the activity of neurons in the human brain. However, it wasn’t until the late 1950s that they began to be used for practical purposes. Today, neural networks are used in a wide variety of fields, from medicine to finance. They have become particularly important in recent years as the amount of available data has increased exponentially. Neural networks are well-suited to analyzing big data sets and finding relationships that would be difficult to discern using traditional methods. With their help, traders can make better buying and selling decisions.
We always advise Power Traders to cross-reference the predictive blue line with the Neural Net for the best entry opportunities.
VantagePoint Software Daily Price Range Prediction
The purpose of all these indicators so far is to help traders stay on the right side of the right trend at the right time.
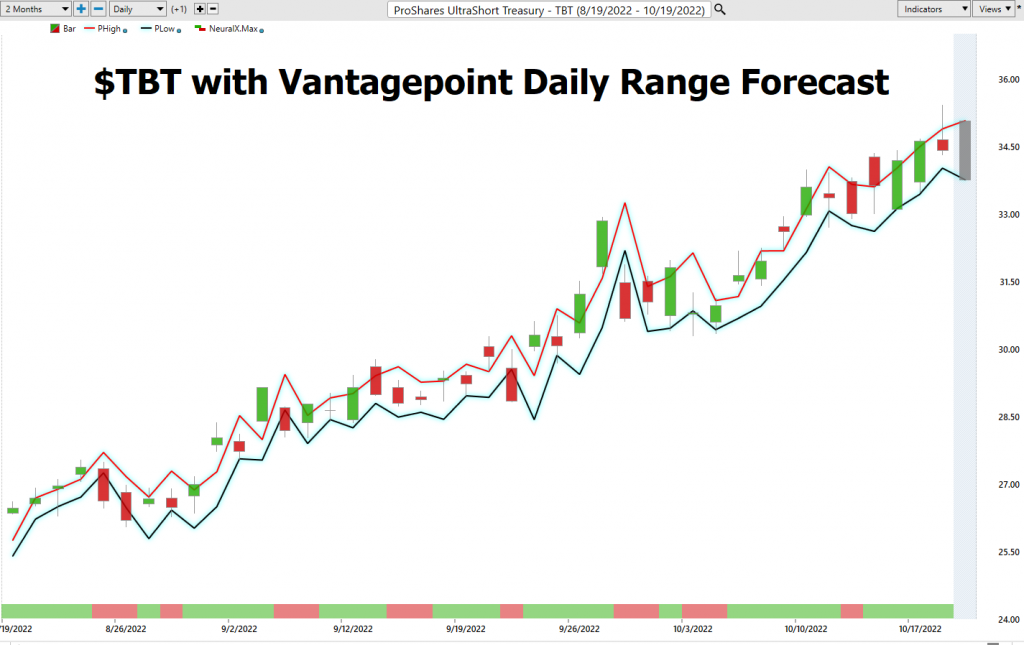
One of the powerful features in the Vantagepoint A.I. Software which Power Traders use daily is the Daily Price Range prediction forecast.
This forecast is what permits Power Traders to truly fine tune their entries and exits into the market often looking for smaller time frames and more granular trading opportunities.
Over the past year this is how the average trading ranges for $TBT have performed.
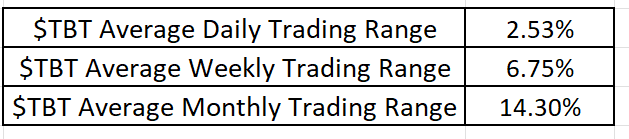
These metrics are percentages based upon the closing price for the time period measured. This analysis helps all traders genuinely understand the volatility of $TBT. Whenever, an asset moves on average 14.3% a month you want to make sure that you are on the right side of it at the right time.
Despite this impressive volatility look at how the Vantagepoint Daily Range forecast effectively helps traders navigate the price action.
Intermarket Analysis
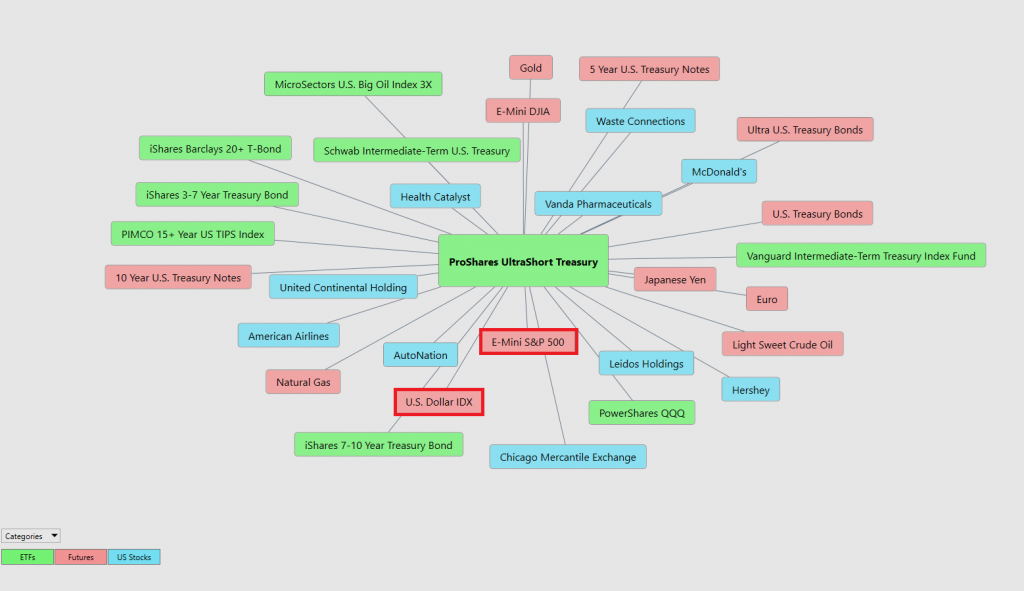
What makes the Vantagepoint Software unique is its ability to perform Intermarket analysis and to locate those assets which are most interconnected that are responsible for driving the price of $TBT higher or lower.
Intermarket analysis is the process of studying relationships between different asset classes to anticipate future price action. Traders use Intermarket analysis to identify correlations, which can be used to predict future moves in the market.
By studying these relationships, traders can get a better idea of where the market is headed.
In addition to correlations, intermarket analysis also looks at statistical data and probability. For example, traders may look at the historical variances of two asset classes to anticipate future movements. By understanding the past behavior of the markets, traders can make more informed decisions about where prices are likely to go in the future.
With the advent of big data, intermarket analysis has become increasingly important. By studying large datasets, traders can identify correlations that would have been impossible to spot before. This allows them to make more informed trading decisions and anticipate future price action more accurately.
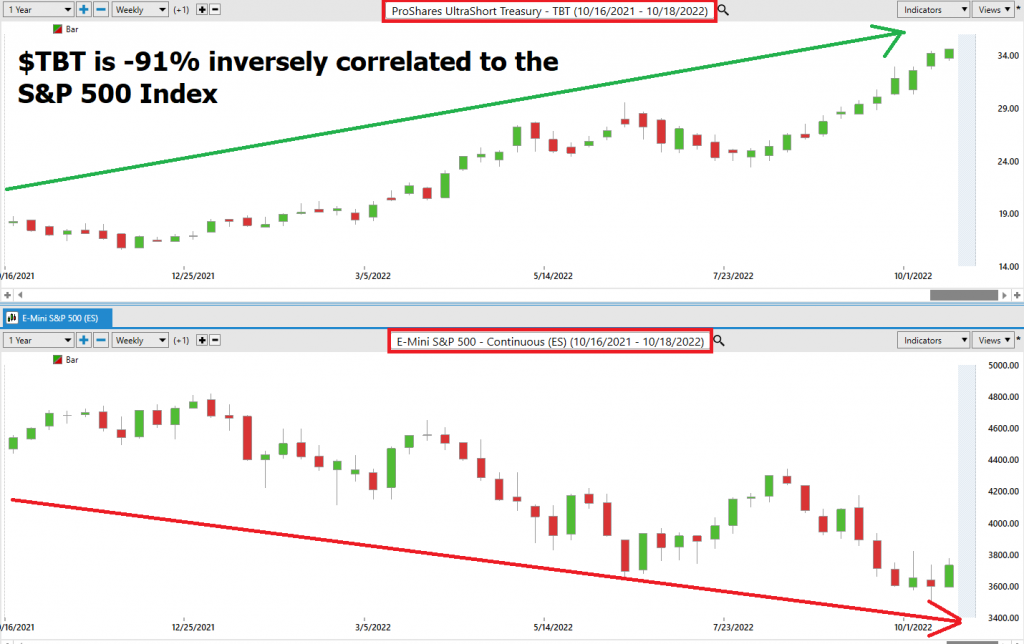
Here is a correlation worth pondering. $TBT is -91% correlated to the S&P 500 Index on the weekly chart. This means that the S&P 500 Index and $TBT will move in opposite directions 91% of the time.
While there are many different schools of thought when it comes to analyzing the financial markets, the one approach that has gained a lot of traction in recent years is Intermarket analysis. This approach focuses on identifying correlations between different asset classes and using this information to make informed decisions. While traditional market analysis often relies on historical data and statistical probabilities, Intermarket analysis takes things a step further by incorporating big data and risk analysis. As a result, this approach has become increasingly popular with both institutional and individual investors. Intermarket analysis can be a useful tool for those looking to reduce risk and improve their chances of success.
There is great value to be had in studying and understanding the key drivers of $TBT price action. This graphic presents a plethora of opportunities that can quickly be explored within the software.
This is an amazing research tool that can help you consistently uncovers future gems.
Suggestion for Traders
A few weeks ago, our blog post was on the European Energy Crisis. In that article we articulated that energy is life and that Europe moving into winter without natural gas is a disaster in the making. The threat this has on foreign Treasury debt has already begun to show itself.
There are several reasons why sovereign nations may find themselves in this situation. One common cause is debasement of the currency, which occurs when a government prints money recklessly. This causes inflation, and the value of the currency begins to decline. As a result, the country’s debt becomes more expensive to service, and it may eventually become impossible to make payments. Other causes of sovereign debt crises include economic downturns, political instability, and war. Regardless of the cause, sovereign debt crises can have serious consequences for both the country involved and the global economy.
The second reason that a potential sovereign debt crisis can be unfolding is the negative real rates of return offered by treasury instruments domestically and internationally. We have written about this phenomenon extensively. When inflation in the United States is as high as 9.1% and the 10-year Treasury is only yielding 4%, the difference is the real rate of return. Currently, in the United States this is negative which presents a negative incentive to investors to purchase government debt.
$TBT has been the top performer out of all assets that we have written about in our weekly analysis. The exponential increase in debt servicing costs does not bode well for the stock market or the economy. If this trend continues and we see no rationale for it not doing so, $TBT should continue to rise in value.
We do not know what the future holds as far as interest rates are concerned. Never let your opinion get in the way of the artificial intelligence forecast. What excites us about $TBT again is that the Treasury Bond and NOTE markets are the largest markets in the world. If the trend remains UP in rates, we want continue to look for buying opportunities of $TBT. However, should the a.i. forecast turn down we will quickly look for selling opportunities in longs and consider the short side of $TBT as well.
The opportunity for short-term trades is wonderful as $TBT is very liquid and has wide predictable trading ranges on a daily, weekly, and monthly basis.
For a world awash in debt, $TBT is a wonderful trading vehicle worthy of your consideration.
Our recommendation is to follow the A.I. trend analysis as outlined in this stock study and practice good money management on all trades.
We will re-evaluate this analysis based upon:
- 52-week high and low boundaries
- Vantagepoint A.I. Forecast (Predictive Blue Line)
- Neural Network Forecast
- Daily Range Forecast
- Intermarket Analysis
Let’s Be Careful Out There!
Remember, It’s Not Magic.
It’s Machine Learning.

IMPORTANT NOTICE!
THERE IS SUBSTANTIAL RISK OF LOSS ASSOCIATED WITH TRADING. ONLY RISK CAPITAL SHOULD BE USED TO TRADE. TRADING STOCKS, FUTURES, OPTIONS, FOREX, AND ETFs IS NOT SUITABLE FOR EVERYONE.
DISCLAIMER: STOCKS, FUTURES, OPTIONS, ETFs AND CURRENCY TRADING ALL HAVE LARGE POTENTIAL REWARDS, BUT THEY ALSO HAVE LARGE POTENTIAL RISK. YOU MUST BE AWARE OF THE RISKS AND BE WILLING TO ACCEPT THEM IN ORDER TO INVEST IN THESE MARKETS. DON’T TRADE WITH MONEY YOU CAN’T AFFORD TO LOSE. THIS ARTICLE AND WEBSITE IS NEITHER A SOLICITATION NOR AN OFFER TO BUY/SELL FUTURES, OPTIONS, STOCKS, OR CURRENCIES. NO REPRESENTATION IS BEING MADE THAT ANY ACCOUNT WILL OR IS LIKELY TO ACHIEVE PROFITS OR LOSSES SIMILAR TO THOSE DISCUSSED ON THIS ARTICLE OR WEBSITE. THE PAST PERFORMANCE OF ANY TRADING SYSTEM OR METHODOLOGY IS NOT NECESSARILY INDICATIVE OF FUTURE RESULTS. CFTC RULE 4.41 – HYPOTHETICAL OR SIMULATED PERFORMANCE RESULTS HAVE CERTAIN LIMITATIONS. UNLIKE AN ACTUAL PERFORMANCE RECORD, SIMULATED RESULTS DO NOT REPRESENT ACTUAL TRADING. ALSO, SINCE THE TRADES HAVE NOT BEEN EXECUTED, THE RESULTS MAY HAVE UNDER-OR-OVER COMPENSATED FOR THE IMPACT, IF ANY, OF CERTAIN MARKET FACTORS, SUCH AS LACK OF LIQUIDITY. SIMULATED TRADING PROGRAMS IN GENERAL ARE ALSO SUBJECT TO THE FACT THAT THEY ARE DESIGNED WITH THE BENEFIT OF HINDSIGHT. NO REPRESENTATION IS BEING MADE THAT ANY ACCOUNT WILL OR IS LIKELY TO ACHIEVE PROFIT OR LOSSES SIMILAR TO THOSE SHOWN.

