
Federal Reserve Chairman Paul Volcker is heralded as a successful Fed Chairman for several reasons. During his tenure, the United States climbed out of a stagflationary economy although a great deal of pain was involved. In addition, Volcker successfully navigated the country through a debt crisis. When he took office in 1979, inflation was at an all-time high of 11%. Volcker raised interest rates to 20% to combat inflation. This caused a recession, but it also succeeded in lowering inflation to 3% by 1983. In addition, Volcker helped to end the stagflation that had plagued the country for much of the 1970s. He did this by working with Congress to pass legislation that deregulated key industries and reformed the tax code. These reforms helped to spur economic growth and bring inflation down to more manageable levels. Finally, Volcker helped the United States navigate a debt crisis in the 1980s. He did this by working with world leaders to restructure the country’s debt obligations. As a result, the United States was able to avoid default and continue paying its debts. In sum, Paul Volcker is considered a successful Federal Reserve Chairman because he was able to lower inflation, end stagflation, and navigate the United States through a debt crisis.
Seven weeks ago, Fed Chairman Jerome Powell addressed the world in Jackson Hole on August 26th, 2022, to outline his plans for the future. Mr. Powell is faced with many of the similar challenges that Volcker faced in the early 1980’s. So much so, that in his Jackson Hole speech he concluded his speech by referencing Mr. Volcker’s challenges. He stated:
“The successful Volcker disinflation in the early 1980s followed multiple failed attempts to lower inflation over the previous 15 years. A lengthy period of very restrictive monetary policy was ultimately needed to stem the high inflation and start the process of getting inflation down to the low and stable levels that were the norm until the spring of last year. Our aim is to avoid that outcome by acting with resolve now.
These lessons are guiding us as we use our tools to bring inflation down. We are taking forceful and rapid steps to moderate demand so that it comes into better alignment with supply, and to keep inflation expectations anchored. We will keep at it until we are confident the job is done.”
Fed watchers tend to dissect every word of a Fed Chairmans presentation to understand its ramifications and intent. What is surprising about Powell’s speech is the closing. “We will keep at it until we are confident the job is done.” The phrase ‘KEEPING At It’ is the tile of Paul Volcker’s memoirs which were published in 2018.
Could this reference just be a coincidence? Or is Jerome Powell, signaling that like Volcker he has to break inflation by both raising interest rates and simultaneously reducing the money supply?
I have been thinking about this question quite a bit lately. When Volcker began his tenure at the Fed in August 1979 the Fed Funds rate was 10.94%. So, interest rates were 770% higher than when Jerome Powell took over as Fed Chair.
When Volcker raised rates to 20% the economy contracted severely. But what has been bothering me as of late, is the percentage increase from 10.94% to 20% represents an 82% increase in the base cost of funds. Granted this is a huge move but it pales in comparison to what Jerome Powell is having to confront.
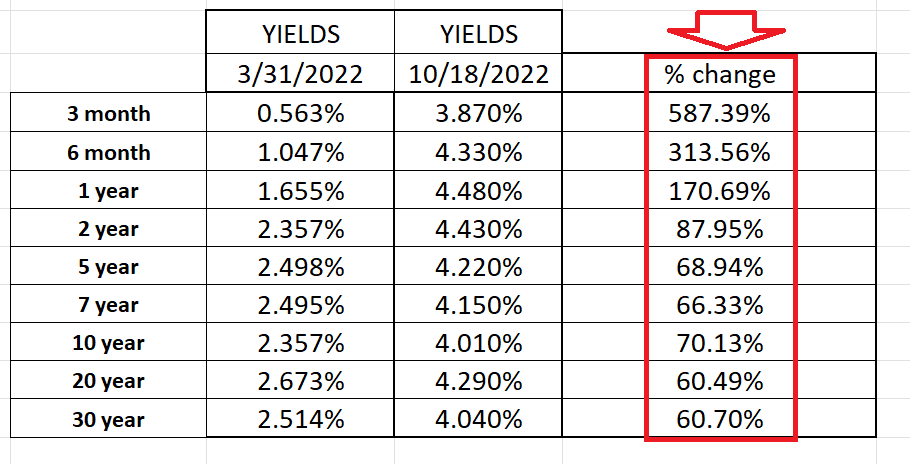
Look at the following table which illustrates the net and percentage change in yields on the yield curve over the last 28 weeks. Since rates were pushing the zero boundary, the percentage increase in borrowing costs is exponential and the consequences of this are felt throughout the world since the U.S. dollar is the reserve currency in how everyone keeps score.
The following chart from the St. Louis Fed highlights this issue quite well.
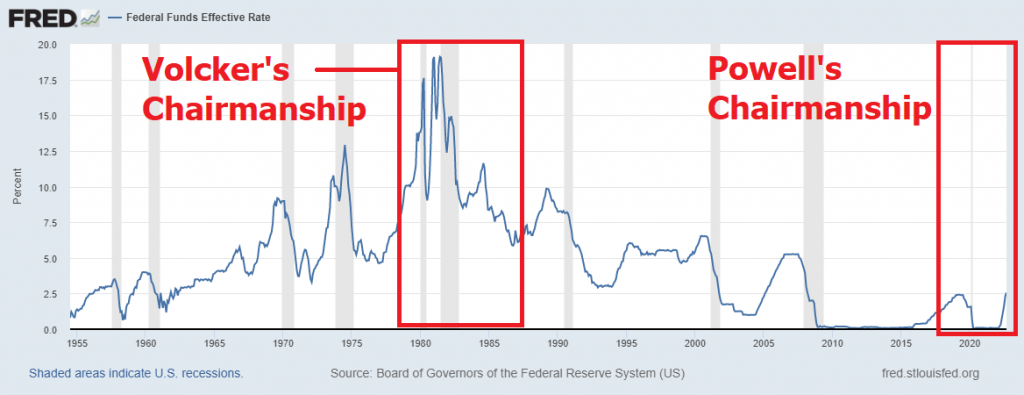
While Mr. Powell only began raising interest rates this year, the percentage increase in borrowing costs already far exceeds anything that Paul Volcker had to deal with.
When I read the headline news, what I have noticed over the last several months is that this type of exponential increase in borrowing costs is wreaking havoc on the already fractured international sovereign debt market and currency markets.
One of my favorite questions for the past couple of decades has been, “Is monetary inflation the solution or the problem?” This question offers quite a powerful education in how Central Banks manipulate markets in the name of the greater good and create perceptions of “cheap” “free” money while distorting how our financial, political, social and market systems function.
To illustrate this idea let’s look at the pension system. Since the Great Financial Crisis, the Fed’s game plan was to push interest rates to the zero boundary to stimulate the economy. The idea was that all this cheap money will cause an economic boom which could be taxed and would be the solution to all of our economic ailments. But if we isolate one small subsection of the economy call retirement obligations, we immediately can recognize how a zero-interest rate policy is completely counter to its long-term survival. According to actuaries and financial analysts the pension system requires a 7% yield to remain viable. In other words, for pensions to be effectively fulfilled the investments that a pension fund must generate a 7% yield or the fund risks insolvency. Where are fund managers going to find Treasury Instruments that will yield 7%?
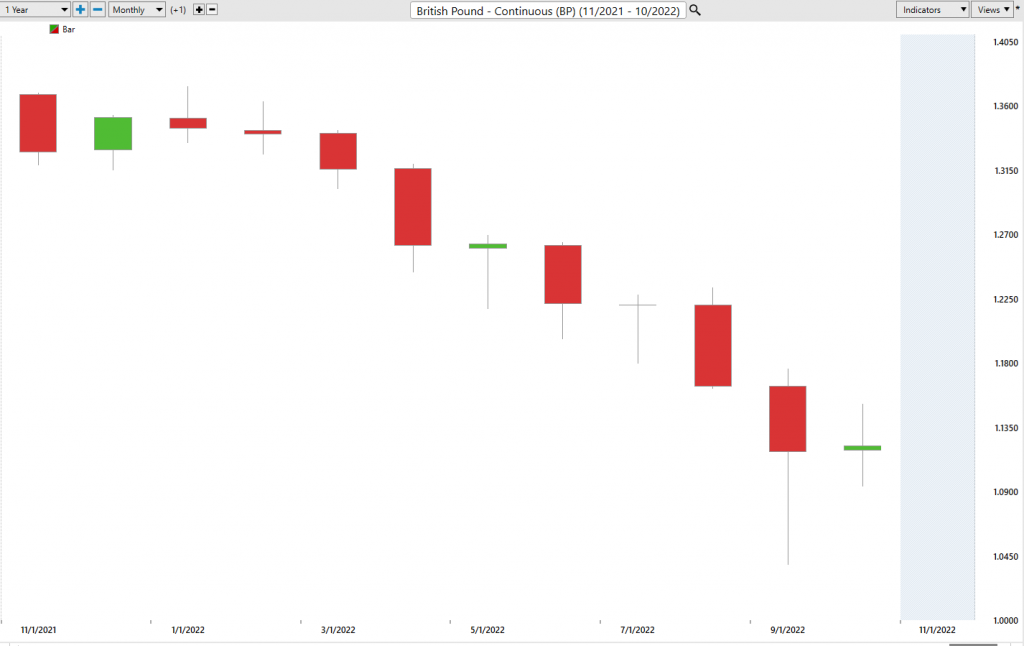
Why is this important? Let me show you a chart of the British Pound and explain what it means to the international marketplace. As you can see from the chart below the British Pound had sold off as much as 24% from its highs. This has all occurred in the last 12 months. What is noteworthy about this type of selloff is what occurred in the GILT market last month.
A British GILT is a debt obligation issued by the British government. The term “GILT” stands for “government-issued long-term debt.” GILTs are typically issued with maturities of 5 years or more. Interest on GILTs is paid semi-annually. GILTs are normally issued in denominations of £100, £500, and £1,000. Investors in GILTs include institutional investors such as pension funds and insurance companies, as well as individual investors. GILTs are considered to be among the safest investments available since they are backed by the full faith and credit of the British government. The yield on a 2-year GILT is 1%. Inflation in Britain was reported yesterday at 10.1%. The difference between your yield at 1% and inflation represents your real rate of return which in this instance is negative – 9.1%. Who do you know that wants to lock in a guaranteed loss of 9.1% on their capital? Particularly when pension funds need a positive 7% yield to survive?
What happened in the GILT market is noteworthy. Pension fund managers were caught flat-footed using 3 to 1 margin to keep their pension obligations viable. In other words, they were leveraged and chasing yield. As GILT prices fell, they all received margin calls forcing them to post more cash or collateral which they did not possess. This forced the Bank of England to step in and purchase 65 billion worth of GILTS to stem the selling pressure in the market. Had the Bank of England not stepped in the UK’s pension system would have become insolvent.
The Bank of England’s printing press has had to become the buyer of last resort for a collapsing bond market Bubble.
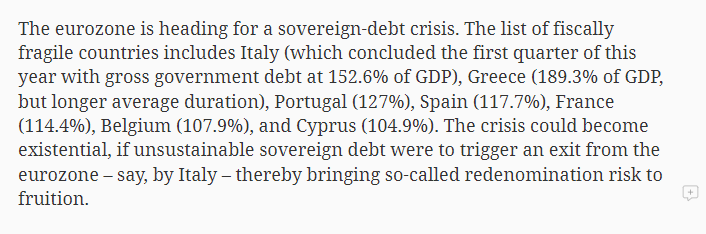
Historically, we often only recognize sovereign debt crisis with the benefit of hindsight. But I am going to go out on a limb and state that the entire Eurozone is facing a similar predicament at this moment. Keep in mind that the entire Eurozone is facing an energy crisis this winter since they do not have enough natural gas to even heat their homes or industries.
A sovereign debt crisis is a situation in which a country is unable to pay its bondholders and is therefore forced to default on its debt obligations. Sovereign debt crises have become increasingly common in recent years, with several major economies experiencing severe economic hardships as a result. The most notable examples include the sovereign debt crisis in Greece, which began in 2010 and caused the country to default on its debt obligations, and the sovereign debt crisis in Argentina, which began in 2018 and led to a sharp decline in the country’s currency value. While sovereign debt crises can have devastating effects on economies, they can also be addressed and hopefully resolved through a variety of measures, such as restructuring sovereign debt obligations, imposing austerity measures, and providing financial assistance from international organizations.
It is unfortunate to say that the dominos of insolvent foreign debt are aligning. What happened in the UK last month is a microcosm of what is happening around the world.
Citizens are witnessing a crisis of confidence in a financial system where the printing press has run amok and destroyed the value and definition of money. According to the World Bank at least one dozen developing economies are unable to service their debt.
A stagflationary economy is one characterized by high inflation and low economic growth. This combination can be difficult to navigate, but there are still investment opportunities available. While most investors focus on making money during periods of rising prices, savvy traders make money by capitalizing on falling prices as well. A bear market is defined as a period when the stock market is in decline, and down trends can occur for a variety of reasons, including economic recession, high interest rates, or political turmoil. While bear markets can be difficult for investors who are long on stocks, they present opportunities for traders who are willing to explore the short side of the market.
In a bear market, prices tend to fall across the board, giving rise to several bankruptcies and distressed companies. By taking a short position in these companies, traders can profit from falling prices. In addition, bear markets often provide opportunities to buy stocks at bargain prices. By taking advantage of these downtrends, traders can turn crisis into opportunity. When prices fall in any asset whether it be a stock, bond, forex, or commodity this can create tremendous opportunity for traders. Over the past year many of the NASDAQ high flying stocks of 2020 and 2021 are down over 80%.
It is important to differentiate between a long-term macro investor and a short-term trader. A macro investor is someone who takes a long-term view of the market and focuses on macroeconomic analysis. They try to identify big-picture trends that will affect the overall direction of the market and make investment decisions accordingly. In contrast, a short-term trader is focused on trying to make money from short-term price movements. They use their analytical tools to identify small changes in the market that they can take advantage of for a quick profit. While macro investors and short-term traders both aim to make money from price fluctuations, their approaches are quite different. macro investors focus on long-term trends while short-term traders focus on small, more immediate changes.
We often do not understand why something is occurring but that does not mean that we cannot take advantage of it.
Remember What’s Important.
Price is the only thing that matters when we are trading. It is what can make you wealthy or decimate your account. Everything else is just noise.
Are you capable of finding those markets with the best risk/reward ratios out of the thousands of trading opportunities that exist?
Knowledge.
Useful knowledge.
And its application is what A.I. delivers.
Isn’t that what we all want from the markets? Consistency.
So, imagine what might your portfolio would look like today had you applied artificial intelligence to it five years ago.
Artificial intelligence trend following software is the best investment a trader can make because it provides the edge in trend recognition.
In a world of massive distortions causes by massive money supply campaigns what is critically important is TREND ANALYSIS.
A trend is simply defined as the direction of price over time and recognizing where the strongest and weakest trends are essential for making money in the markets.
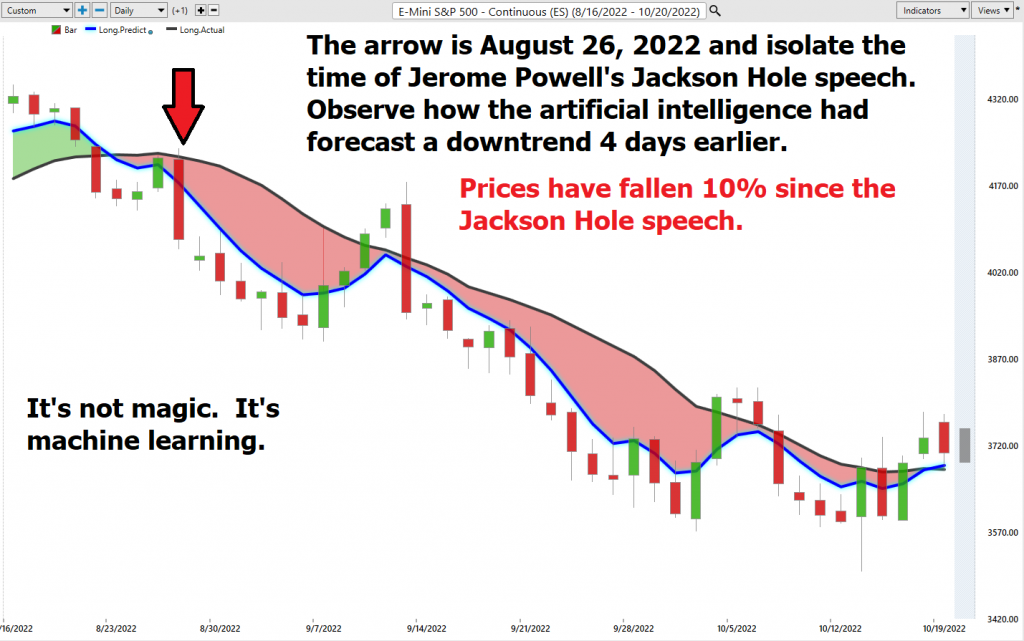
Let me show you how effective artificial intelligence is by referring to the Jackson Hole Speech which Jerome Powell made. The chart below paints the picture far better than anything I could ever write.
As I often comment to traders, “everyone is entitled to their own opinion, but never let your opinion get in the way of an artificial intelligence trend forecast.”
Pay attention. I might be completely wrong in my assessment that we are looking at an international sovereign debt crisis. But now the money is being made on the short side of the Treasury market and until the a.i. forecast changes, this BEAR looks hungry! Don’t let him eat your portfolio.
See for yourself how a machine-based learning software makes it easier to find statistically solid trends with less risk.
It’s important that you find out more and discover why artificial intelligence keeps traders on the right side of the trend at the right time.
Join us for a FREE, Live Training. We’ll show you at least three stocks that have been identified by the A.I. that are poised for big movement… and remember, movement of any kind is an opportunity!
Discover why artificial intelligence is the solution professional traders go-to for less risk, more rewards, and guaranteed peace of mind.
Intrigued? Visit with us and check out the A.I. at our Next Free Live Training.
Discover why Vantagepoint’s artificial intelligence is the solution professional traders go-to for less risk, more rewards, and guaranteed peace of mind.
It’s not magic. It’s machine learning.
Make it count.

IMPORTANT NOTICE!
THERE IS SUBSTANTIAL RISK OF LOSS ASSOCIATED WITH TRADING. ONLY RISK CAPITAL SHOULD BE USED TO TRADE. TRADING STOCKS, FUTURES, OPTIONS, FOREX, AND ETFs IS NOT SUITABLE FOR EVERYONE.
DISCLAIMER: STOCKS, FUTURES, OPTIONS, ETFs AND CURRENCY TRADING ALL HAVE LARGE POTENTIAL REWARDS, BUT THEY ALSO HAVE LARGE POTENTIAL RISK. YOU MUST BE AWARE OF THE RISKS AND BE WILLING TO ACCEPT THEM IN ORDER TO INVEST IN THESE MARKETS. DON’T TRADE WITH MONEY YOU CAN’T AFFORD TO LOSE. THIS ARTICLE AND WEBSITE IS NEITHER A SOLICITATION NOR AN OFFER TO BUY/SELL FUTURES, OPTIONS, STOCKS, OR CURRENCIES. NO REPRESENTATION IS BEING MADE THAT ANY ACCOUNT WILL OR IS LIKELY TO ACHIEVE PROFITS OR LOSSES SIMILAR TO THOSE DISCUSSED ON THIS ARTICLE OR WEBSITE. THE PAST PERFORMANCE OF ANY TRADING SYSTEM OR METHODOLOGY IS NOT NECESSARILY INDICATIVE OF FUTURE RESULTS. CFTC RULE 4.41 – HYPOTHETICAL OR SIMULATED PERFORMANCE RESULTS HAVE CERTAIN LIMITATIONS. UNLIKE AN ACTUAL PERFORMANCE RECORD, SIMULATED RESULTS DO NOT REPRESENT ACTUAL TRADING. ALSO, SINCE THE TRADES HAVE NOT BEEN EXECUTED, THE RESULTS MAY HAVE UNDER-OR-OVER COMPENSATED FOR THE IMPACT, IF ANY, OF CERTAIN MARKET FACTORS, SUCH AS LACK OF LIQUIDITY. SIMULATED TRADING PROGRAMS IN GENERAL ARE ALSO SUBJECT TO THE FACT THAT THEY ARE DESIGNED WITH THE BENEFIT OF HINDSIGHT. NO REPRESENTATION IS BEING MADE THAT ANY ACCOUNT WILL OR IS LIKELY TO ACHIEVE PROFIT OR LOSSES SIMILAR TO THOSE SHOWN.

