
Two and a half months ago we featured Boston Beer in our Stock of the Week analysis. You can find our original analysis here. We are returning to take another look at Boston Beer for several reasons:
- In the past month it has started moving completely counter to the broader stock market indexes.
- Volatility is increasing in the stock which presents great opportunity for options traders.
- The artificial intelligence has been red hot in capturing short term swing trades lasting a few weeks in duration.
The conclusion which we reached in our original analysis is posted below for your convenience. We stated:
Several additional Wall Street analysts have jumped into covering Boston Beer ($SAM) and their analysis is very divergent in their long-term forecasts. In other words, their opinions are creating larger than normal volatility which creates short term trading opportunities for traders tuned in to the price action.
Contributing to the volatility on the positive front is that Earnings are forecasted to grow by 21.6% over the next year. On the negative front, insiders at Boston Beer have recently been selling $95,800 shares of the stock in the last 3 months, which is offsetting any long-term bullish prospects.
The beer company’s results from a recent earnings call were dismissive in that it barely earned a profit at all in 2021, even factoring its more stable businesses such as Sam Adams. This was an extremely disappointing miss; analysts had seen this particular brand making up to $25 per share last year and instead they only broke even with no growth whatsoever! Needless to say stock prices plumbed new depths after diving from over 1k USD down into 300 Range. It has been rangebound for the last several months and fundamentals have not improved.
In this weekly stock study, we will look at and analyze the following indicators and metrics which are our guidelines which dictate our behavior in deciding whether to look for opportunities to buy, sell, or stand aside on a particular stock. We will also look at specific options trading tactics that develop meaningful risk/reward ratios in the current trading environment.
- Wall Street Analysts’ Estimates
- 52-week high and low boundaries
- Vantagepoint A.I. Forecast (Predictive Blue Line)
- The Best Case – Worst Case Scenarios
- Neural Network Forecast
- Daily Range Forecast
- Intermarket Analysis
- Our trading suggestion
We don’t base our decisions on things like earnings or fundamental cash flow valuations. However, we do look at them to better understand the financial landscape that a company is operating under.
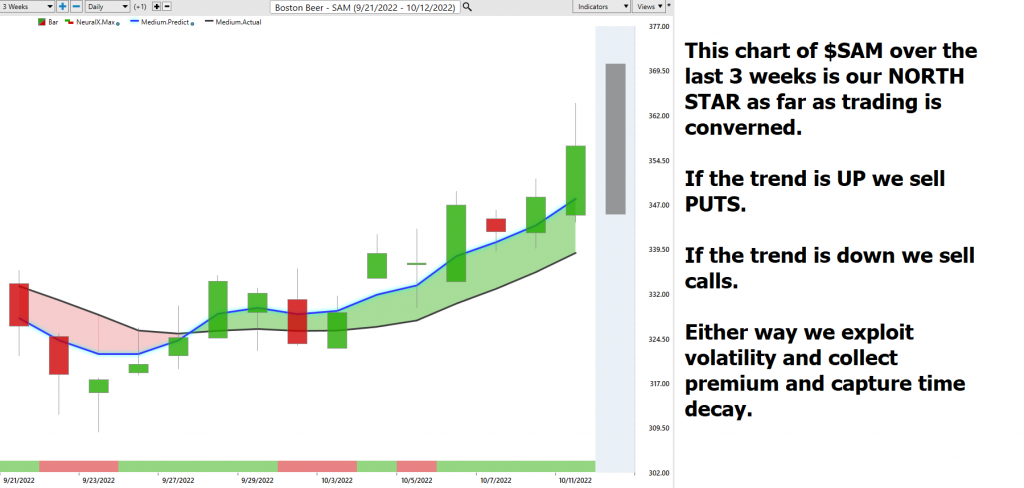
In this analysis we will focus on finding opportunities in the options markets. Trading $SAM requires a great deal of money if you are trading the underlying stock. With $SAM shares trading around $356, a total of $35,600 would be required to trade 100 shares of stock. This can be prohibitive to the average trader. Instead, we like looking at opportunities in the options markets looking at trades which create the opportunity to capture time decay in the last 2 weeks of an options life cycle.
Our interest is targeted at selling put options in an up trending market and selling call options in a down trending market. We discuss this strategy in detail in these articles: In an up-trending market, option premium decay works in the favor of the option seller because the option’s strike price is moving away from the current market price, causing the option to lose value. The option premium is the amount of money that the option buyer pays to the option seller for the right to purchase or sell an underlying asset at a specified price on or before a certain date. The option premium decay is greatest in the
last 30 days before expiration. Therefore, selling put options in an up-trending market is beneficial because the option will lose value due to time decay.
Likewise, call option sellers often benefit from option premium decay in a down trending markets. As the underlying security’s price decreases, the option premium also generally decreases – all else being equal. This is because the option is more likely to expire worthless if the price is moving away from the strike price. By selling call options in a down trending market, option sellers can potentially profit from both option premium decay and market fluctuations.
Traders can exploit time decay when trading options by collecting premium and being very aware of the trend as dictated by the artificial intelligence. $SAM has monthly options expirations. The nearby October Options series expire on October 21st. That is only 9 days away. The opportunity for selling option premium here is to look at out of the money options are divide that premium amount by 9 days.
Analysts Ratings
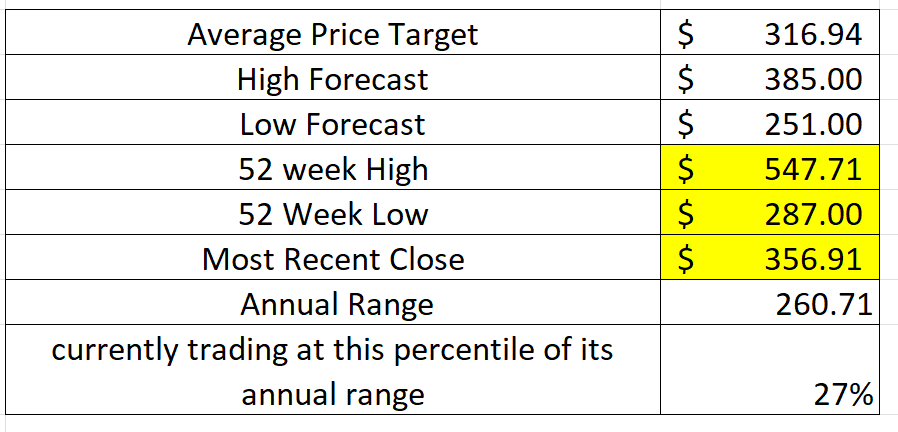
Based on 10 Wall Street analysts offering 12-month price targets for Boston Beer in the last 3 months. The average price target is $316.94 with a high forecast of $385.00 and a low forecast of $251.00. The average price target represents a -11.20% change from the last price of $356.91.
At present time Wall Street is telling us that the smartest minds who track $SAM 24/7 think that $SAM is currently overvalued.
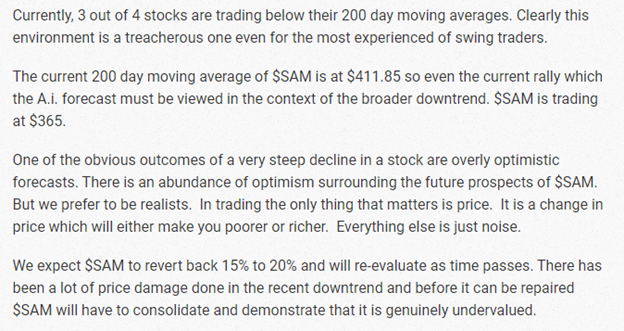
52-week High-Low Chart
Looking at the Long-Term chart of $SAM provides us with the 52-week high and low boundaries.
Over the past year we have seen $SAM trade as low as $287 and as high as $547.71.
The 52-week chart makes its recent rally look like a minor blip in the long-term trend.
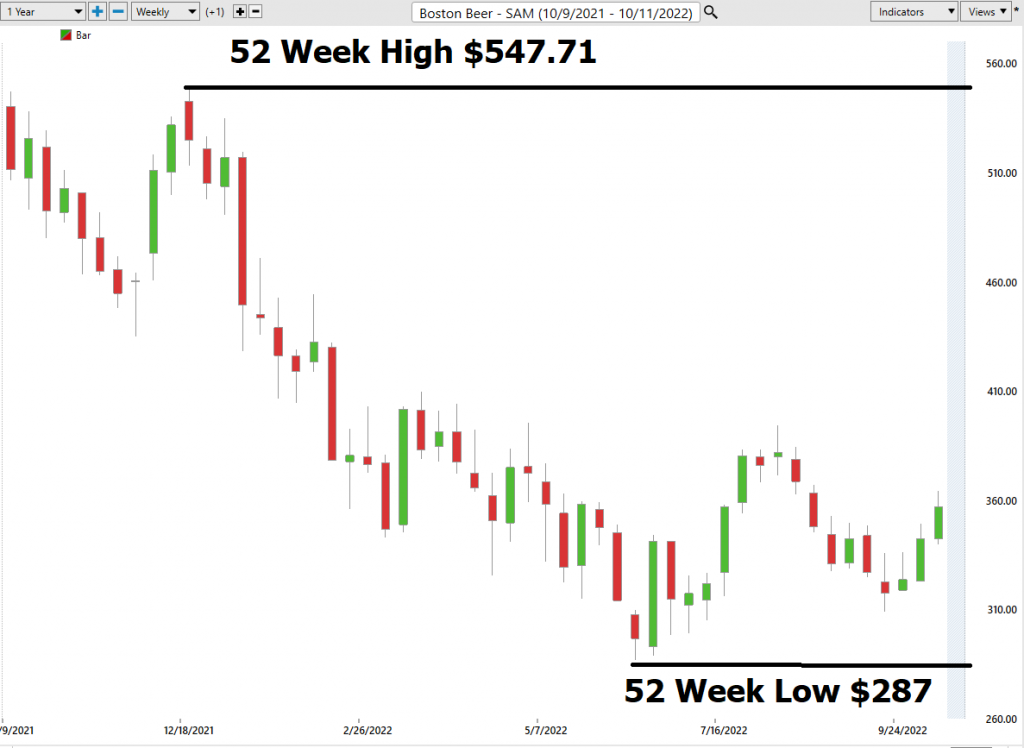
If we zoom out to see how the company has performed over the last 10-year period, we see a tremendous boom followed by the current downtrend which has resulted in $SAM currently trading 71% lower than its all-time high.
We like to study the 52-week chart before doing anything else just so that we can get a feel for how the company has performed over the past year and compare that to other opportunities and the broader market indexes.
Place these boundaries on your radar and pay attention.
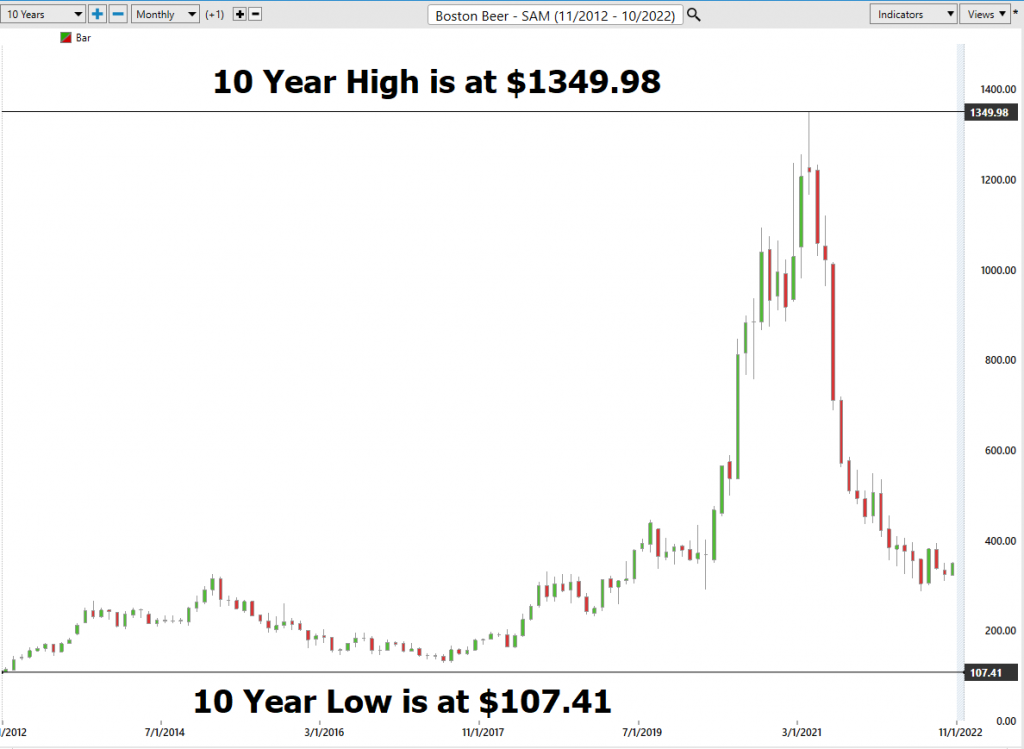
Best Case – Worst Case Analysis
The charts below show the numerous sharp declines and rallies that $SAM had over the past year.
When it comes to trading stocks, volatility is often seen as a bad thing. However, for savvy traders, high volatility can present a great opportunity. That’s because when prices are volatile, they tend to move in sharp swings – which can be profitable for traders who know how to take advantage. While there is certainly more risk involved in trading high volatility stocks, there is also potential for greater rewards as long as risk is effectively managed. While high volatility stocks may not be suitable for everyone, they can be great swing trading candidates for traders who are willing to take on a little extra risk.
In reviewing the charts below observe the magnitude of the short term swings.
This is extremely high volatility and we would advise traders who are unfamiliar with volatile markets to steer clear. However, Power Traders will use these sudden sharp declines and monitor the a.i. and forecasted daily trading ranges for short term swing trading opportunities.
The declines ranged from 20% and as much as 25%. The stock falls much faster than it rises.
Market rallies ranged from 17% to 37%.

What we can learn from this basic worst-case analysis is that $SAM could EASILY move plus or minus 25% in a matter of weeks. With the power of artificial intelligence these short-term swings are ideal for seasoned traders who have learned how to embrace this type of risk.
This price volatility is ideal for SWING traders who can exploit the trend.
Next, we compare $SAM to the performance of the broader stock market indexes.
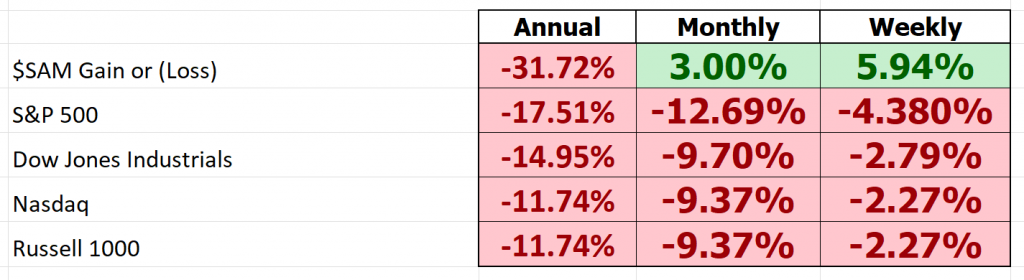
In doing this analysis we can see that $SAM has been much more volatile than the broader market. It has outperformed the broader on the front end, (weekly and monthly, but it has performed 2-3 times worse than the broader market on an annual basis.
Lastly, we post the important benchmarks that we cross reference with the artificial intelligence analysis.
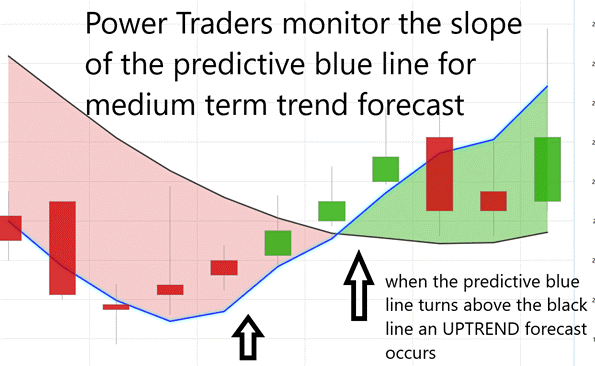
Vantagepoint A.I. Forecast (Predictive Blue Line)
The guidelines we abide by are as follows:
- The slope of the predictive blue line determines the trend and general direction of $SAM
- Ideally, the VALUE ZONE is determined to try and buy the asset at or below the predictive blue line.
Here is a snapshot of the opportunities that the a.i. has focused on in the past months for Power Traders.
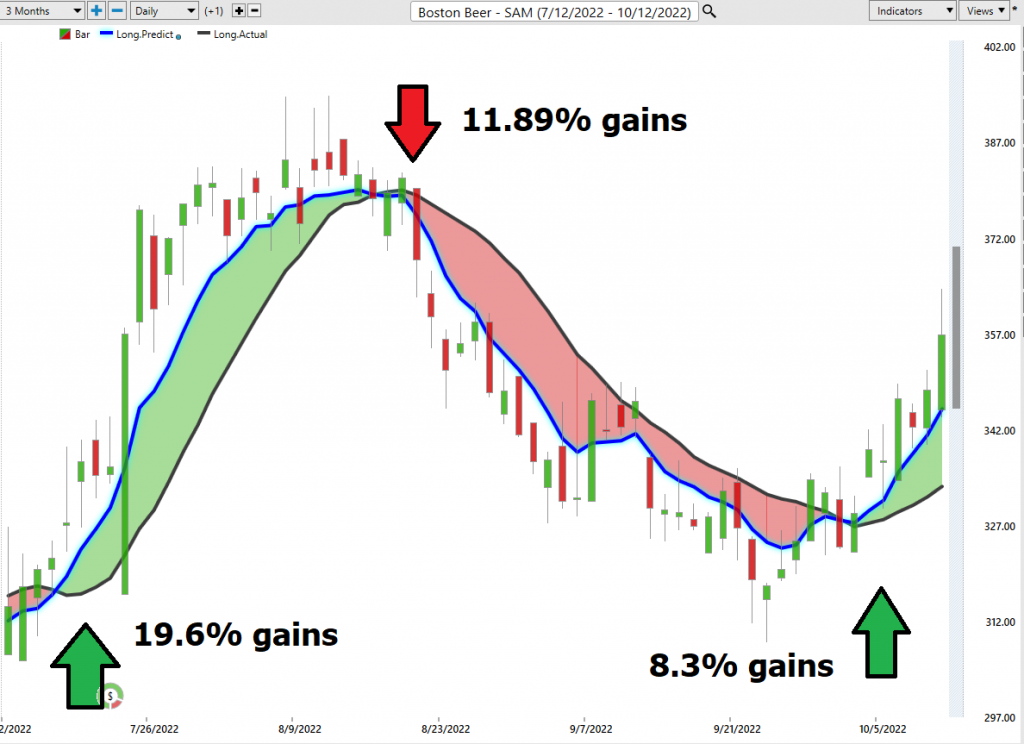
Trade #1 was a winner resulting in a gain of 19.6%
Trade #2 was a winner on the short side and resulted in a gain of 11.89%
Trade #3 is currently open and has an open gain of 8.3%.
Fine Tuning Entries with The Neural Net Indicator
At the bottom of the chart is the Neural Network Indicator which predicts future short-term strength and/or weakness in the market. When the Neural Net Indicator is green it communicates strength. When the Neural Net is red it is forecasting short term weakness in the market.
Neural networks are a type of artificial intelligence that is designed to mimic the way the human brain learns. Neural networks are often used for quantitative analysis, which is the process of using mathematical and statistical models to make decisions about investments. Probability is a key concept in quantitative analysis, and neural networks can be used to calculate probabilities based on past data. For example, if a neural network has been trained on historical stock data, it can predict the probability that a particular stock will go up or down in price. This type of big data analysis can be extremely helpful for traders who are trying to make informed decisions about their investments.
Whenever Power Traders are looking for statistically valid trading setups, they look for a DOUBLE confirmation signal. This signal occurs whenever the blue predictive line and the Neural Net at the bottom of the chart suggest the same future expected outcome.
We advocate that Power Traders cross reference the chart with the predictive blue line and neural network indicator to create optimal entry and exit points.
Traders look for confirmation on the Neural Net to position themselves LONG or SHORT in the market. In other words, when the A.I. forecast is green, and The Neural Net is green, that presents a buying opportunity.
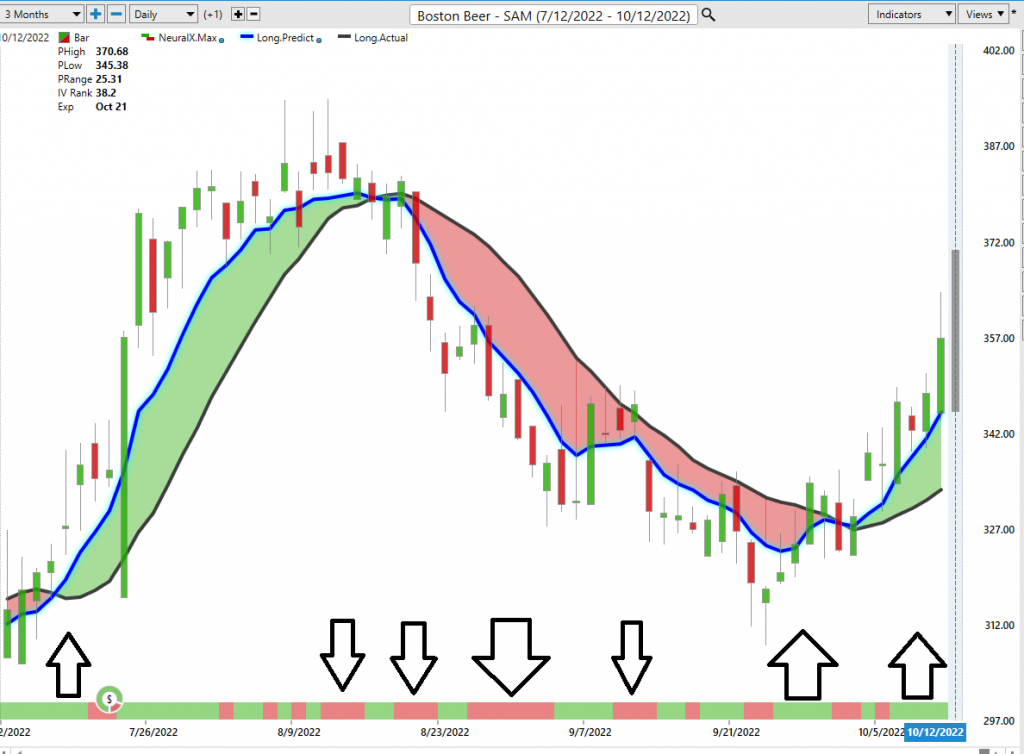
The inverse is also true, when the A.I. forecast is red and the Neural Net is red, that is a SELLING opportunity. The arrows on the chart below highlight the trading zones where Power Traders would’ve been using double confirmation to find a BUYING opportunity in cross referencing the A.I. forecast with the Neural Net.
Power Traders are always looking to apply both the Neural Network and A.I. to the markets to find statistically sound trading opportunities.
VantagePoint Software Daily Price Range Prediction
One of the powerful features in the VantagePoint Software which Power Traders use daily is the Price Range prediction forecast.
This forecast is what permits Power Traders to truly fine tune their entries and exits into the market.
Every day traders are faced with the anxiety and frustration of wondering where they should be looking to buy and sell the market. VantagePoint’s A.I. makes this decision super easy with the Daily Price Range Forecast.
For short term traders the important question that they have to confront every day is where should I buy? Where should I place my stop? Where should I sell? The VantagePoint Daily Price Range forecast can help them answer this question.
Here are the important trading metrics of $SAM so that we can get a realistic perspective of volatility and risk.
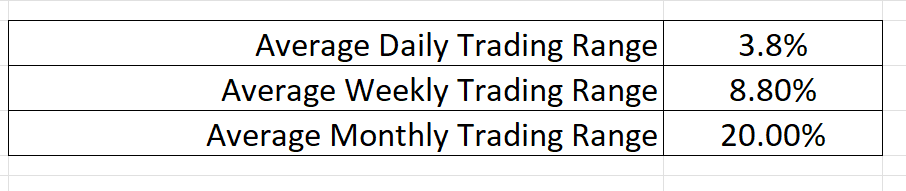
These metrics are averages for the time frames indicated. Great traders use this type of range analysis to further minimize risk exposure and improve entries into the market. More importantly the artificial intelligence provides specific boundaries where it expects price to find support and resistance for the following trading day.
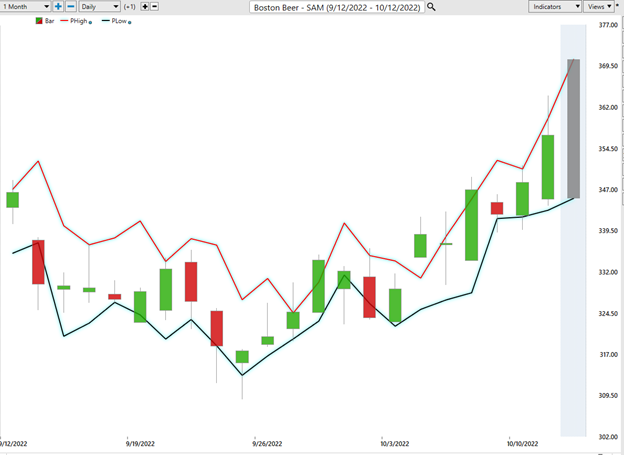
Against this highly volatile background the Vantagepoint A.I. daily range forecast operates daily to provide exact suggestions for projected high and low prices.
Observe how the channel is very clearly delineated and it is very easy to observe where anticipated support and resistance over the short term is. Traders look to buy near the bottom of the channel and sell at or above the top of the channel.
Observe how the upper and lower bands of the price range forecast form a noticeably clear channel of trading activity as well. Swing traders are always looking for opportunities to buy towards the bottom of the predicted channel and selling opportunities above the top band.
Intermarket Analysis
Power lies in the way we respond to the truth we understand.
Management has made the company more financially flexible by restructuring its debt obligations.
One of the supremely important questions in trading is what is driving the price? Headlines often create interesting narratives. But these “stories” only capture the imagination. Traders want and need to understand the cause and effect of price movement.
The only way to get an answer to this important question is through intermarket analysis which looks at statistical price correlations of assets.
We live in a global marketplace.
Everything is interconnected.
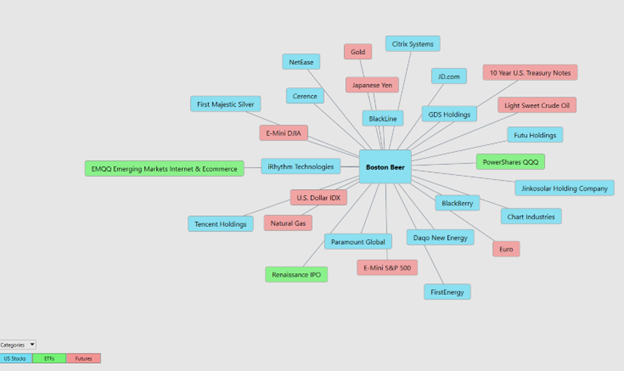
Intermarket analysis is a branch of quantitative analysis that uses correlations between different asset classes to predict market movements. The idea is that by understanding how different markets are related, traders can make more informed decisions about where to allocate their capital.
There are a number of leaders in the field of intermarket analysis for stock trading. Some of the most popular names include Louis Mendelsohn the founder of Vantagepoint Software, John Murphy, Jim Rogers, and Gary Kaminsky.
Traders can benefit from intermarket analysis in a number of ways. First, it can help them to identify opportunities that they might otherwise miss. Second, it can give them a better understanding of how different markets move, which can ultimately lead to more successful trades. Finally, by using intermarket analysis, traders can get a better sense of market sentiment and build a more complete picture of the market landscape. Interest rates, Crude Oil Prices, and the volatility of the Dollar amongst thousands of other variables affect the decisions companies must make to flourish and prosper in these incredibly challenging times. Trying to determine what these factors are is one of the huge problems facing investors and traders.
You always have a choice. You can tune in to the talking heads in the media who spin talking points which promote fear. Or you can rely on facts to base your decision making on.
There is immense value to be had in studying and understanding the key drivers of $SAM’s price action. This graphic provides a microcosmic view of what factors have been driving $SAM’s price higher.
Suggestion for Traders
Risk management is key here. Risk management is a term used in trading to refer to the process of managing one’s exposure to risk. Exposure can be defined as the amount of money that would be lost if the market moved against your position. Volatility is a measure of how much the market is expected to move and is therefore a key consideration when managing risk. There are a number of different strategies that can be used to manage risk, and it is important to tailor these strategies to suit your individual trading style. One common approach is to use stop-loss orders, which automatically close your position if the market moves against you by a certain amount. Another approach is to limit your exposure by only trading a certain percentage of your total capital. By carefully managing your exposure to risk, you can help protect your capital and avoid making costly mistakes.
The short term and medium-term trends are UP. The Longer-term trend is still firmly lower. But volatility is increasing. Increasing volatility creates opportunity for option savvy traders to sell time premium.
Currently, only 19.8% of ALL stocks are trading above their 200 day moving averages.
That means that 80% of all stocks are in downtrends.
The current 200 day moving average of $SAM is at $371.75 so even the current rally which the A.i. forecast must be viewed in the context of the broader downtrend. $SAM is trading at $356. Since the 200-day moving average is above the current price we must acknowledge that the current rally, though impressive is still a bear market bounce. With volatility rising quickly this presents opportunities to sell time premium in the nearby options contract which expires on October 21st.
Here is an example of the volatility time decay strategies we are looking at:
The October 340 put is trading at 12.40. Break even stock price at expiration = $327.60
All things being equal the 340 put will decay at a rate of $1.37 per day.
The October 330 put is trading at 9.60. Break even stock price at expiration = $320.40
All things being equal the 330 put will decay at a rate of $1.06 per day.
Take the premium amount listed above and divide by 9 days and that is how much the premium is expected to deteriorate every day absent of any price movement. Traders are not required to hold the position till expiration. The options contracts are very liquid, and traders place premium price stops should they be wrong in their assessment.
Another way of looking at this opportunity is to subtract the premium from the strike price to determine where the option buyer would break even at expiration. The October 340 put would require the stock to trade all the way down to 327.60 for the trader to break even at expiration. This represents that $SAM would need to fall by 8% in the next 9 days for the put to break even. For the option seller, because of the high volatility imagine those probabilities! The stock has to move 8% lower between now and expiration for you to lose money. Can this occur? Certainly. But we always must focus on the probabilities. 10 trading sessions ago $SAM closed at $324 so $SAM would have to give up all of its gains for this potential trade to turn sour. This level of time decay is attractive to seasoned options traders.
If you are new to options my recommendation is to paper trade this suggestion so that you can understand the risks, rewards, and probabilities.
$SAM is offering a mixed set of signals at present time but clearly the volatility is increasing. Therefore, we find selling option premium to be more attractive than trading the underlying asset. The next earnings announcement for $SAM is scheduled for one day prior to the October Options expiration on 10/20/22.
Our recommendation is to follow the A.I. trend analysis as outlined in this stock study and practice good money management on all trades. Preserve your capital. Practice good money management.
We will re-evaluate based upon:
- New Wall Street Analysts’ Estimates
- New 52-week high and low boundaries
- Vantagepoint A.I. Forecast (Predictive Blue Line)
- Neural Network Forecast
- Daily Range Forecast
Let’s Be Careful Out There!
Remember, It’s Not Magic.
It’s Machine Learning.

IMPORTANT NOTICE!
THERE IS SUBSTANTIAL RISK OF LOSS ASSOCIATED WITH TRADING. ONLY RISK CAPITAL SHOULD BE USED TO TRADE. TRADING STOCKS, FUTURES, OPTIONS, FOREX, AND ETFs IS NOT SUITABLE FOR EVERYONE.
DISCLAIMER: STOCKS, FUTURES, OPTIONS, ETFs AND CURRENCY TRADING ALL HAVE LARGE POTENTIAL REWARDS, BUT THEY ALSO HAVE LARGE POTENTIAL RISK. YOU MUST BE AWARE OF THE RISKS AND BE WILLING TO ACCEPT THEM IN ORDER TO INVEST IN THESE MARKETS. DON’T TRADE WITH MONEY YOU CAN’T AFFORD TO LOSE. THIS ARTICLE AND WEBSITE IS NEITHER A SOLICITATION NOR AN OFFER TO BUY/SELL FUTURES, OPTIONS, STOCKS, OR CURRENCIES. NO REPRESENTATION IS BEING MADE THAT ANY ACCOUNT WILL OR IS LIKELY TO ACHIEVE PROFITS OR LOSSES SIMILAR TO THOSE DISCUSSED ON THIS ARTICLE OR WEBSITE. THE PAST PERFORMANCE OF ANY TRADING SYSTEM OR METHODOLOGY IS NOT NECESSARILY INDICATIVE OF FUTURE RESULTS. CFTC RULE 4.41 – HYPOTHETICAL OR SIMULATED PERFORMANCE RESULTS HAVE CERTAIN LIMITATIONS. UNLIKE AN ACTUAL PERFORMANCE RECORD, SIMULATED RESULTS DO NOT REPRESENT ACTUAL TRADING. ALSO, SINCE THE TRADES HAVE NOT BEEN EXECUTED, THE RESULTS MAY HAVE UNDER-OR-OVER COMPENSATED FOR THE IMPACT, IF ANY, OF CERTAIN MARKET FACTORS, SUCH AS LACK OF LIQUIDITY. SIMULATED TRADING PROGRAMS IN GENERAL ARE ALSO SUBJECT TO THE FACT THAT THEY ARE DESIGNED WITH THE BENEFIT OF HINDSIGHT. NO REPRESENTATION IS BEING MADE THAT ANY ACCOUNT WILL OR IS LIKELY TO ACHIEVE PROFIT OR LOSSES SIMILAR TO THOSE SHOWN.

