

Scientific Games Corporation provides gambling products and services to lottery and gambling organizations internationally. The company is headquartered in Las Vegas, Nevada with lottery headquarters and production plant in Alpharetta, Georgia. Its products include computerized and mechanical slot machines, table game theme copyrights, electronic card shufflers, instant lottery games, lottery gaming systems, terminals and services, internet applications, server-based interactive gambling terminals, gambling control systems, social gaming, and sports betting.
Management has taken steps to reduce net debt and the company is focused on organic growth by acquiring casinos as customers. The company is positioning itself as a leader in the mobile gaming market. Internally, Scientific Games has said it will focus on digital gaming and sports-betting opportunities. These are areas where names like DraftKings and FanDuel have been market leaders. Price action of the stock over the last 12 months indicates that Scientific Games could play a big role moving forward in these profitable niches.
The gambling market is red-hot, with a strong focus on digital sports betting options. Casinos and new entrants are rapidly launching betting apps and the market is bidding up these stocks. We don’t know yet if Scientific Games can sign on the casino partners it needs to make digital betting a big business, but that’s where the growth is.
Analysts Ratings
The nine analysts offering 12-month price forecasts for Scientific Games Corp have a median target of $62.00, with a high estimate of $70.00 and a low estimate of $36.00. The median estimate represents a -14.55% decrease from the last price of $72.56. Power Traders like to see these wide divergent views in opinions as it is the backdrop and economic environment which the company is operating under.
Let’s start our analysis with the commonsense metrics. Over the last 52 weeks SGMS has traded as high as $75.04 and as low as $13.52. This tells us that the annual trading range has been $61.52. The average weekly trading range has been $1.18. These values provide baseline metrics which we look to dramatically outperform when we apply artificial intelligence and machine learning to our decision-making process.
When we study the charts, we start by analyzing where the market is in relationship to its 52-week high and low. Experience tells us that assets which successfully breach their 52-week highs on strong momentum tend to move higher, and vice-versa. The following 1-year SGMS chart shows the most recent 52 week high and low boundaries.
.png)
What is fascinating about the chart is four times in the past year SGMS encountered its 52-week high. This boundary proved to be very strong resistance initially, but each time the 52-week boundary was breached, and the result was significantly higher prices. Over the past year SGMS is up 301% and currently it is testing its all time high.
While we do not create a valuation based upon fundamental factors, we study them to understand the financial landscape that the company is operating under. One of the most challenging aspects which traders operate under is the idea that they must buy low and sell high. While this can be true, it can be very profitable to buy high and sell higher when the conditions are correct. What we look for in the A.I. is the strongest trends that are seeing a lot of volatility and allow the A.I. and machine learning to dictate where we should position ourselves within these trends.
There is tremendous power in being aware of an asset when it is trading at 52-week highs. At these points we pay particularly close attention to VantagePoint’s A.I. forecast.
The VantagePoint Analysis
Whenever we look at an asset forecast, we always are comparing what the stock has done, to the artificial intelligence, which is computing its forecast based upon a proprietary intermarket analysis of the most closely correlated assets as well as a neural network computation.
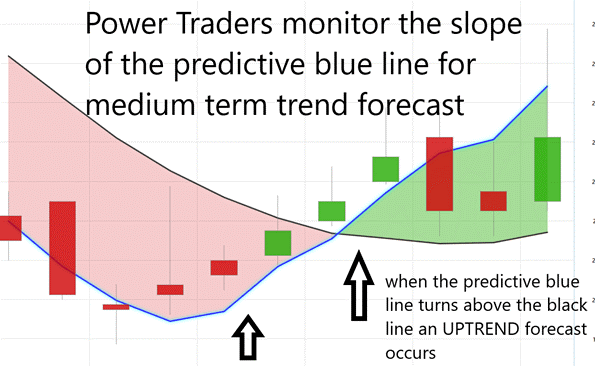
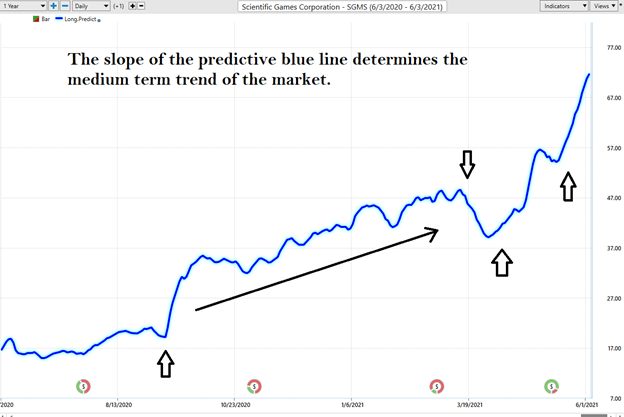
The key to the VantagePoint analysis is the predictive blue line. The slope and general direction of the blue line determines the medium forecast for the market.
The VantagePoint Software has three separate modules which create a forecast for a Power Trader. They are the predictive blue line, the Neural Net, and the Intermarket Analysis.
The predictive blue line also acts as value zone where in uptrends traders may try to purchase the asset at or below the blue line. Power traders use the predictive blue line in helping to determine both the value zone as well as the trend direction.
To understand and appreciate how powerful this indicator is, we’ll remove the daily price bars on the chart.
- The slope of the predictive blue line determines the short-term trend. On the following graphic, you would want to look for opportunities to buy when the slope of the blue line is going up.
- When the slope of the blue line is going sideways you would be anticipating sideways prices.
- Likewise, when the slope of the blue line is going down you would be anticipating lower prices.
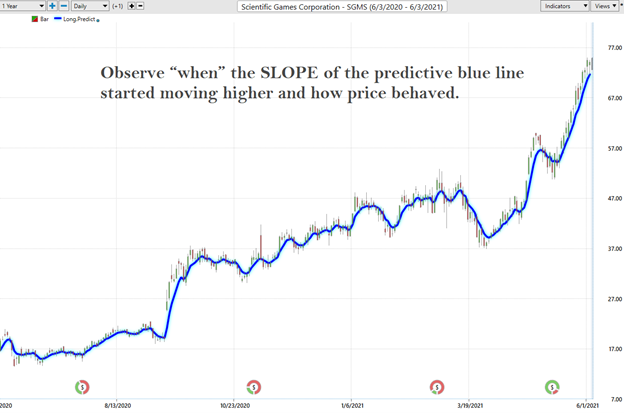
Observe “when” the SLOPE of the predictive blue line started moving higher and how price behaved.
Here is the same chart with the accompanying daily price bars. As you look through this chart study how
- Power Traders always try to look for opportunities to purchase the asset at or below the predictive blue line, as that is considered to be the IDEAL VALUE zone for traders.
- Power Traders always try to look for opportunities to sell the asset at or above the predictive blue line, as that is considered to be the IDEAL VALUE zone for traders.
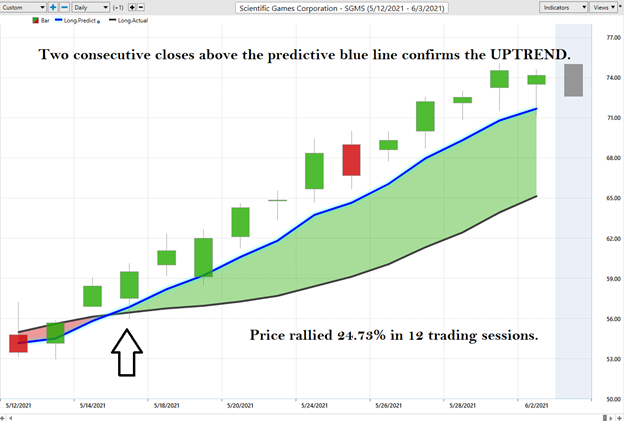
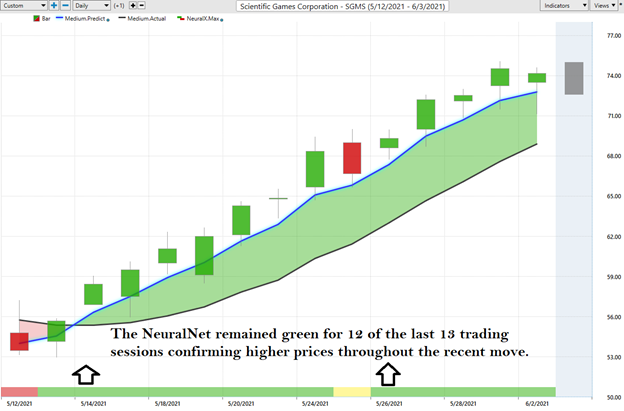
We can zoom in on a smaller area of the chart to magnify the A.I. forecast. Here is an example from May 12th to June 2nd. Price closed over the predictive blue line for two consecutive days on May 14th and prices rallied 24.73% in 12 trading sessions.
At the bottom of the chart is the Neural Network Indicator which predicts future short-term strength and/or weakness in the market. When the Neural Net Indicator is green it communicates strength. When the Neural Net is Red it is forecasting short term weakness in the market.
We advocate that Power Traders cross reference the chart with the predictive blue line and neural network indicator to create optimal entry and exit points. Over the most recent 13 trading sessions the Neural Net remained GREEN for 12 days. This clearly confirmed that SGMS was poised for higher prices.
Power Traders are always looking to apply both the neural network and A.I. to the markets to find statistically sound trading opportunities.
Fine Tuning Entries and Exits
One of the powerful features in the VantagePoint Software which Power Traders use on a daily basis is the Price Range prediction forecast.
This forecast is what permits Power Traders to truly fine tune their entries and exits into the market.
At 6:30pm after the market close the software updates and all of the price predictions change based upon what the machine learning, A.I., neural networks, and intermarket analysis anticipate moving forward.
Here is the price chart of SGMS during the most recent runup featuring the Daily Price Range forecast with the NeuralNet Index at the bottom of the chart. Day traders who are looking for short term swings in the markets focus on the daily price ranges to place their entry and exit orders.
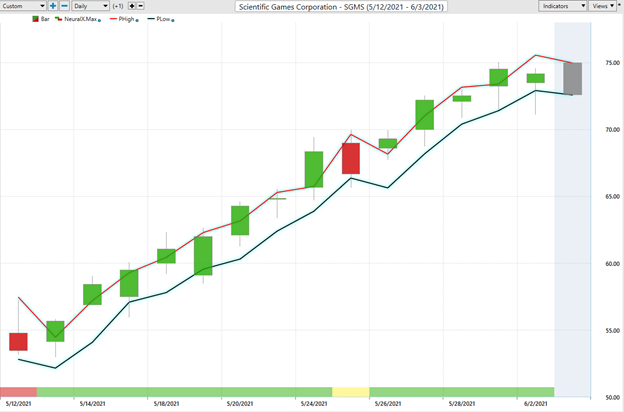
By utilizing both tools simultaneously, Power Traders can locate precision entries and exits with high probabilities of success and are capable of exploiting short term swing trading opportunities.
When buying, many Power Traders often use a price level below the predictive low price to place their protective sell stops in the market in case a sudden reversal was to occur. When selling, many Power Traders use a price level above the predictive high to place their protective sell stops.
Traders use these VantagePoint tools either independently or together to find great trading opportunities. This is the power at your fingertips when you use artificial intelligence to do your trend analysis. The slopes of the price channels above clearly delineate the trends.
Intermarket Analysis
We live in a global marketplace. Everything is interconnected. The billion-dollar question for traders is always what are the key drivers of price for the underlying asset that I am trading?
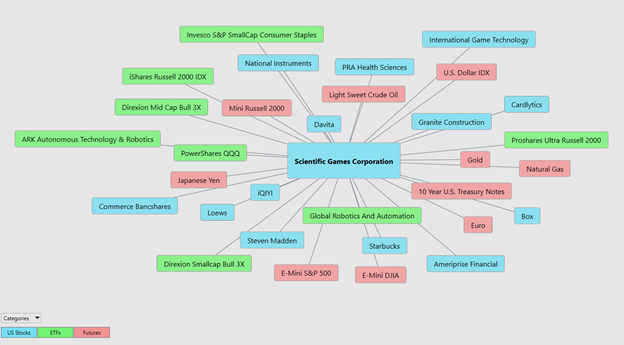
What makes VantagePoint unique and distinct when compared to all other analytical tools is its patented and proprietary intermarket analysis.
Intermarket analysis is a method of analyzing markets by examining the correlations between different asset classes. In other words, what happens in one market could, and probably does, affect other markets, so a study of the relationship(s) is often very helpful to a trader.
There is great value to be had in studying and understanding the key drivers of SGMS price action.
Small changes in Interest Rates, Crude Oil Prices, and the Volatility of the Dollar (amongst thousands of other variables) affect the decisions companies must make to survive in these very challenging times. Trying to determine what these factors are is one of the huge problems facing investors and traders.
These factors are all displayed from a standpoint of statistical correlations which show the strongest interconnectedness of prices. Looking at the markets with this tool opens up a slew of other trading insights.
Instead of looking at financial markets or asset classes on an individual basis, intermarket analysis looks at several strongly correlated markets, or asset classes, such as other stocks, currencies, ETFs, and commodities. This type of analysis expands on simply looking at each individual market or asset in isolation by also looking at other markets or assets that have a strong relationship to the market or asset being considered. The VantagePoint software analyzes the top 31 drivers of an assets price. This analysis will often show ETF’s which are big owners of the underlying asset, but it will also uncover other markets which are statistically correlated to the trend you are analyzing. Traders often find other blossoming opportunities when engaging in Intermarket Analysis.
Our Trading Suggestion
We approach our analysis not from a fundamental valuation perspective but from a pure trader’s viewpoint. The potential of legalized gambling nationally is one of the fundamental drivers which is making SGMS stock price move. This fundamental story is the reason why SGMS is up over 300% in the past year.
By traditional valuation methods SGMS is overvalued. However, the trend is clearly UP. Power Traders, who are in at lower prices, have moved their protective sell stops up to the bottom of the trading channel as a defensive measure.
With the stock currently trading at new all-time highs we cannot in good conscience advocate new long positions. However, we do think that when the market breaks, put SGMS on your radar and look to get long when the A.I. forecast advocates. The 52-week high chart shows how the new 52-week high provides solid resistance to the market. Pullbacks of 15% to 25% from the 52-week highs occurred numerous times in 2020. These opportunities created a wonderful opportunity to buy at lower prices as long as it was congruent with the A.I. forecast.
We have had it on our radar many times over the past year and will continue to monitor it for solid trading opportunities. We like the idea of finding PUT opportunities in this stock and think seasoned options traders could consider this strategy on pullbacks. Or an alternative could be selling Bearish Credit Spreads.
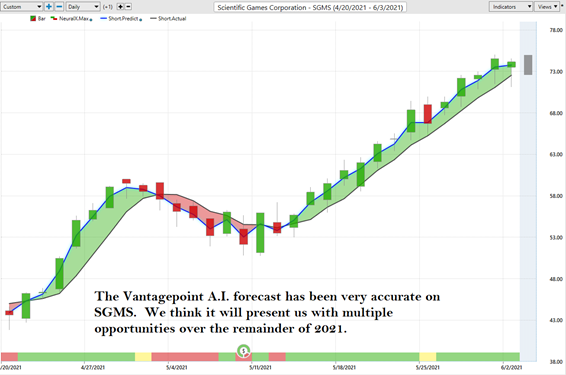
The Vantagepoint A.I. forecast has been very accurate on SGMS. We think it will present us with multiple opportunities over the remainder of 2021.
Let’s Be Careful Out There!
Remember, It’s Not Magic.
It’s Machine Learning.

IMPORTANT NOTICE!
THERE IS SUBSTANTIAL RISK OF LOSS ASSOCIATED WITH TRADING. ONLY RISK CAPITAL SHOULD BE USED TO TRADE. TRADING STOCKS, FUTURES, OPTIONS, FOREX, AND ETFs IS NOT SUITABLE FOR EVERYONE.
DISCLAIMER: STOCKS, FUTURES, OPTIONS, ETFs AND CURRENCY TRADING ALL HAVE LARGE POTENTIAL REWARDS, BUT THEY ALSO HAVE LARGE POTENTIAL RISK. YOU MUST BE AWARE OF THE RISKS AND BE WILLING TO ACCEPT THEM IN ORDER TO INVEST IN THESE MARKETS. DON’T TRADE WITH MONEY YOU CAN’T AFFORD TO LOSE. THIS ARTICLE AND WEBSITE IS NEITHER A SOLICITATION NOR AN OFFER TO BUY/SELL FUTURES, OPTIONS, STOCKS, OR CURRENCIES. NO REPRESENTATION IS BEING MADE THAT ANY ACCOUNT WILL OR IS LIKELY TO ACHIEVE PROFITS OR LOSSES SIMILAR TO THOSE DISCUSSED ON THIS ARTICLE OR WEBSITE. THE PAST PERFORMANCE OF ANY TRADING SYSTEM OR METHODOLOGY IS NOT NECESSARILY INDICATIVE OF FUTURE RESULTS. CFTC RULE 4.41 – HYPOTHETICAL OR SIMULATED PERFORMANCE RESULTS HAVE CERTAIN LIMITATIONS. UNLIKE AN ACTUAL PERFORMANCE RECORD, SIMULATED RESULTS DO NOT REPRESENT ACTUAL TRADING. ALSO, SINCE THE TRADES HAVE NOT BEEN EXECUTED, THE RESULTS MAY HAVE UNDER-OR-OVER COMPENSATED FOR THE IMPACT, IF ANY, OF CERTAIN MARKET FACTORS, SUCH AS LACK OF LIQUIDITY. SIMULATED TRADING PROGRAMS IN GENERAL ARE ALSO SUBJECT TO THE FACT THAT THEY ARE DESIGNED WITH THE BENEFIT OF HINDSIGHT. NO REPRESENTATION IS BEING MADE THAT ANY ACCOUNT WILL OR IS LIKELY TO ACHIEVE PROFIT OR LOSSES SIMILAR TO THOSE SHOWN.

