
The Tootsie Roll company was founded in 1896 by Leo Hirshfield. The Tootsie Roll is a chocolate-flavored taffy-like candy. It is one of the oldest candies in the United States, and it is one of the most popular candy brands in the world. The Tootsie Roll company makes a variety of candy products, including Tootsie Rolls, Tootsie Pops, Tootsie Fruit Chews, and Tootsie mints. The company’s headquarters are in Chicago, Illinois. The company became a publicly traded stock in 2007. The Tootsie Roll company has approximately 4,000 employees.
There are conflicting stories about how the name came about. According to one story, the name is a reference to the creator’s daughter, whose nickname was “Tootsie.” However, another story claims that the name was chosen because it was a popular slang term at the time. Whichever story is true, the name “Tootsie Roll” has become synonymous with the delicious chocolate candy.
Tootsie Roll Industries ($TR) is a candy company that has outperformed the market this year and is drawing a lot of attention to itself because 74% of all outstanding shares are owned by management. Since insiders have demonstrated their faith in the company by owning shares the stock has acted like a safe haven of sorts during a difficult market environment for the broader market.
The company’s financials are also on the rise, with second-quarter revenue and net income up 24.3% and 20%, respectively, on a year-over-year basis.
Tootsie Roll also offers a dividend and has had 52 consecutive years of dividend increases, with its forward annual dividend yield currently sitting at a modest 0.9%. Tootsie Roll Industries’ dividend is lower than the US industry average of 1.64%, and it is lower than the US market average of 4%.
Some of Tootsie Roll Industries’ main competitors include Hershey, Nestle, and Mars. These companies produce a wide range of candy products, including chocolate bars, candy bars, and gum. While Tootsie Roll Industries competes with these companies for market share, it also collaborates with them to stay ahead of trends in the candy industry. By understanding the candy industry landscape, Tootsie Roll Industries can maintain its position as a leading candy company.
While Tootsie Roll’s share of the market has fluctuated over the years, it remains a key player in the industry. In recent years, Ellen Gordon, the CEO, has been working to position the company for continued success in the future. Under her leadership, Tootsie Roll has refocused its efforts on innovation and marketing and has taken steps to streamline its operations. As a result, the company is well positioned to continue its strong performance in the years to come.
What makes $TR attractive as a longer-term investment is its intelligent use of debt. Many companies leverage themselves extensively with debt and this can create tremendous risk should the debt be difficult to repay. Tootsie Roll Industries had US $8.52m in debt in June 2022. But it also has US $123.1m in cash to offset that, meaning it has US$114.6m net cash. The company practices very conservative finance which is attractive to longer-term investors.
In this weekly stock study, we will look at and analyze the following indicators and metrics as our guidelines:
- 52-week high and low boundaries
- Vantagepoint A.I. Forecast (Predictive Blue Line)
- Neural Network Forecast
- Daily Range Forecast
- Intermarket Analysis
- Our trading suggestion
We only look at things like earnings or fundamental cash flow valuations to better understand the financial landscape that a company is operating under.
Analysts Ratings
Media mentions of Tootsie Roll Industries are rare. Since the company only has a market cap of $2.7 billion there are not many analysts who cover the day-to-day operations of the company. A small cap company is defined as a company with a market capitalization of under $2 billion. A mid cap company is defined as a company with a market capitalization of $2 billion to $10 billion. A large cap company is defined as a company with a market capitalization of over $10 billion. While there is no fixed rule, small cap companies are generally considered to be more volatile and riskier than their larger counterparts. Mid cap companies fall somewhere in the middle, offering investors a mix of growth potential and stability. Large cap companies are often thought of as blue-chip stocks, and they are typically less volatile than small cap stocks. As such, they are often favored by risk-averse investors.
For an analyst’s ratings to be meaningful we want to see a cumulative analysis of something that is widely followed otherwise it is just one person’s opinion.
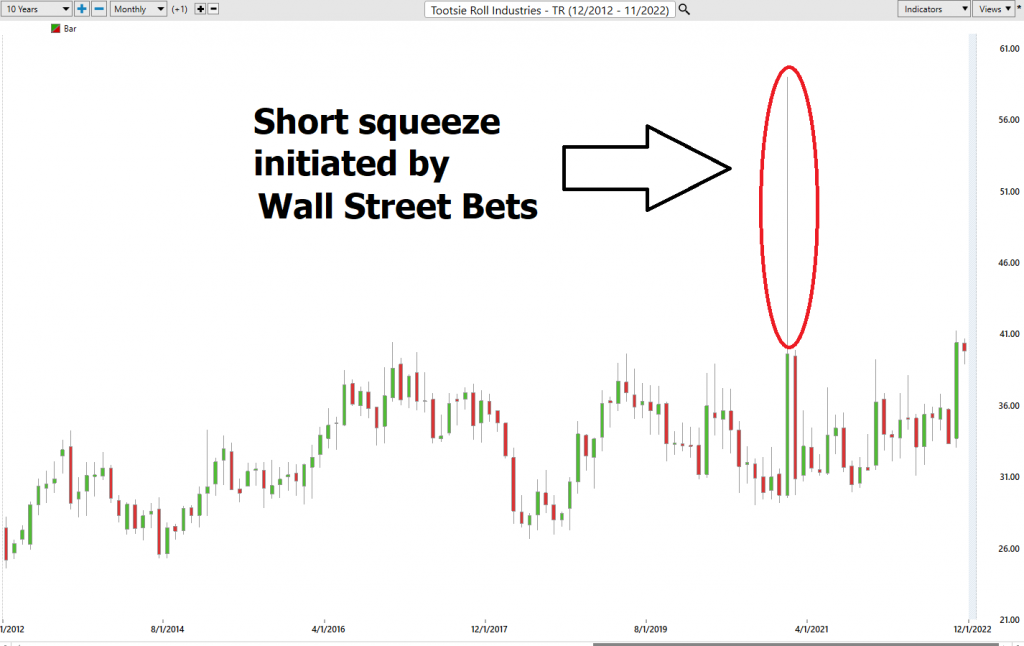
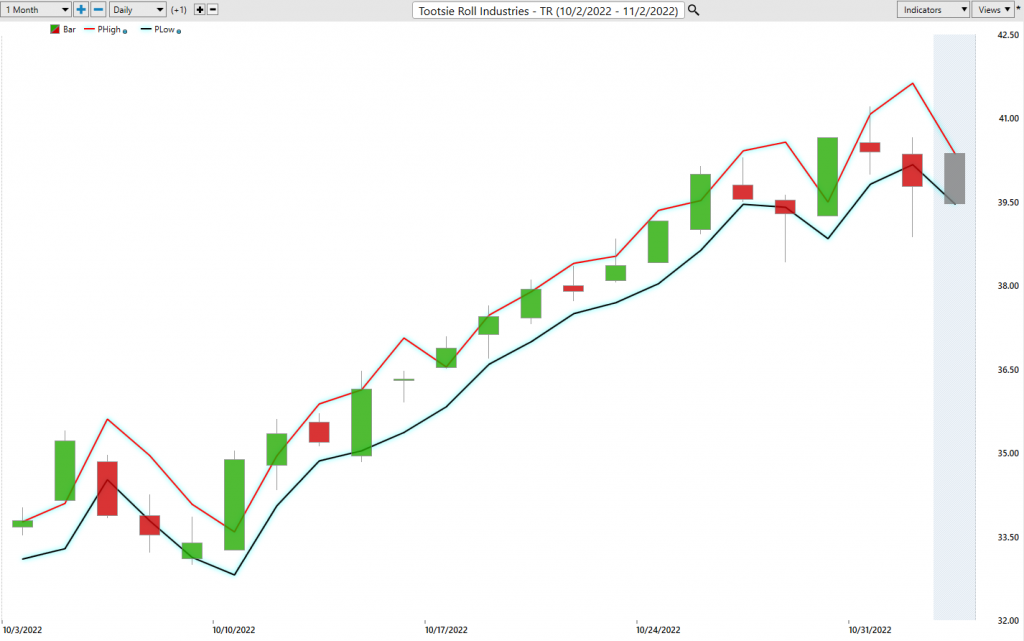
Two years ago, $TR experienced massive volatility during January 2021. The company reported a sales number that was significantly below expectations. $TR 2020 net sales of $467.43 million fell short of 2019’s $523.62 million haul. This resulted in the company being heavily shorted by hedge funds. This occurred during the same general time frame that the GameStop short squeeze in January 2021.
You might recall, in mid-January 2021, a group of individual investors on the subreddit WallStreetBets began buying up shares of GameStop (GME) stock to drive up the price and force a “short squeeze.” A short squeeze occurs when investors who have sold shares “short” are forced to buy them back at a higher price in order to avoid losses. The campaign was successful in driving up the stock price from around $20 per share to over $300 per share in just a few days. This created huge profits for the Redditors who bought in early, but also caused losses for the hedge funds that were short the stock.
As it was discovered that hedge funds were also net short $TR the stock exploded from $40 to $58 dollars a share as small traders activated a short squeeze on $TR.
I have highlighted the chart to show how unusual this was in what has been a very stable stock.
52-week High-Low Chart
Over the last 52 weeks $TR has traded as high as $41.20 and as low as $30.50. This provides us with an annual trading range of $10.70. What we often like to do as well is divide the annual trading range ($10.70) by the current price ($39.78) to provide us with a basic and generic calculation of how the annualized volatility for $TR, which is currently 26.9%. This value tells us that it would be considered completely normal for $TR to trade 26.9% higher or lower from its current level over the next year.
We refer to these as the commonsense metrics which we use as baseline measurements of understanding normal value. When using artificial intelligence, we look to amplify our returns based upon these baseline measurements.

We always pay attention to where we are in relation to the 52-week trading range. It is common to see the 52-week high provide strong resistance to the market until it is breached. Often when the 52-week high is breached we will see the stock price explode higher very quickly over a very short period. This is what has occurred recently in $TR and Power Traders who were paying attention to the 52-week boundary and the a.i. forecast have done very well over the last few weeks.
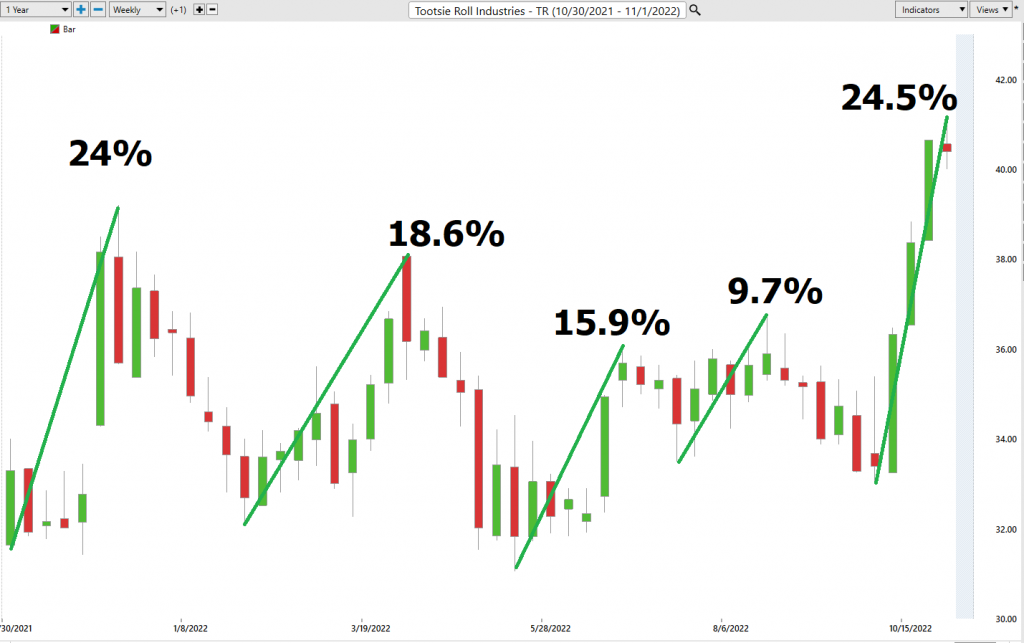
Best Case – Worst Case Scenarios
When we study the long term 52-week chart we can look at the best case and worst-case scenarios just to get an eyeball perspective of the risk and volatility of this asset. This is worth doing anytime you invest or trade to monetarily understand what the potential risks and rewards have been over the past year.
This simple practical analysis reveals what the realistic volatility of $TR has been over the past year.
Here is the BEST-CASE scenario analysis on $TR:
Followed by the Worst-Case Analysis:
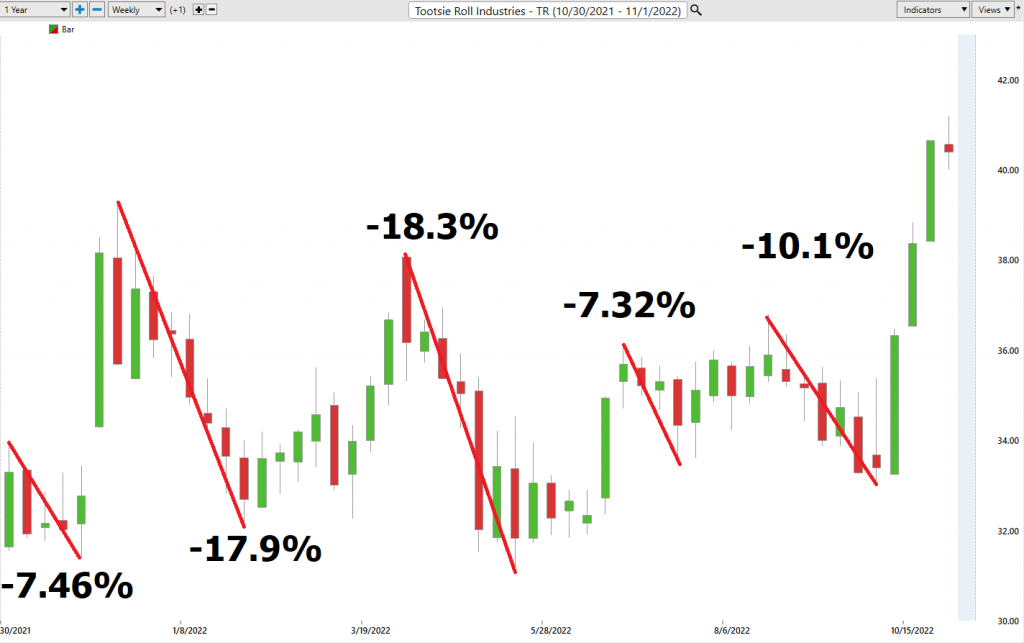
By simply studying these two charts we can determine and understand a couple of important things.
- The rallies are larger than the declines
- The magnitude of the rallies and the declines all stay within the 26.9% volatility parameters which we identified earlier.
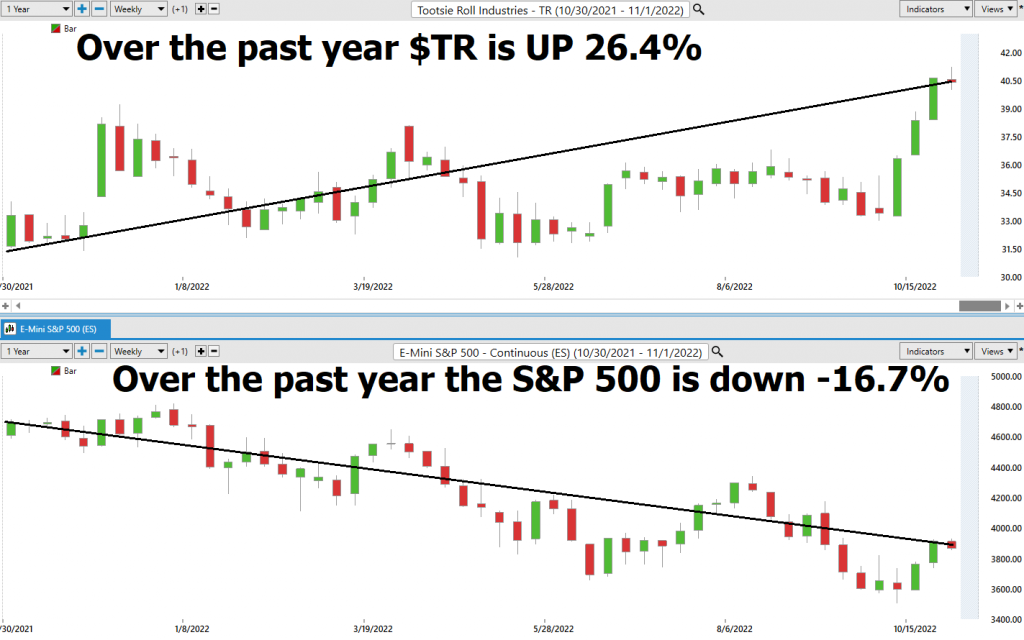
Next, we compare $TR to the broader stock market indexes to get an idea of its relative performance.
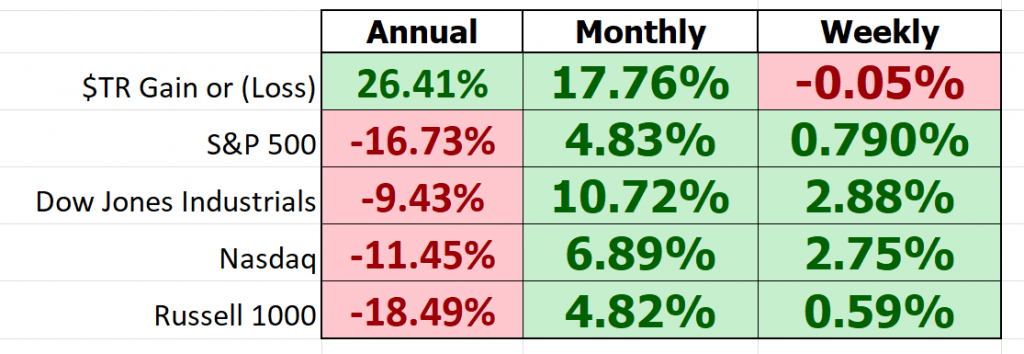
So, in $TR we have an asset which historically has massively outperformed the broader stock market indexes by a huge factor on the monthly and annual charts. It also has had less downside volatility in comparison.
What we can learn from this simple analysis is that anytime $TR drops 15% from a recent high you should put it on your radar and wait for the a.i. forecast to turn positive. This has been considered a winning move for Power Traders repeatedly over the past year.
What often happens on Wall Street is that long term investors seek safe havens when huge uncertainty occurs. $TR with its performance is attractive to investors at the present time. However, it is a small cap stock and as such it can be expected to have larger than average volatility.
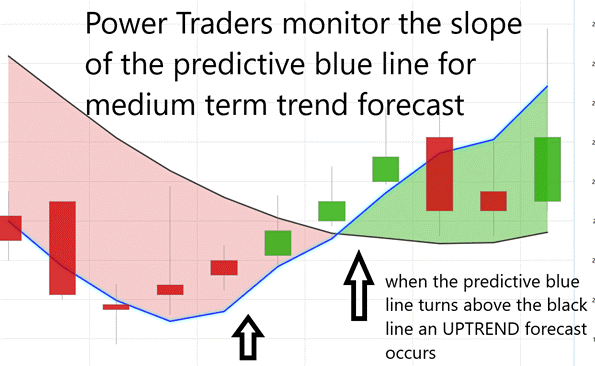
Vantagepoint A.I. Forecast (Predictive Blue Line)
On the following chart you will see the power of the VantagePoint Predictive blue line which determines the medium term trend price forecast.
We will zoom in on a smaller time frame for the last three months.
In studying the chart below pay close attention to the slope of the blue line.
The predictive blue line utilizes Vantagepoint patented Neural Network and Intermarket Analysis to arrive at its value. It looks at the strongest price drivers of an asset through artificial intelligence and statistical correlations to determine its value.
Whenever we see the predictive blue line move above the black line, we are presented with an UP-forecast entry opportunity. When the inverse occurs, we have a DOWN-forecast opportunity.
Over the last three months there have been three trend forecasts in $TR.
The first UP forecast generated profits of .14%
The second DOWN forecast generated profits of 1.14%
The Third Up forecast is still OPEN and has open profits of 14.13%
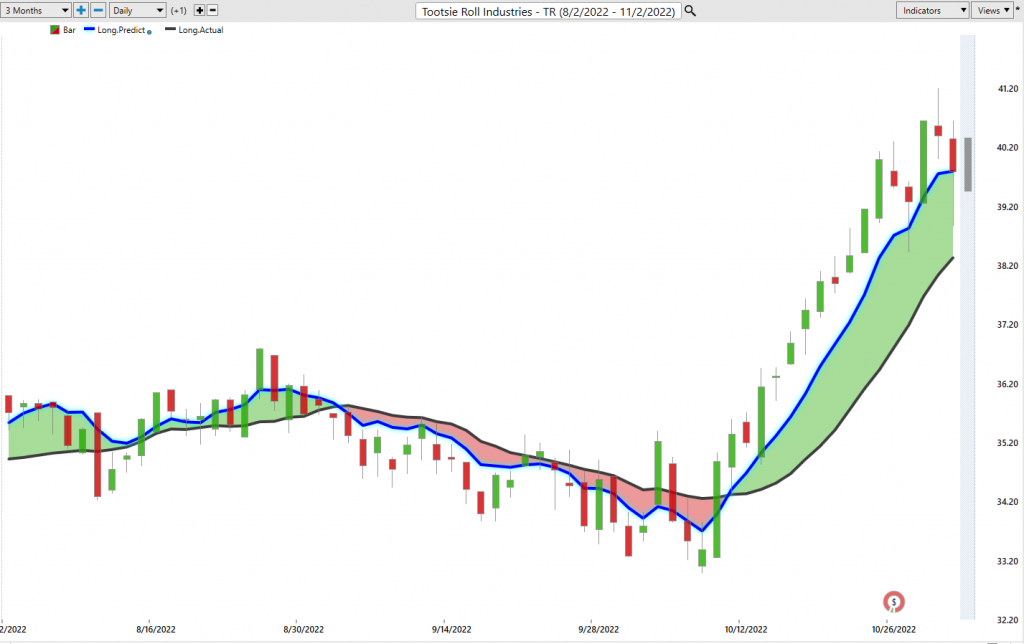
Power traders can use the predictive blue line to help to determine both the value zone as well as the trend direction. Two consecutive closes above the predictive blue line define where an uptrend forecast occurs.
When the SLOPE of the predictive blue line turns higher it becomes clear that a change in price direction is upon us.
Observe how the SLOPE of the predictive blue line started moving higher a few days before it moved above the black line. A strong trend was evidenced by seeing that prices were consistently closing above the predictive blue line.
Fine Tuning Entries with The Neural Net Indicator
At the bottom of the chart is the Neural Network Indicator which predicts future strength and/or weakness in the market. When the Neural Net Indicator is green it communicates strength. When the Neural Net is red it forecasts short-term weakness in the market.
A Neural Net is a computational learning system that uses a network of functions to understand and translate massive amounts of data into a desired output, consistently monitoring itself and improving its performance.
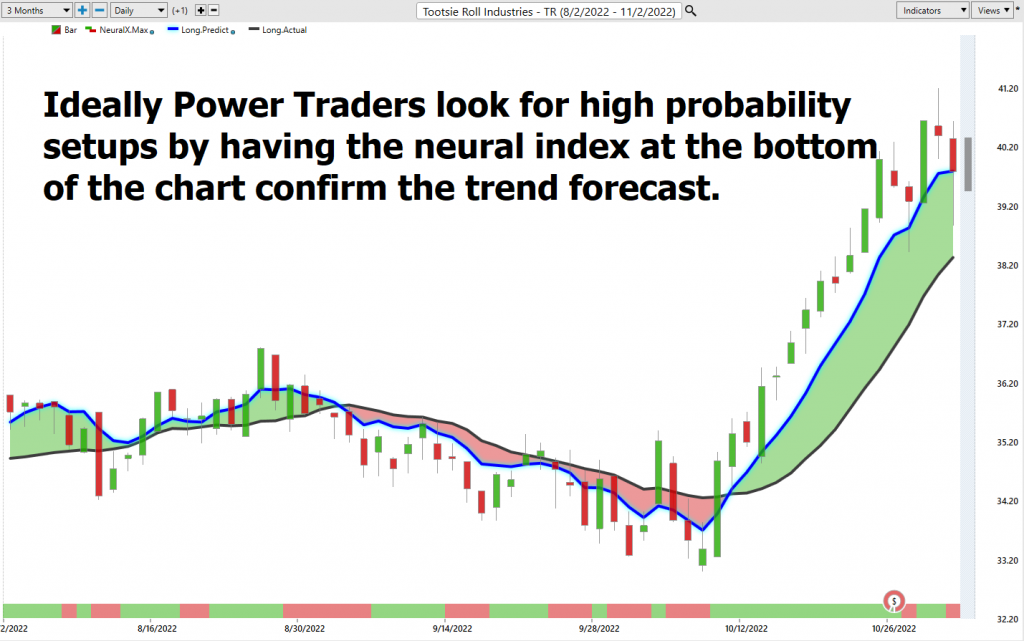
We advocate that Power Traders cross reference the chart with the predictive blue line and neural network indicator to find their optimal entry and exit points. We refer to this cross referencing as the DOUBLE CONFIRMATION setup. This occurs when both the Neural Index and the a.i. are aligned with regards to their trend forecast.
A neural network is a computerized system that is designed to simulate the workings of the human brain. Neural networks are widely used in a variety of fields, including trading. In trading, neural networks are used to identify patterns in data and make predictions about future price movements. Neural networks are trained using historical data, and the resulting models can be used to make buy or sell decisions in real time. Since neural networks are trained against large data sets, they can significantly improve the accuracy of trading predictions because their forecast is based upon statistical probabilities. As such, many traders rely on neural networks to make better decisions about when to enter and exit the market.
Power Traders are always looking to apply both the neural network and a.i. to the markets to find statistically sound trading opportunities. We advise Power Traders to cross reference the predictive blue line with the Neural Net for the best entry opportunities.
VantagePoint Software Daily Price Range Prediction
One of the powerful features in the Vantagepoint A.I. Software which Power Traders use daily is the Daily Price Range prediction forecast. Historically markets can fluctuate wildly. The challenge for traders is to find high confidence areas to purchase and sell.
Here are the range-based metrics for $TR over the past year.
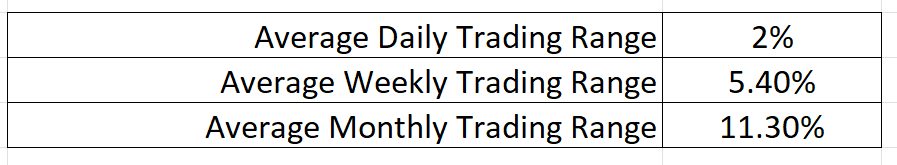
These metrics are what has occurred in $TR over the past year. Traders aware of these metrics would look to capture 40% to 50% of these values when trading on most occasions.
This VantagePoint A.I. daily range forecast is what permits Power Traders to truly fine tune their entries and exits into the market based upon the market’s volatility. Every trader, whenever they decide to trade, must make the decision regarding where they should get in and where they should get out. The Vantagepoint A.I. Daily Range Forecast answers these questions with exacting precision.
Here is the price chart of $TR during the most recent runup featuring the Daily Price Range forecast.
Intermarket Analysis
The challenge for all investors and traders is to differentiate between opinion and fact.
What makes the Vantagepoint Software unique is its ability to perform Intermarket analysis and to locate those assets which are most interconnected that are responsible for driving the price of $TR higher or lower.
Studying the charts can always provide objective realities in terms of locating support and resistance levels which become clear on a chart. But we live in a global marketplace. Everything is interconnected. The billion-dollar question for traders is always what are the key drivers of price for the underlying asset that I am trading?
Intermarket analysis is the study of relationships between different asset classes in the global marketplace. The main goal of intermarket analysis is to help traders identify potential trading opportunities.
These intangibles are invisible to the naked eye yet show very high statistical correlations.
Intermarket analysis can also be used to identify potential reversals. For example, if bonds start to outperform stocks, it could be an early warning sign that a stock market correction may be on the horizon. By paying attention to these types of relationships, traders can adjust their portfolios accordingly and take steps to protect their profits.
Small changes in Interest rates, Crude Oil Prices, and the Volatility of the dollar amongst thousands of other variables affect the decisions companies must make to survive in these challenging times. Trying to determine what these factors are is one of the huge problems facing investors and traders. By understanding these relationships, traders can gain valuable insight into market trends and make better trading decisions.
There is great value to be had in studying and understanding the key drivers of $TR price action.
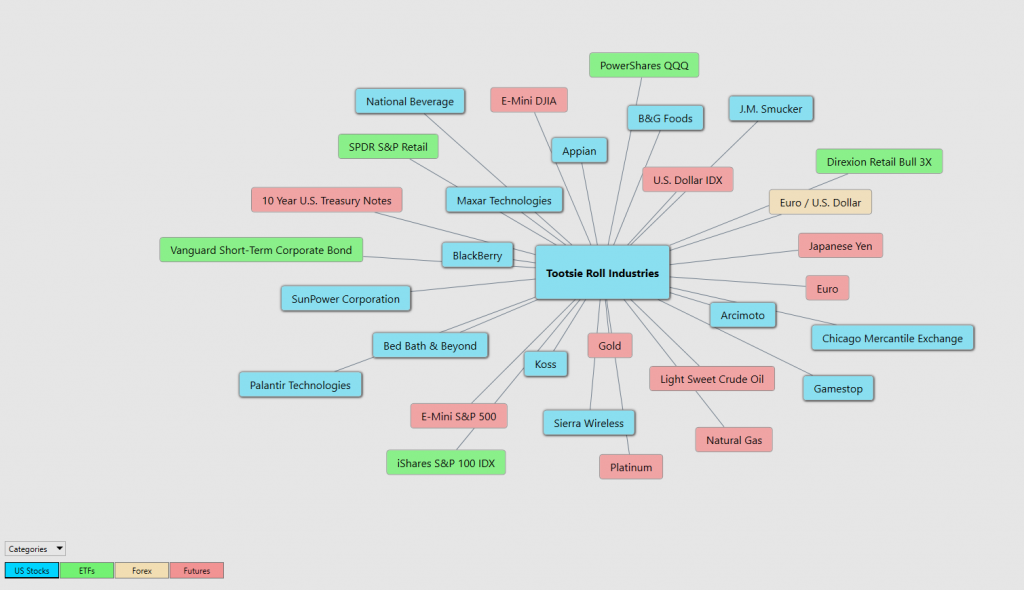
Keep in mind that since $TR is up 26% over the past year these drivers are both positively and negatively correlated. This is an amazing research tool that consistently uncovers future trading and investing gems.
Suggestion for Traders
We try to focus on the present moment to not deceive ourselves with unbridled optimism.
The trend is UP. Make no mistake about that.
$TR has also broken out of a broad trading range. What normally occurs is that it will fall to retest the recent 52-week high boundary and assuming that retest holds the continued uptrend will most often remain in place.
From a fundamental point of view earnings grew by 14.3% over the past year.
The a.i. forecast has been extremely effective at catching 8% to 10% upswings in the stock over the past year. We will be watching it closely during the coming days as we anticipate a pullback.

The company doesn’t have any analyst coverage or host investor calls and has a reputation for remaining tight-lipped. The CEO gives very occasional interviews and speeches, but those haven’t typically been to financial publications or centered on the continuing operations at Tootsie Roll.
Experienced OPTIONS traders might consider selling PUTS and collecting premium on any sharp pullbacks. We advise to pay close attention to the Vantagepoint A.I. daily range forecast for short term buying and selling zones.
Our recommendation is – follow the A.I. trend analysis and practice good money management on all trades.
We will re-evaluate based upon:
Let’s Be Careful Out There!
Remember, It’s Not Magic.
It’s Machine Learning.

IMPORTANT NOTICE!
THERE IS SUBSTANTIAL RISK OF LOSS ASSOCIATED WITH TRADING. ONLY RISK CAPITAL SHOULD BE USED TO TRADE. TRADING STOCKS, FUTURES, OPTIONS, FOREX, AND ETFs IS NOT SUITABLE FOR EVERYONE.
DISCLAIMER: STOCKS, FUTURES, OPTIONS, ETFs AND CURRENCY TRADING ALL HAVE LARGE POTENTIAL REWARDS, BUT THEY ALSO HAVE LARGE POTENTIAL RISK. YOU MUST BE AWARE OF THE RISKS AND BE WILLING TO ACCEPT THEM IN ORDER TO INVEST IN THESE MARKETS. DON’T TRADE WITH MONEY YOU CAN’T AFFORD TO LOSE. THIS ARTICLE AND WEBSITE IS NEITHER A SOLICITATION NOR AN OFFER TO BUY/SELL FUTURES, OPTIONS, STOCKS, OR CURRENCIES. NO REPRESENTATION IS BEING MADE THAT ANY ACCOUNT WILL OR IS LIKELY TO ACHIEVE PROFITS OR LOSSES SIMILAR TO THOSE DISCUSSED ON THIS ARTICLE OR WEBSITE. THE PAST PERFORMANCE OF ANY TRADING SYSTEM OR METHODOLOGY IS NOT NECESSARILY INDICATIVE OF FUTURE RESULTS. CFTC RULE 4.41 – HYPOTHETICAL OR SIMULATED PERFORMANCE RESULTS HAVE CERTAIN LIMITATIONS. UNLIKE AN ACTUAL PERFORMANCE RECORD, SIMULATED RESULTS DO NOT REPRESENT ACTUAL TRADING. ALSO, SINCE THE TRADES HAVE NOT BEEN EXECUTED, THE RESULTS MAY HAVE UNDER-OR-OVER COMPENSATED FOR THE IMPACT, IF ANY, OF CERTAIN MARKET FACTORS, SUCH AS LACK OF LIQUIDITY. SIMULATED TRADING PROGRAMS IN GENERAL ARE ALSO SUBJECT TO THE FACT THAT THEY ARE DESIGNED WITH THE BENEFIT OF HINDSIGHT. NO REPRESENTATION IS BEING MADE THAT ANY ACCOUNT WILL OR IS LIKELY TO ACHIEVE PROFIT OR LOSSES SIMILAR TO THOSE SHOWN.

