

This week’s stock analysis is Virgin Galactic Corporation (SPCE) which highlights an opportunity this month for potential gains.
Virgin Galactic is an American spaceflight company within the Virgin Group. It is developing commercial spacecraft and aims to provide suborbital spaceflights to space tourists. Virgin Galactic’s suborbital spacecraft are air-launched from beneath a carrier airplane known as White Knight Two.
Virgin Galactic’s founder, Richard Branson, had originally hoped to see a maiden flight by the end of 2009, but the date was delayed for several years, most seriously by the October 2014 in-flight crash of VSS Enterprise. The company also aspires for suborbital transport and in 2017, Branson has said that Virgin Galactic was “in the best position in the world” to provide rocket-powered, point-to-point 3,000 mph (4,800 km/h) air travel.
Key to the backstory here is the keen competition between several multi-billionaires who are all competing for private sector dominance of space flight and exploration. Specifically, Elon Musk with his SpaceX venture and Jeff Bezos who in 2019 unveiled his space exploration and travel plans for Blue Origin. This keen competition among the super-wealthy and elite, along with the accelerating pace of technological change has created a backdrop of interest and investment opportunities in private sector space exploration.
Wall Street Analysts
14 Wall Street analysts have issued ratings and price targets for Virgin Galactic in the last 12 months. Their average twelve-month price target is $34.79, predicting that the stock has a possible downside of 1.65%. The high price target for SPCE is $50.00 and the low-price target for SPCE is $19.00. There are currently 5 hold ratings and 9 buy ratings for the stock, resulting in a consensus rating of “Buy.”
What all traders and investors need to understand is that while this industry is cutting edge and glamorous is also considered to be very high risk. Simply consider the disasters which plagued NASA in its space exploration missions. These potential failures are ever present and chew at the foundation of these ventures.
In the last year alone, SPCE has jumped over 300%, then fallen 75%, and then doubled from recent lows. Long term investors have had to have stomachs of steel to ride this volatile asset. By any stretch of the imagination, it has not been easy.
SPCE is clearly a boom or bust investment over the long term. Should Virgin Galactic succeed it will reshape how we think about any form of travel. Should it fail, it could end up an unmitigated disaster.
What traders and investors have to grapple with regarding SPCE is the financials. This is a pre-revenue company. It is spending huge amounts of cash in the hopes of generating revenue from research possibilities and customers purchasing tickets to travel into space. But officially it has not launched. Investors are approaching SPCE recognizing that this is an opportunity to take a gamble on something that could potentially be huge.
The narrative is fascinating to think about. Virgin Galactic can potentially redefine how we think about space and travel in general. Customers will have to cough up $250,000 to travel into space once commercial flights begin. Currently the price tag seems high, but as with all tech ventures that price will drop exponentially as the company becomes well established. The company has built a space port in New Mexico and discussions are on the table to build similar facilities on every continent. \Also in development is a Mach 3 aircraft capable of flying 3 times faster than the fastest commercial jets. That would make trans-Atlantic travel literally last a little more than one hour.
The Commonsense Metrics of SPCE
Over the last 52 weeks Virgin Galactic (SPCE) has traded as high as $62.80 and as low as $14.27. This provides us with an annual trading range of $48.60.
When we divide the annual trading range by 52 weeks, we can determine that the average annual weekly trading range is $.93.
Simply looking at the chart is very valuable because it clearly shows us how volatile SPCE can be.
Over the past year it has had 5 massive up moves which ranged between 60% to 166% higher. In each instance the maximum move occurred in a period of 18 to 27 days.
Likewise on the downside the stock is capable of falling violently. The 5 down moves from peak to bottom saw declines ranging from 29.49% to 76.5% and occurred in a timeframe of 9 to 67 days.
In other words, SPCE is a great swing trading stock. Trends are sudden and powerful creating an opportunity for great profits if you are on the right side of the market at the right time, or quick, large losses if you are wrong in your assessment.
When I look at the chart, I see that all time low for the last year has been tested 4 times. That would indicate that this area of $14.27 provides very strong support.
On the upside is when the sharp pointy areas on the chart are successfully breached the market has a tendency to make violent moves higher very quickly. What this observation clearly communicates is that a very successful trading action in SPCE is to look at placing any buy stops above the pointy areas on the chart to get stopped in as the market is moving higher. BUY HIGH and SELL HIGHER has likely been a good strategy here.
I share this observation on SPCE is because what many traders often do is try to BUY based upon an idea of what is considered to be valuable on a falling price relative to recent price action. Since SPCE has been a very volatile asset, buying low in this market, has a high probability of seeing the price go lower.
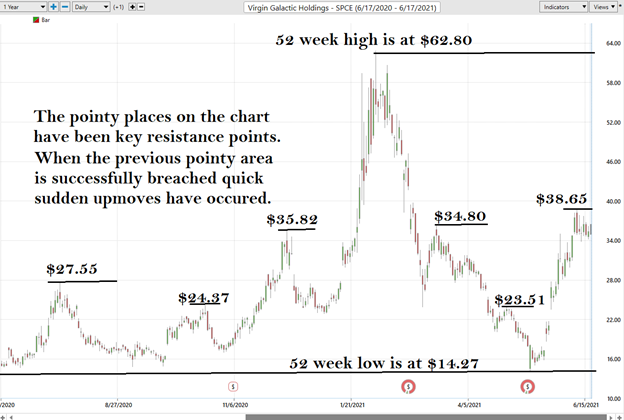
While it does not sound very technical, the pointy places on the chart have provided resistance to the Virgin Galactic (SPCE) stock price. However, when the “pointy place” has been successfully breached prices have moved very suddenly higher.
The Vantagepoint A.I. Analysis
Whenever we look at an asset forecast, we always are comparing what the asset has done, to the artificial intelligence, which is computing its forecast based upon a proprietary intermarket analysis of the most closely correlated assets as well as a neural network computation.
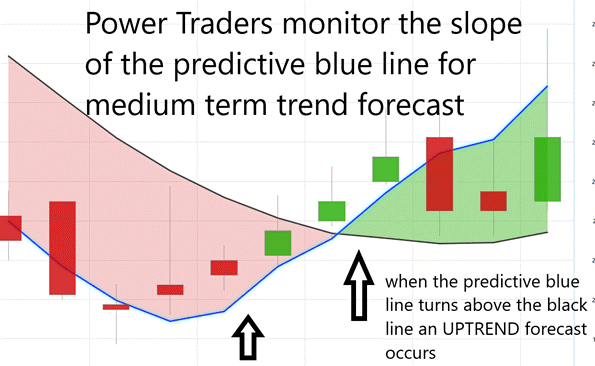
The key to the VantagePoint analysis is the predictive blue line. The slope and general direction of the blue line determines the trend forecast for the market.
The Vantagepoint Software has three separate modules which create a forecast for a Power Trader. They are the predictive blue line, the Neural Net, and the Intermarket Analysis.
An analogy is in order. Think of the underlying trend of the market as a river. A river is supported by smaller tributaries and streams. To navigate the river effectively and to avoid danger as much as possible we want to know the direction of the flow. Ideally, we want to be involved with a trend when all flows are pointing in the same direction.
To accomplish this objective, we need to rely upon a:
- Short Term forecast
- Medium-Term forecast
- Long Term forecast.
The predictive blue line also acts as value zone where in uptrends traders try to purchase the asset at or below the blue line. Power Traders use the predictive blue line in helping to determine both the value zone as well as the trend direction.
VantagePoint traders can analyze the predictive blue line one a short term, medium term, or longer-term horizon to establish a trend forecast. They can also use these forecasts to acquire single and/or double confirmation which will be discussed shortly.
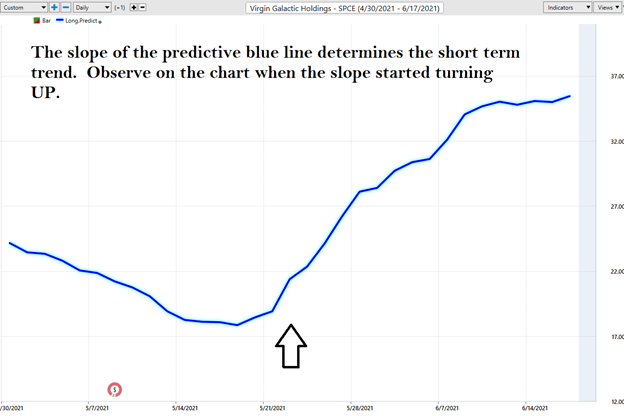
To understand and appreciate how powerful this indicator is, let me show it to you without any of the daily price bars on the chart.
- The slope of the predictive blue line determines the very short-term trend. On the following graphic, monitor that you would want to buy when the slope of the blue line is going up.
- When the slope of the blue line is going sideways you would be anticipating sideways prices.
- Likewise, when the slope of the blue line is going down you would be anticipating lower prices.
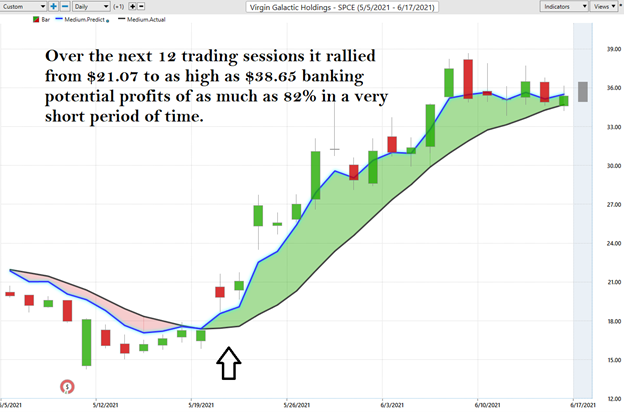
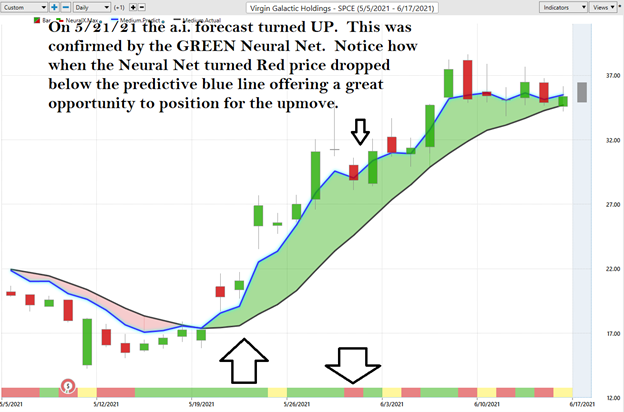
With the daily price bars on the chart and a more complete trend forecast this is what the chart looked like on May 5th. The A.I. provided an UP Forecast of Virgin Galactic (SPCE) on 5/21/21 at $21.07 a share. Over the next 12 trading sessions, it has rallied to as high as $38.65 banking potential profits of as much as 82% in a very short period of time.
Neural Net Index
At the bottom of the chart is the Neural Network Indicator which predicts future short-term strength and/or weakness in the market. When the Neural Net Indicator is green it communicates strength. When the Neural Net is Red it is forecasting short term weakness in the market.
We advocate that Power Traders cross reference the chart with the predictive blue line and neural network indicator to create optimal entry and exit points.
Ideally Power Traders want to buy the asset at or below the predictive blue line whenever possible as that is considered to be the “value zone.”
Fine Tuning Entries and Exits
One of the powerful features in the Vantagepoint A.I. Software which Power Traders use on a daily basis is the Price Range prediction forecast.
This forecast is what permits Power Traders to truly fine tune their entries and exits into the market.
At 6:30pm after the market close the software updates and all of the price predictions change based upon what the machine learning, A.I., neural networks, and intermarket analysis anticipate moving forward.
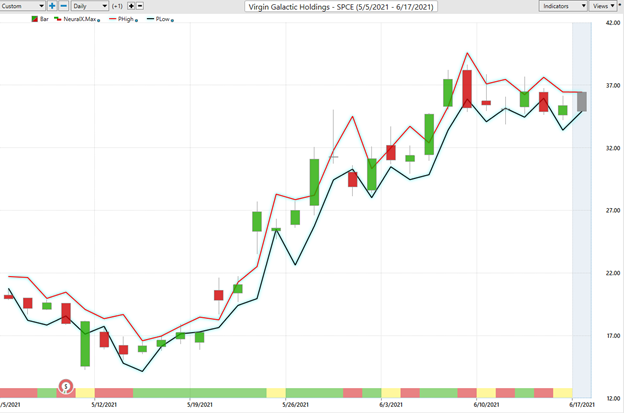
Here is the price chart of SPCE during the most recent drop featuring the Daily Price Range forecast with the Neural Net Index at the bottom of the chart. Day traders who are looking for short term swings in the markets focus on the daily price ranges to place their entry and exit orders.
By utilizing both of these tools simultaneously Power Traders can locate precision entries and exits with high probabilities of success and are capable of exploiting short term swing trading opportunities.
Traders use these VantagePoint tools either independently or together to find great trading opportunities. This is the power at your fingertips when you use artificial intelligence to do your trend analysis. The slopes of the price channels above clearly delineate the trends.
Observe how charting the daily range forecast also clearly delineates a trading channel which is very exploitable by Power Traders. Whenever a price bar is completely out of the predictive range it communicates how sharp and sudden the price action is in the direction of the outlier.
Intermarket Analysis of Virgin Galactic (SPCE)
One of the key questions which continue to plague traders and investors is what is really responsible for moving the stock’s price? The only way you can begin to dissect this powerful question is with intermarket analysis.
We live in a global marketplace. Everything is interconnected. The billion-dollar question for traders is always what are the key drivers of price for the underlying asset that I am trading?
What makes VantagePoint unique and distinct when compared to all other analytical tools is its patented and proprietary intermarket analysis.
Intermarket analysis is a method of analyzing markets by examining the correlations between different asset classes. In other words, what happens in one market could, and probably does, affect other markets, so a study of the relationship(s) is often very helpful to a trader.
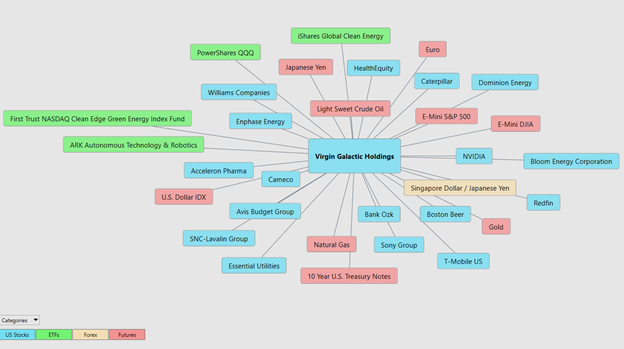
There is great value to be had in studying and understanding the key drivers of SPCE’s price action. While the headlines were screaming about what billionaires are doing with regards to space exploration, let’s look at the most highly correlated financial assets at present to SPCE’s price action.
- ARK autonomous Technology and Robotics
- First Trust NASDAQ Clean Edge Green Energy Index Fund
- Power Shares QQQ
- iShares Global Clean Energy
These four ETF’s have been the key drivers in SPCE’s price action. But you can also see the Stocks and Futures which are also correlated to the most recent price action as well. From this graphic you can dig in to find other alternative trades and investments that tie into the price action of SPCE.
Our Suggestion For Virgin Galactic Corporation (SPCE)
In trading and investing the most important marker is never how much you make but rather how little you lose when you are wrong. While we like the long-term story and narrative of SPCE we consider it to be very high risk. So, the challenge becomes how do you position yourself in this market for long term gains without the risk?
Volatile markets present tremendous opportunity and risk to traders. As we have outlined in this post, we make all our trading evaluations by focusing on the artificial intelligence forecast, the Neural Net, and the daily price range forecast. At the time of this writing, the indicators are all in an UP trend, but the trend is relatively mature in relation to past up moves.
By applying each of the elements in the Vantagepoint A.I. forecast and assembling them together you put the probabilities of success in your favor.
As we have outlined in this post, Virgin Galactic (SPCE) is a highly volatile asset. When it moves in either direction the moves are very forceful and can create fast gains or losses. All the more reason to focus on a short-term swing trading strategy with a twist. What we advise Power Traders to do with SPCE is to continuously keep this stock on your radar and be very conscious of its potential.
Over the past year it has had 5 massive up moves which ranged between 60% to 166% higher. In each instance the maximum move occurred in a period of 18 to 27 days.
Likewise on the downside the stock is capable of falling violently. The 5 down moves from peak to bottom saw declines ranging from 29.49% to 76.5% and occurred in a timeframe of 9 to 67 days.
We suggest that power Traders rely on the A.I. forecast and try and swing trade this stock for short term gains. When you are successful, leave the profits in the stock for the potential long-term play. Here is what we mean. Let’s say you buy $10,000 worth of SPCE and a few days later, you are sitting on a 5% gain of $500. What you could do in this instance, is to take the original principal of $10,000 out of the trade but leave the profit of $500 invested in the stock for the long-term potential benefit. The objective of the trade is to play the long-term with only the profits you generate from your short-term swing trade.
Space exploration could quickly escalate as an industry to mammoth proportions. There are multiple segments and niches in the Space market such as satellites, probes, sensors, testing, research which can grow exponentially for whatever company successfully finds a means to monetize this area. However, while the potential is massive the risk is even larger because it does not take a great deal of imagination to recognize how one simple failure could destroy a company. Anything you do in this area has to be with money you can afford to lose recognizing that over the longer term the probabilities are not in your favor.
Alternatively, simply set aside some money that you can easily afford to lose and simply look to buy Virgin Galactic (SPCE) on pullbacks for the long-term potential gains.
It’s Not Magic. It’s Machine Learning.

IMPORTANT NOTICE!
THERE IS SUBSTANTIAL RISK OF LOSS ASSOCIATED WITH TRADING. ONLY RISK CAPITAL SHOULD BE USED TO TRADE. TRADING STOCKS, FUTURES, OPTIONS, FOREX, AND ETFs IS NOT SUITABLE FOR EVERYONE.
DISCLAIMER: STOCKS, FUTURES, OPTIONS, ETFs AND CURRENCY TRADING ALL HAVE LARGE POTENTIAL REWARDS, BUT THEY ALSO HAVE LARGE POTENTIAL RISK. YOU MUST BE AWARE OF THE RISKS AND BE WILLING TO ACCEPT THEM IN ORDER TO INVEST IN THESE MARKETS. DON’T TRADE WITH MONEY YOU CAN’T AFFORD TO LOSE. THIS ARTICLE AND WEBSITE IS NEITHER A SOLICITATION NOR AN OFFER TO BUY/SELL FUTURES, OPTIONS, STOCKS, OR CURRENCIES. NO REPRESENTATION IS BEING MADE THAT ANY ACCOUNT WILL OR IS LIKELY TO ACHIEVE PROFITS OR LOSSES SIMILAR TO THOSE DISCUSSED ON THIS ARTICLE OR WEBSITE. THE PAST PERFORMANCE OF ANY TRADING SYSTEM OR METHODOLOGY IS NOT NECESSARILY INDICATIVE OF FUTURE RESULTS. CFTC RULE 4.41 – HYPOTHETICAL OR SIMULATED PERFORMANCE RESULTS HAVE CERTAIN LIMITATIONS. UNLIKE AN ACTUAL PERFORMANCE RECORD, SIMULATED RESULTS DO NOT REPRESENT ACTUAL TRADING. ALSO, SINCE THE TRADES HAVE NOT BEEN EXECUTED, THE RESULTS MAY HAVE UNDER-OR-OVER COMPENSATED FOR THE IMPACT, IF ANY, OF CERTAIN MARKET FACTORS, SUCH AS LACK OF LIQUIDITY. SIMULATED TRADING PROGRAMS IN GENERAL ARE ALSO SUBJECT TO THE FACT THAT THEY ARE DESIGNED WITH THE BENEFIT OF HINDSIGHT. NO REPRESENTATION IS BEING MADE THAT ANY ACCOUNT WILL OR IS LIKELY TO ACHIEVE PROFIT OR LOSSES SIMILAR TO THOSE SHOWN.

