

Sometimes the most valuable thing you can do in an analysis of a market is to look at extremes. These outliers are important in that they communicate unusual price behavior which is clearly out of the norm. One way to think about it is to compare an assets price to the temperature in your neighborhood. Here in Florida, the highest temperature on record took place June 29, 1931, at 109 degrees. The Coolest temperature on record took place in Florida on February 13, 1899, at -2 degrees Fahrenheit. Those extremes provide a pretty good idea of what is considered cold and what is considered hot. Likewise, when you analyze any asset, you should always know what the extremes are so you can avoid putting yourself in a precarious situation.
When you study markets for any period of time, you will quickly come to appreciate that at market tops there is extreme euphoria and optimism. The inverse is true at market bottoms which usually create massive pessimism and despair.
We live in truly unique times. Because of all the massive money creation over the past 18 months, we have and continue to see massive pricing distortions in the markets. It’s the main objective of every trader when they see these distortions to analyze and determine whether the price of an asset is seriously trending or are we at an extreme, where a snap back to the average is about to occur.
This past week we saw the S&P 500 Index hit an all-time high on the exact same day that the Federal Reserve’s balance sheet hit its all-time high of over $8 trillion.
Literally, THE EXACT SAME DAY. Coincidence? I think not.
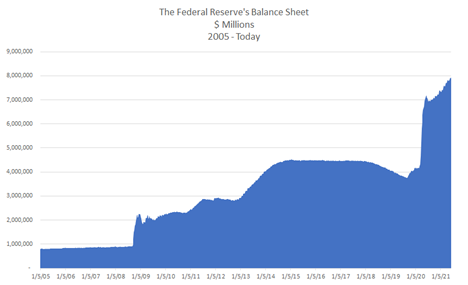
Over the past 13 years, the Federal Reserve and the U.S. Treasury have been massively manipulating the financial markets. We’ve seen stimulus and quantitative easing programs that stretch the boundaries of the imagination, to say the least. Over the last 16 years the Federal Reserve has increased their balance sheet by over $7 trillion with the bulk of it coming in the last 18 months.
Over the last year, the Fed brough the cost of capital down to zero percent and they pumped trillions of new dollars into the economy.
Let’s have a quick look at what inflation is. At its most basic form inflation is too much money relative to the other things in the economy. By “things” I mean literally anything from widgets, cupcakes, shares of the S&P 500 and real estate. The challenge facing the economy today is that there is a finite amount of “stuff” in the economy, and it appears that the monetary authorities continue to add incredible amounts of new money into the system.
In 2008, during the last financial crisis, the Feds balance sheet stood at $800 billion. Today it is ten times larger at $8 trillion. This means that there is a lot more money in the system chasing a lot less stuff and since so many businesses have closed a lot less stuff is being produced. The result is the money is worth less and the stuff goes up in price.
But that’s just the tip of the iceberg. The unintended consequence of all this money printing is it makes anybody who has “stuff” richer, and it makes those who don’t have “stuff” poorer. In other words, if you hold dollars, you get poorer but if you hold assets priced in dollars you get wealthier. We are looking at the worst wealth inequality gap in history. Last October, as we witnessed the massive money printing, we established an investment thesis based upon this scenario. Our conclusion was that moving forward the dollar would be devalued and the best assets to be in would be the stock market, precious metals, and bitcoin.
On top of this, the Fed has stated that they have an inflation target of 2%. Nobody knows exactly how they measure that number anymore with all of the revisions that occur, but producer prices rose by 6% last month alone, and the consumer price index rose by 5% in May. The Feds new talking points are that this inflation is “transitory.” It will go away. Nothing to worry about here. Pay no attention to the fact that real estate prices have gone up by 15% nationally. When somebody buys a house, which has dramatically risen in value, those monthly payments are anything but transitory!
So where do we go from here?
We are witnessing the greatest asset bubble of all time. Every time the market attempts to correct, Wall Street cries for more stimulus bombs and the Fed is there always ready to accommodate. Why stop at $5 trillion? $10 trillion? $20 trillion? To paraphrase Janet Yellen, “It’s time to ACT BIG.” Dollar denominated assets will get pumped to the moon. This is the new normal.
Unfortunately, the bottom 45% of Americans hold no investable assets. They live paycheck-to-paycheck. All their wealth is stored in dollars. And those dollars are being devalued quickly. The rich get richer. The poor get poorer.
Nobody wants to talk about this because it would force the money printer controlled by the U.S. Treasury and the Fed to shut down. There is virtue signaling in terms of paying employees a slightly higher living wage. But the reality is the source of the inflation problem, too much money, chasing too few goods, is political kryptonite.
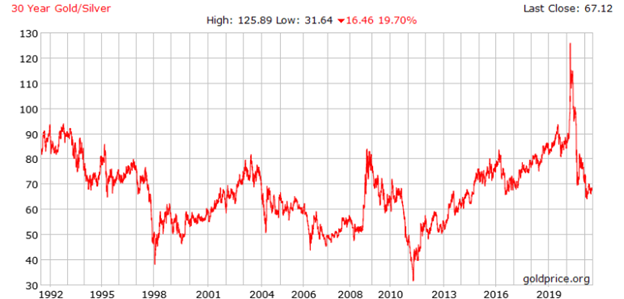
On May 20, 2020, we wrote an article on the Gold Silver Ratio and discussed why it should’ve been on your radar. In a nutshell, we pointed out that this ratio measures the number of ounces of Silver needed to purchase one ounce of Gold. The historical average of the ratio has been around 60. When we wrote the article last May Gold was trading at $1751 and Silver was trading at $17.25. That made the Gold Silver Ratio at 101.5 to 1 which from a pure historical basis is very overvalued.
Here is a long-term chart of the Gold Silver ratio so that you can appreciate this extreme reading when it occurred.
In that article we mentioned the following:
In 1792 the United States set the Gold Silver Ratio to 15:1.
The average Gold/Silver price ratio during the 20th century, however, was 47:1. This means that it took 47 ounces of Silver to purchase one ounce of Gold.
Over the past 20 years, the ratio has averaged right around 60:1.
Here are some historical benchmarks for this ratio:
- 323 BC, this ratio stood at 12.5 to 1 at the time of Alexander the Great’s death
- Throughout the entirety of the Great Roman Empire this ratio stood at 12 to 1
- In 1980, at the time of the last great surge in metals prices the ratio stood at 17
- In 1991, When Silver hit its record low price the ratio peaked at 100. Great profits were available in a matter of months as the ratio reverted to its average
- Over the past 20 years, the ratio has averaged right around 60:1
Since we wrote that article here is what happened.
Gold has rallied about $107 an ounce. Silver has rallied $10.41 an ounce. On a percentage basis Silver has rallied almost 60% while Gold has only rallied 8%. The Gold to Silver Ratio has contracted heavily to 67.19. We correctly anticipated this reversal back to normalcy when the ratio was EXTREME.
As you can see in the longer-term Gold to Silver Ratio chart, we are back in a range that would be considered “fairly valued” over the last 30 years. For experienced investors, the gold-to-silver ratio is one of many indicators used to determine the right (and wrong) time to monitor their allocations of precious metals. When the ratio is low, metals enthusiasts look to buy Gold over Silver. When the ratio is high, they look to buy Silver over Gold.
While this indicator is very helpful at EXTREMES it leaves a lot of room for error when normalcy returns.
In other words, what now?
You can spend your days hunting down information and news stories. As you analyze these factors you will discover that you are dealing with opinions more often than not.
My suggestion, if you really want to save yourself some time and trade with the probabilities overwhelmingly in your favor, seriously consider using artificial intelligence, neural networks, and machine learning in your decision-making process. This is the solution that pro traders use to establish their edge in the markets.
Let me explain very simply by having you see the A.I. forecast in action.
The only thing that matters in trading is your effective anticipation of the trend. Everything else is NOISE.
A good trader needs to answer a handful of questions to be effective. They are:
- What is the trend?
- What is the risk?
- Where should I get in and out?
Artificial intelligence answers these questions very powerfully every day with updated forecasts.
At the hear of the VantagePoint Software is the predictive blue line. This line, its slope and relationship to the price of the asset, determines the trend of the market. To provide you with an idea of the power of this technology simply look at the following silver chart from the past two months which will simply display the graphic of the predictive blue line.
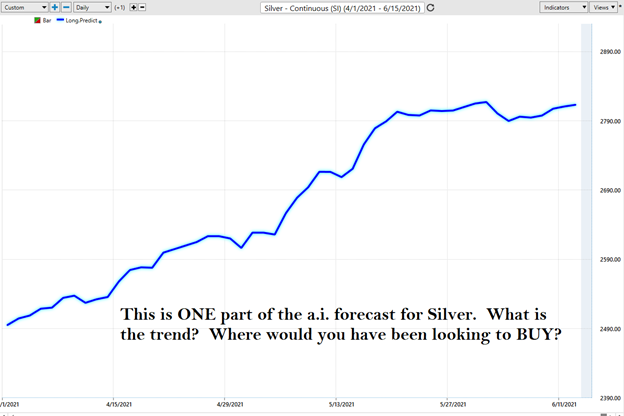
Let me include the actual daily price bars so that you can get an idea of this tool and its effectiveness in trend analysis.
When the blue line crosses above the black line the trend forecast is considered to be UP. The artificial intelligence forecast turned positive on April 7th at $25.28 per ounce.
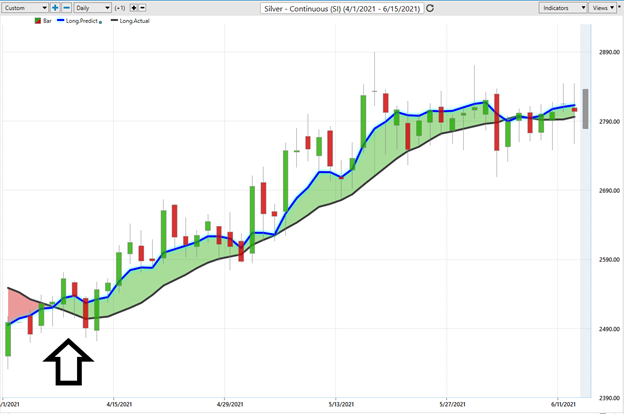
Silver is currently trading at $28.03. With every penny in Silver being worth $50 this move resulted in potential profits of $13,750 per silver contract.
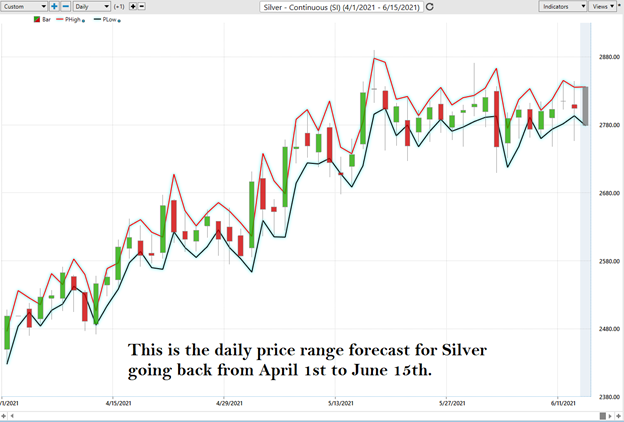
What is amazing about artificial intelligence is that you can fine tune your analysis even further to try and time short term swings in the market. The software allows traders to create a daily price range forecast to fine tune their entries and exits.
Here is what the daily price range forecast looked like over the same period. Observe how the price channel forecast also clearly delineates a very visible trend.
What does all of this have to do with the Gold Silver ratio?
The Gold Silver ratio is very valuable at timing the precious metals when we are trading at extremes. However, when the ratio of this asset approaches normalcy my suggestion is that you utilize artificial intelligence to do trend analysis of the undervalued asset which is Silver in this instance.
We can’t in good conscience advise what is going to happen with the Gold Silver ratio moving forward. My opinion is it will continue to contract and benefit Silver over Gold. But that is an opinion. When it comes to committing money to the markets you should rely upon artificial intelligence as your North Star. Instead of worrying about the trend of the Gold Silver ratio, we advise to focus on a detailed analysis of SILVER.
As inflation heats up our expectation is that the precious metals will benefit from this monetary phenomenon as well. We advise Power Traders to monitor the A.I. forecasts daily to understand the risks, rewards, and reality of this market. The trend in Silver is UP and even though we have seen a big explosive move upwards, the probabilities continue to favor more upside. We continue to monitor the A.I. daily for relevant trading opportunities to minimize the risk.
The race to debase is very real. This economic environment is forcing traders into much shorter time frames as everyone in the marketplace chases yield.
Real asset prices will keep rising as the yield chase intensifies. Cheap capital will keep flooding the market. And our economy will continue its addiction to a horrible monetary stimulus drug that is being handed out like candy in Washington DC.
Do you have the tools and ability to find the strongest trends at right time in this economic environment? What is your plan for maintaining your purchasing power as this trend accelerates?
I’d like to invite you to visit with us at one of our Live Masterclass Webinars where we show how artificial intelligence is the only means to stay consistently up to date on the risk and reward opportunities in this environment.
What all traders and investors want is an accurate, proven solution that alerts you when a high probability trend is unfolding. The Vantagepoint A.I. forecasts have proven to be up to 87.4% accurate in determining the trend three days in advance.
Visit With US and check out the A.I. at our Next Live Training.
It’s not magic. It’s machine learning.
Make it count.

IMPORTANT NOTICE!
THERE IS SUBSTANTIAL RISK OF LOSS ASSOCIATED WITH TRADING. ONLY RISK CAPITAL SHOULD BE USED TO TRADE. TRADING STOCKS, FUTURES, OPTIONS, FOREX, AND ETFs IS NOT SUITABLE FOR EVERYONE.
DISCLAIMER: STOCKS, FUTURES, OPTIONS, ETFs AND CURRENCY TRADING ALL HAVE LARGE POTENTIAL REWARDS, BUT THEY ALSO HAVE LARGE POTENTIAL RISK. YOU MUST BE AWARE OF THE RISKS AND BE WILLING TO ACCEPT THEM IN ORDER TO INVEST IN THESE MARKETS. DON’T TRADE WITH MONEY YOU CAN’T AFFORD TO LOSE. THIS ARTICLE AND WEBSITE IS NEITHER A SOLICITATION NOR AN OFFER TO BUY/SELL FUTURES, OPTIONS, STOCKS, OR CURRENCIES. NO REPRESENTATION IS BEING MADE THAT ANY ACCOUNT WILL OR IS LIKELY TO ACHIEVE PROFITS OR LOSSES SIMILAR TO THOSE DISCUSSED ON THIS ARTICLE OR WEBSITE. THE PAST PERFORMANCE OF ANY TRADING SYSTEM OR METHODOLOGY IS NOT NECESSARILY INDICATIVE OF FUTURE RESULTS. CFTC RULE 4.41 – HYPOTHETICAL OR SIMULATED PERFORMANCE RESULTS HAVE CERTAIN LIMITATIONS. UNLIKE AN ACTUAL PERFORMANCE RECORD, SIMULATED RESULTS DO NOT REPRESENT ACTUAL TRADING. ALSO, SINCE THE TRADES HAVE NOT BEEN EXECUTED, THE RESULTS MAY HAVE UNDER-OR-OVER COMPENSATED FOR THE IMPACT, IF ANY, OF CERTAIN MARKET FACTORS, SUCH AS LACK OF LIQUIDITY. SIMULATED TRADING PROGRAMS IN GENERAL ARE ALSO SUBJECT TO THE FACT THAT THEY ARE DESIGNED WITH THE BENEFIT OF HINDSIGHT. NO REPRESENTATION IS BEING MADE THAT ANY ACCOUNT WILL OR IS LIKELY TO ACHIEVE PROFIT OR LOSSES SIMILAR TO THOSE SHOWN.

