
![]()
Wix.com Ltd. is an Israeli cloud-based web development platform that was first founded in 2006. The company went public on the Nasdaq in 2013. The Wix.com platform allows users to create HTML5 websites and mobile sites using online drag and drop tools. Wix was founded in 2006 by Avishai Abrahami, Nadav Abrahami, and Giora Kaplan. The company is headquartered in Tel Aviv, Israel and employs over 1,800 people.
Wix’s revenue projections for 2022 are $1.92 billion. Wix is a freemium web development platform, which means that users can create a website for free but must pay for premium services such as remove Wix branding from their site, use a custom domain name, or access advanced features such as e-commerce functions. The company makes money through two main channels: advertisements and subscriptions.
The company’s revenue streams come from its subscription-based model as well as from advertisements. Wix’s main competitors are Weebly, Squarespace, and Jimdo. In terms of website builders, Wix competes with several freemium and subscription-based services, such as WordPress.com, Weebly, and Squarespace. These companies all follow a similar business model to Wix, offering users a basic level of service for free but charging for premium features. While Wix is the largest player in the market, the competition is fierce and Wix must continue to innovate to maintain its position.
Wix has been successful in growing its revenue through its subscription-based model; however, it faces competition from other subscription-based services as well as from freemium website builders that offer more features for free.
In this weekly stock study, we will look at and analyze the following indicators and metrics which are our guidelines which dictate our behavior in deciding whether to look for opportunities to buy, sell, or stand aside on a particular stock.
In this weekly stock study, we will look at and analyze the following indicators and metrics as are our guidelines which dictate our behavior in deciding whether to buy, sell, or stand aside on a particular stock.
- Wall Street Analysts’ Estimates
- 52-week high and low boundaries
- Best Case – Worst Case Analysis
- Vantagepoint A.I. Forecast (Predictive Blue Line)
- Neural Network Forecast
- Daily Range Forecast
- Intermarket Analysis
- Our trading suggestion
We don’t base our decisions on things like earnings or fundamental cash flow valuations. However, we do look at them to better understand the financial landscape that a company is operating under.
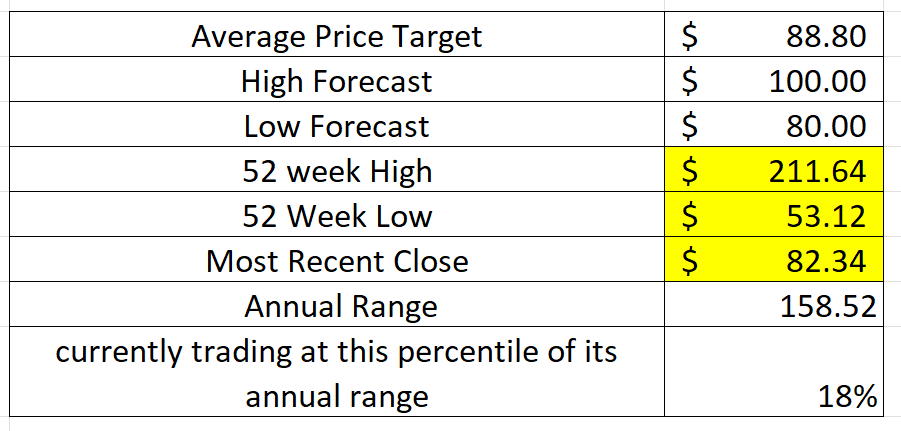
Analysts Ratings
Based on 7 Wall Street analysts offering 12-month price targets for Wix in the last 3 months. The average price target is $88.80 with a high forecast of $100.00 and a low forecast of $80.00. The average price target represents a 7.85% change from the last price of $82.34.
52-week High-Low Chart
Looking at the Long-Term chart of $WIX provides us with the 52-week high and low boundaries.
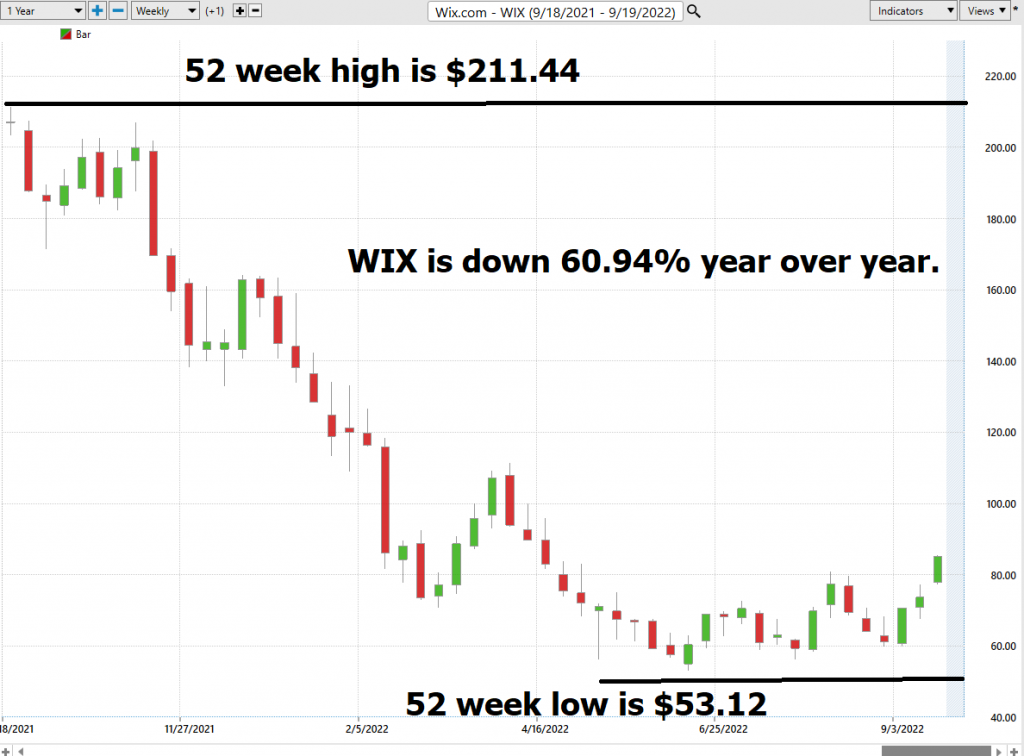
Over the past year we have seen $WIX trade as low as $53.12 and as high as $211.44. This tells us that the average weekly trading range for $WIX is $3.05.
The volatility on $WIX is exceedingly high.
If we zoom out to look at the longer-term chart we can see that $WIX went public in 2013 and grew very impressively stacking gains of almost 1000% in 7 years. Then in the last 18 months, it gave back 75% of those gains.
Place these boundaries on your radar and pay attention.
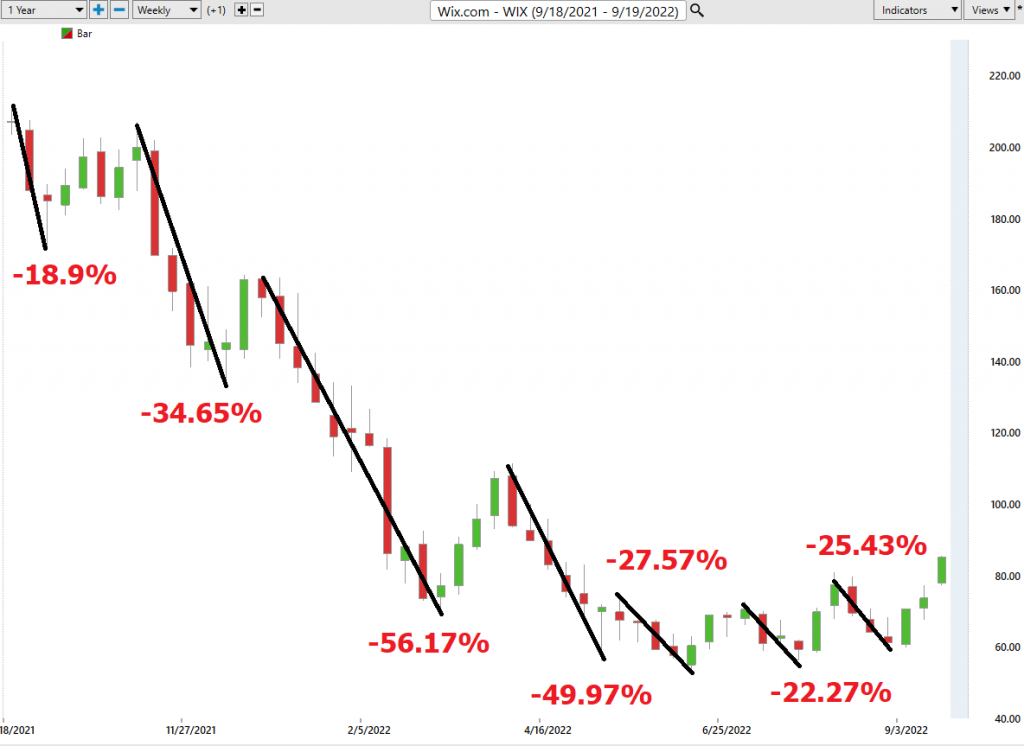
Best Case – Worst Case Analysis
As any experienced trader knows, the stock market is inherently volatile. Over the course of a year, a given stock will experience several rallies and declines. By looking at the best case and worst-case scenarios for a stock, traders can gain a better understanding of the risks and rewards associated with holding that stock. In addition, this information can help traders to anticipate future performance. For example, if a stock has consistently rallied in the face of bad news over the past year, it is likely that it will continue to do so in the future. Similarly, if a stock has experienced sharp declines in the face of good news, traders should be cautious when considering investing in that stock. By understanding how a stock has performed in the past, traders can make more informed decisions about whether to buy or sell that stock in the future.
The purpose of this simple exercise is to see past performance clearly. What types of rallies has the stock had? What type of declines? How has it performed in relation to the broader stock market? All these questions are extremely basic and provide with data that we can use to anticipate future behavior.
For the worst-case scenario, we simply measure the distance between the high price and low price if a higher high is not made. For the best-case scenario, we measure the distance between a low price and a high price if a lower low is not made.
Here is the WORST-CASE scenario:
Next, we compare this performance to the BEST-CASE scenario:
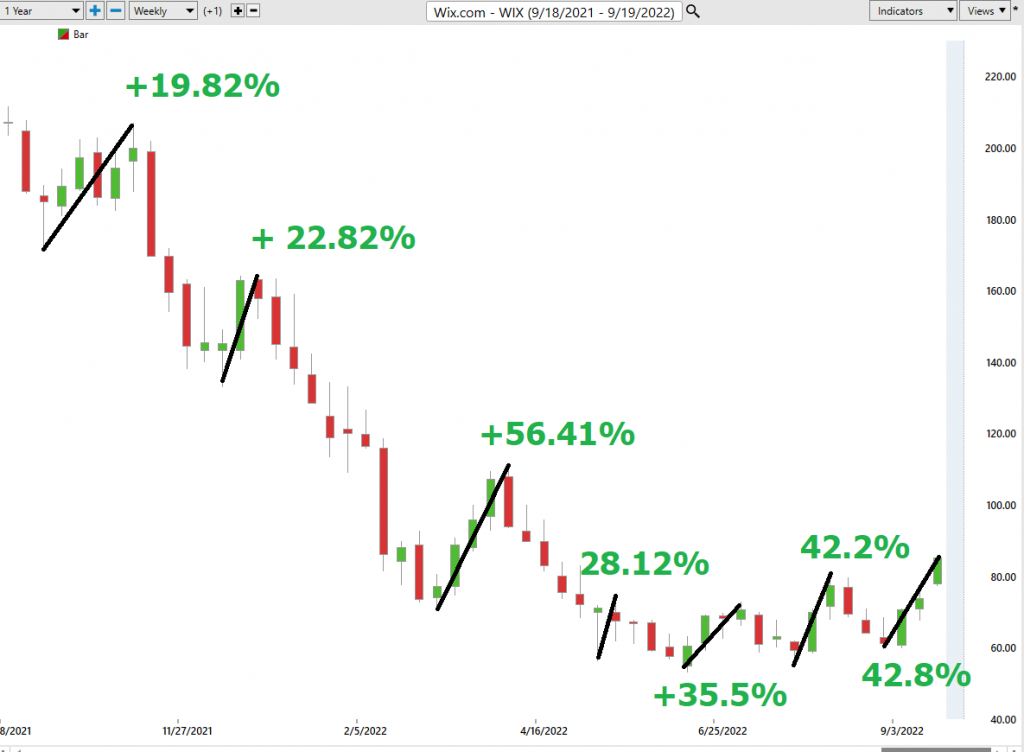
Regardless how you slice the volatility in $WIX this is clearly not a buy and hold investment. $WIX has not been able to maintain gains for more than two or three weeks before a down trend continues. Traders can do very well in this environment if they maintain a hit and run attitude.
MOTION equals opportunity in our book if we can isolate the strength of the trend with artificial intelligence.
Next, we compare $WIX to the performance of the broader stock market indexes.
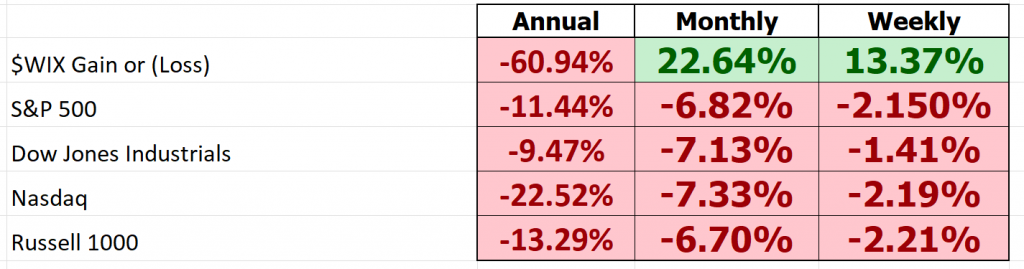
$WIX has outperformed the broader market over the past month, but it has had horrible performance metrics over the past year.
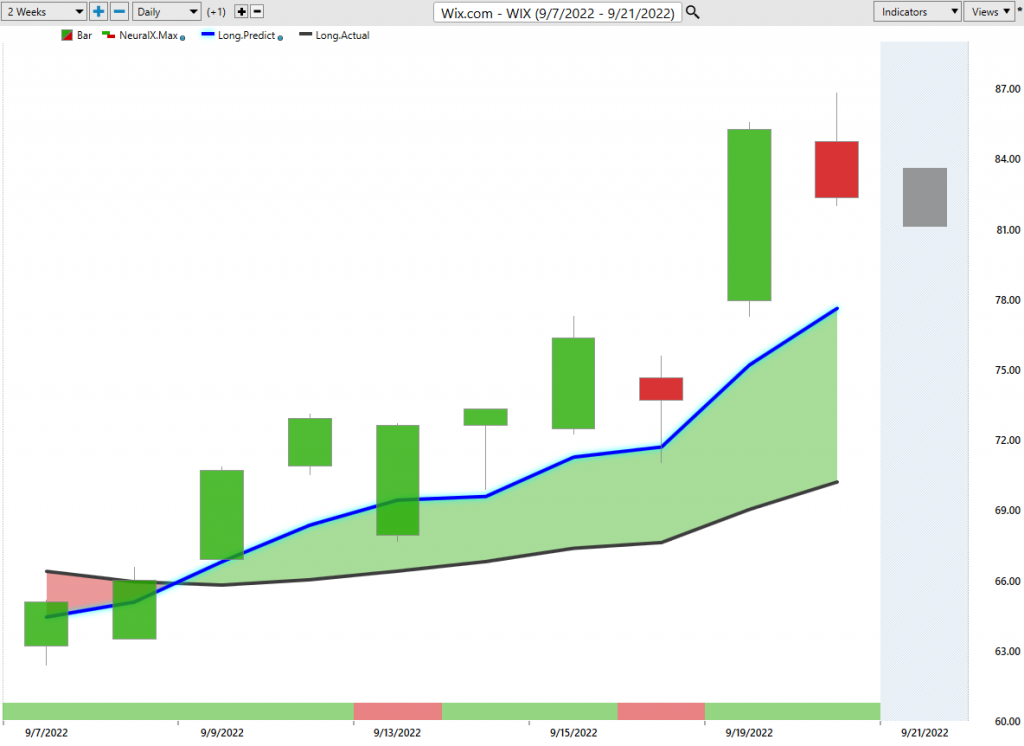
Vantagepoint A.I. Forecast (Predictive Blue Line)
The guidelines we abide by are as follows:
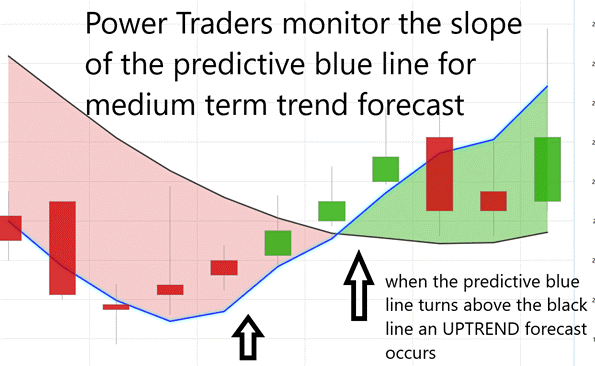
- The slope of the predictive blue line determines the trend and general direction of $WIX
- Ideally, the VALUE ZONE is determined to try and buy the asset at or below the predictive blue line.
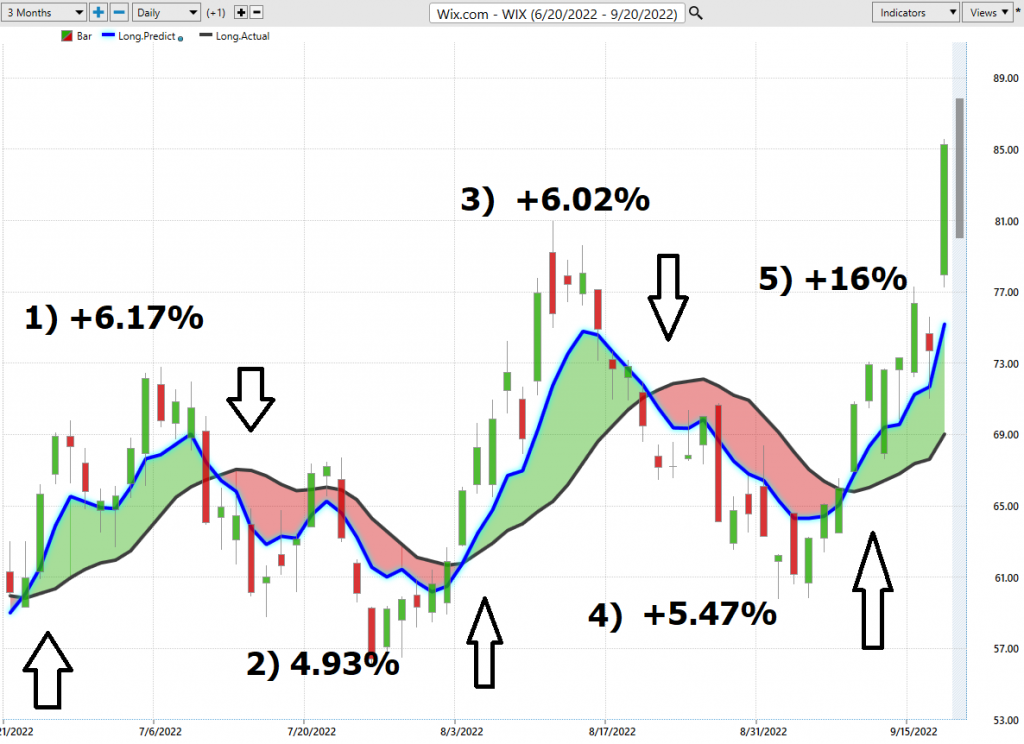
Here is a snapshot of the price action for the last 3 months.
There were 5 trend forecasts which are illustrated on the following charts with the UP or DOWN arrows. The sum of the cumulative gains available was 38.59%. The average gain was 7.72%
Trade #1 Long for 6.17%
Trade #2 Short for 4.93%
Trade #3 Long for 6.02%
Trade #4 Short for 5.47%
Trade # 5 Long for 16%
Fine Tuning Entries with The Neural Net Indicator
At the bottom of the chart is the Neural Network Indicator which predicts future short-term strength and/or weakness in the market. When the Neural Net Indicator is green it communicates strength. When the Neural Net is red it is forecasting short term weakness in the market.
A Neural Net is a computational learning system that uses a network of functions to understand and translate massive amounts of data into a desired output, consistently monitoring itself and improving its performance. Neural indexes are a tool used by traders to help them better time their trades. Neural indexes use pattern recognition and statistical methods to identify patterns in market data. This information is then used to generate a probability distribution that is used to help traders make decisions about when to buy or sell. Neural indexes are just one of many tools that traders can use to improve their trading performance.
Whenever Power Traders are looking for statistically valid trading setups, they look for a DOUBLE confirmation signal. This signal occurs whenever the blue predictive line and the Neural Net at the bottom of the chart suggest the same future expected outcome.
We advocate that Power Traders cross reference the chart with the predictive blue line and neural network indicator to create optimal entry and exit points.
Traders look for confirmation on the Neural Net to position themselves LONG or SHORT in the market. In other words, when the A.I. forecast is green, and The Neural Net is green, that presents a buying opportunity.
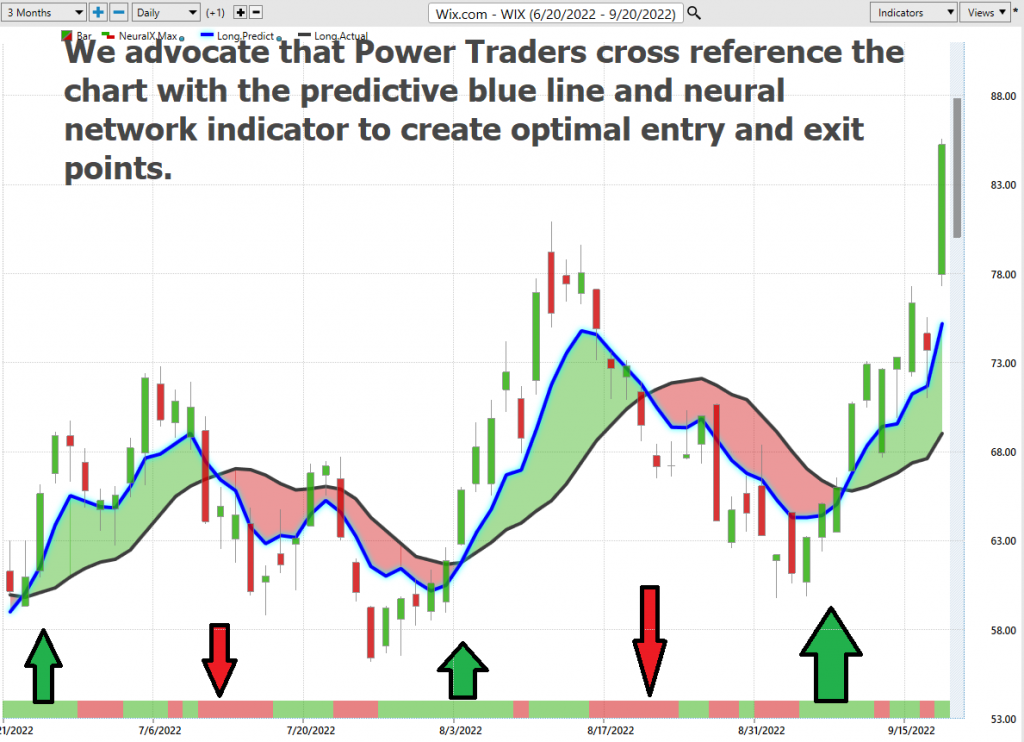
The inverse is also true, when the A.I. forecast is red and the Neural Net is red, that is a SELLING opportunity. The arrows on the chart below highlight the trading zones where Power Traders would’ve been using double confirmation to find a buying opportunity in cross referencing the A.I. forecast with the Neural Net.
Power Traders are always looking to apply both the Neural Network and A.I. to the markets to find statistically sound trading opportunities.
VantagePoint Software Daily Price Range Prediction
One of the powerful features in the VantagePoint Software which Power Traders use daily is the Price Range prediction forecast.
This forecast is what permits Power Traders to truly fine tune their entries and exits into the market.
Every day traders are faced with the anxiety and frustration of wondering where they should be looking to buy and sell the market. VantagePoint’s A.I. makes this decision super easy with the Daily Price Range Forecast.
For short term traders the important question that they have to confront every day is where should I buy? Where should I place my stop? Where should I sell? The VantagePoint Daily Price Range forecast can help them answer this question.
Here is the price chart of $WIX during the most recent two months.
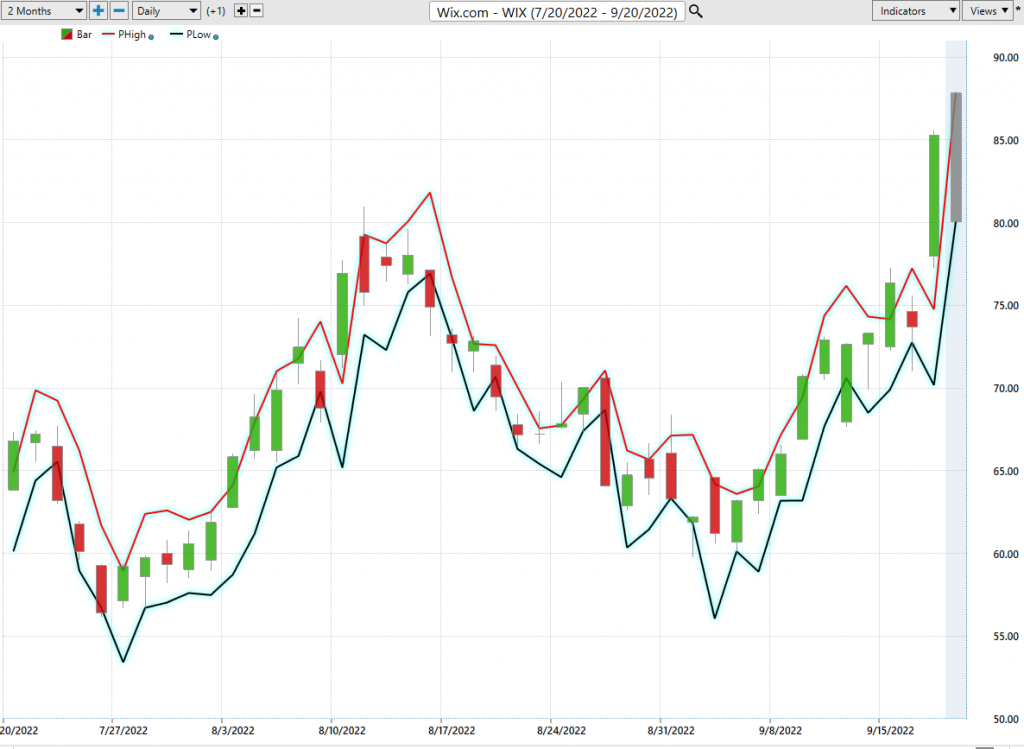
Observe how the channel is very clearly delineated and it is very easy to observe where anticipated support and resistance over the short terms are. Traders look to buy near the bottom of the channel and sell at or above the top of the channel.
Here are some important metrics to consider:
- The average daily trading range over the entire year has been 6% of the closing price.
- The average weekly trading range over the entire year has been 14.3% of the weekly closing price.
- The average monthly trading range over the entire year has been 34.8% of the monthly closing price.
See how the upper and lower bands of the price range forecast form a noticeably clear channel of trading activity as well. Swing traders are always looking for opportunities to buy towards the bottom of the predicted channel and selling opportunities above the top band.
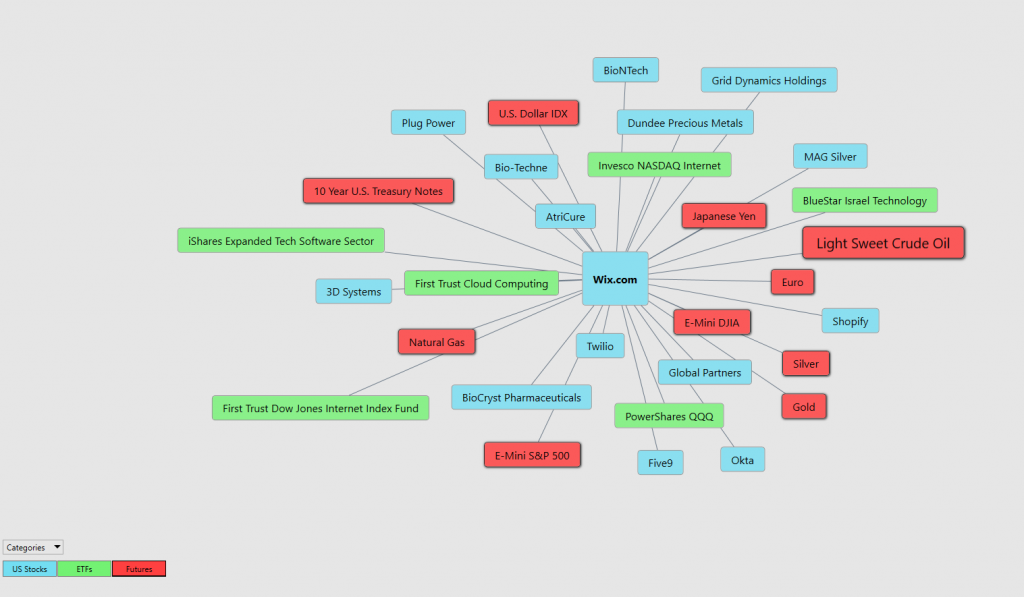
Intermarket Analysis
Power lies in the way we respond to the truth we understand.
What makes the Vantagepoint Software extraordinary is its capacity to perform Intermarket analysis and to find those assets which are most statistically interconnected and are the key drivers of price.
In finance, intermarket analysis is the study of correlations between different asset classes. By looking at how different markets are moving in relation to each other, traders can get a better sense of the large-scale trends that are driving price action. This type of analysis can be used to make more informed short-term trading decisions.
Intermarket analysis is based on the principle that all financial markets are connected. By looking at the relationships between different asset classes, traders can identify opportunities that they might otherwise miss. For example, if the stock market is rising while the bond market is falling, this could be a sign that investors are becoming more risk averse. In this case, a trader might look for ways to capitalize on this shift by selling stocks and buying bonds.
Correlations between asset classes can change over time, it’s important for traders to constantly monitor these relationships. One way to do this is through quantitative analysis, which uses statistics and probability to identify correlations. By analyzing large data sets, traders can get a better sense of which correlations are meaningful and which ones are not.
Intermarket analysis can be a powerful tool for short-term traders. By understanding how different markets are interconnected, traders can better identify opportunities and make more informed trading decisions.
Studying the charts can always provide objective realities in terms of locating support and resistance levels which become noticeably clear on a chart. But we live in a global marketplace. Everything is interconnected. The billion-dollar question for traders is always what are the key drivers of price for the underlying asset that I am trading?
These intangibles are invisible to the naked eye yet show extremely high statistical correlations.
Small changes in Interest rates, Crude Oil Prices, and the Volatility of the dollar amongst thousands of other variables affect the decisions companies must make to survive in these challenging times. Trying to determine what these factors are is one of the huge problems facing investors and traders.
There is immense value to be had in studying and understanding the key drivers of $WIX’s price action. This graphic provides a microcosmic view of what factors have been driving $WIX’s price higher.
Suggestion for Traders
From a fundamental point of view $WIX’s revenue stream is dependent upon subscription income and advertising. A concern that Wall Street analysts have, and management will have to address, is that in a recessionary economic environment it is easy to anticipate that subscription income will decrease should difficult times arise in the economy.
The next earning release date for $WIX is November 16th.
The second overall issue which is driving the narrative for the company is that $WIX is losing money every quarter. Last year they reported negative -$1.57 in earnings for 2021. They are on pace to do slightly better than last year but still not be profitable. These factors validate the volatility of $WIX and confirm the short-term bias that traders must have to be successful in trading this asset.
The trend is UP. It is currently slightly overextended, and we anticipate a pullback to below the predictive blue line.
We would recommend that traders place $WIX on their trading radar. It moves fast and could be a great market for seasoned traders.
However, even seasoned traders should use conservative money management with small allocations to this asset. The trend in WIX can turn very quickly as we have demonstrated in this analysis.
Our recommendation is to follow the A.I. trend analysis as outlined in this stock study and practice good money management on all trades.
We will re-evaluate this analysis based upon:
- Wall Street Analysts’ Estimates
- 52-week high and low boundaries
- Vantagepoint A.I. Forecast (Predictive Blue Line)
- Neural Network Forecast
- Daily Range Forecast
- Intermarket Analysis
Let’s Be Careful Out There!
Remember, It’s Not Magic.
It’s Machine Learning.

IMPORTANT NOTICE!
THERE IS SUBSTANTIAL RISK OF LOSS ASSOCIATED WITH TRADING. ONLY RISK CAPITAL SHOULD BE USED TO TRADE. TRADING STOCKS, FUTURES, OPTIONS, FOREX, AND ETFs IS NOT SUITABLE FOR EVERYONE.
DISCLAIMER: STOCKS, FUTURES, OPTIONS, ETFs AND CURRENCY TRADING ALL HAVE LARGE POTENTIAL REWARDS, BUT THEY ALSO HAVE LARGE POTENTIAL RISK. YOU MUST BE AWARE OF THE RISKS AND BE WILLING TO ACCEPT THEM IN ORDER TO INVEST IN THESE MARKETS. DON’T TRADE WITH MONEY YOU CAN’T AFFORD TO LOSE. THIS ARTICLE AND WEBSITE IS NEITHER A SOLICITATION NOR AN OFFER TO BUY/SELL FUTURES, OPTIONS, STOCKS, OR CURRENCIES. NO REPRESENTATION IS BEING MADE THAT ANY ACCOUNT WILL OR IS LIKELY TO ACHIEVE PROFITS OR LOSSES SIMILAR TO THOSE DISCUSSED ON THIS ARTICLE OR WEBSITE. THE PAST PERFORMANCE OF ANY TRADING SYSTEM OR METHODOLOGY IS NOT NECESSARILY INDICATIVE OF FUTURE RESULTS. CFTC RULE 4.41 – HYPOTHETICAL OR SIMULATED PERFORMANCE RESULTS HAVE CERTAIN LIMITATIONS. UNLIKE AN ACTUAL PERFORMANCE RECORD, SIMULATED RESULTS DO NOT REPRESENT ACTUAL TRADING. ALSO, SINCE THE TRADES HAVE NOT BEEN EXECUTED, THE RESULTS MAY HAVE UNDER-OR-OVER COMPENSATED FOR THE IMPACT, IF ANY, OF CERTAIN MARKET FACTORS, SUCH AS LACK OF LIQUIDITY. SIMULATED TRADING PROGRAMS IN GENERAL ARE ALSO SUBJECT TO THE FACT THAT THEY ARE DESIGNED WITH THE BENEFIT OF HINDSIGHT. NO REPRESENTATION IS BEING MADE THAT ANY ACCOUNT WILL OR IS LIKELY TO ACHIEVE PROFIT OR LOSSES SIMILAR TO THOSE SHOWN.

