

With the S&P 500 price very close to all-time new highs at 1,576.20 the chances of a pullback are growing significantly. Here’s why.
Tracking correlated markets can be of great benefit and can help with labelling wave counts.
Since the March 2009 low the U.S. stock and bond markets have been tracing their swing points inversely. The iShares 20Yr+Treasury bond fund (TLT) meets resistance and the S&P 500 finds support and vice versa.
The S&P 500 has called up the alternate count that was offered to the overlapping advance from the October 2011 Higher Swing Low. [Read Madden’s article from late February here. ]
THERE ARE RULES
Each wave structure within the Wave Principal (WP) has a set of rules and guidelines that govern price action for that structure. An important rule of the Ending Diagonal is that each wave of a contracting Ending-Diagonal must be shorter that it’s previous. For example wave three must be shorter than wave one and wave five must be shorter than wave three. The previous count was negated this week because wave five became longer than wave three. Therefor the preferred count now is that the end of the third wave of a contracting diagonal may very nearly in place. Price would be expected to drop into the 1,421 area at a minimum and then push higher in a final fifth wave to complete the larger degree pattern.
BOTTOM LINE
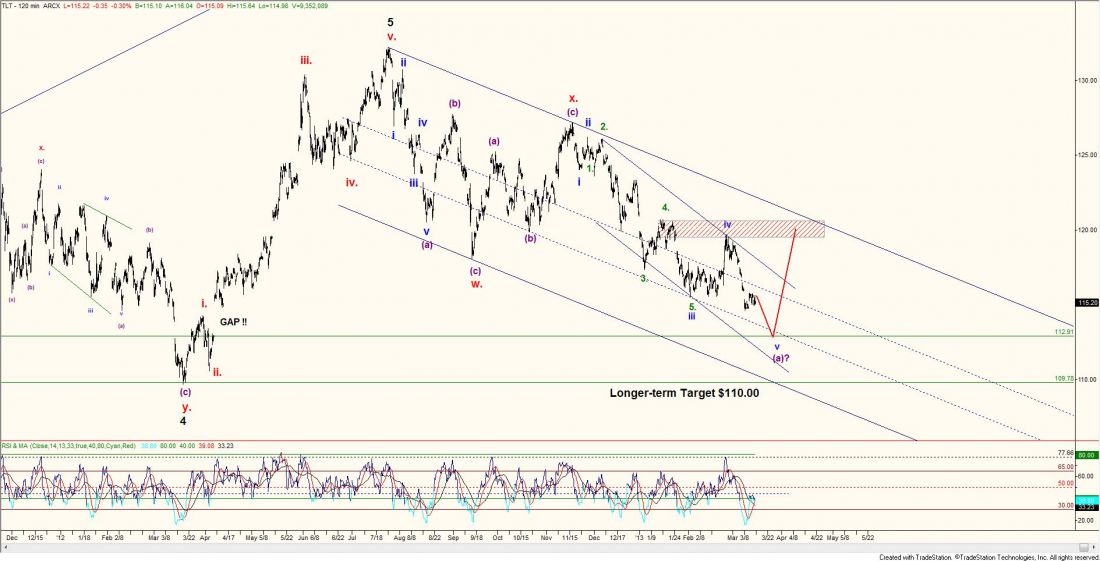
TLT is not far off completing a five wave impulse lower which when complete should correspond with a pullback in the S&P 500. Watch for a reaction from the open gap around $113.00, an initial target to $120.00 area.

