The S&P 500 cash index ($SPX) closed at 1921.22 on Friday, down 67.65 points for a 3.4% net weekly loss. In ‘normal’ times, that would be a screaming headline; S&P crashes.
But after the fireworks of the last couple of weeks, it looks like shelter from the storm… and that is misleading. Down less is not the same as up.
In fact the index erased the entire gain from the retracement after and confirmed that the “recovery” was just what we described: an oversold bounce that melted away as soon as the market paused long enough to catch its breath.
The trading behaviour confirmed that assessment: The sell-off began again on Monday and closed Friday at the low end of the weekly trading range.
The Death Cross
In classic Dow Theory, long-term investors should begin to gather their belongings and quietly leave the room when they start seeing what traders call “the death cross” – the 50-day moving average dropping below the 200-day moving average.
That officially happened last Monday for the SPX, but it has been happening for much longer in other markets, including almost all the major indices – the DOW 30, Russell 2000, NYSE Composite, Wilshire 5000, S&P500, S&P midCap 400 – and more than 300 individual large-cap stocks.
The long uptrend is clearly changing direction, and soon – this week or next perhaps – it will threaten the long-term support zone at 1862-1820.
Commentators may blame this on the Chinese crash or the dump in oil. But we think the major issue is the dramatic shift in market sentiment. Once the basic posture of traders changes, it is hard to change it back. Who will buy today, if they believe the price will be lower next week?
This week
The best hope for a recovery this week is an early move and close above the 1950 level. If that happens – and the S&P500 mini futures are currently trading around 1940 in the overnight market – there is at least the possibility of a move back up to or beyond the recent high around 1993. If it doesn’t, expect lower lows.
We see more down than up in the charts. There is a bearish continuation formation developing in the SPX chart with a likely target below 1900. A break below 1900 will bring the sellers out in force.
Even if we duck the bullet this week – there are only four trading days, remember – there is more drama ahead. The following week (starting Sept. 14) is Quadruple Witching Week, when everything expires, everything is reset and the price swings like crazy. The Fed will be announcing its latest interest rate actions right in the middle of it all. Expect excitement.
The futures (ESU5)
The S&P500 mini futures (ES) have a developing resistance line around 1975-70 and support around 1875-80. If the price moves outside the resistance or support areas it could trigger a momentum run up or down to the next level.
On the upside, any attempted rally will meet strong resistance that will restrict a price advance. On the downside, there is little additional support, and a break below 1898 could push the ES down to 1875 or lower toward 1850-31 zone for testing. Our traders will still focus on the short side.
The major support levels for Tuesday: 1938-35, 1922-18.50, 1905-00, 1875-50.50;
major resistance levels: 2015-18.50, 2029-28.50, 2035-38
For more detailed market analysis from Naturus.com, free of charge, follow this link
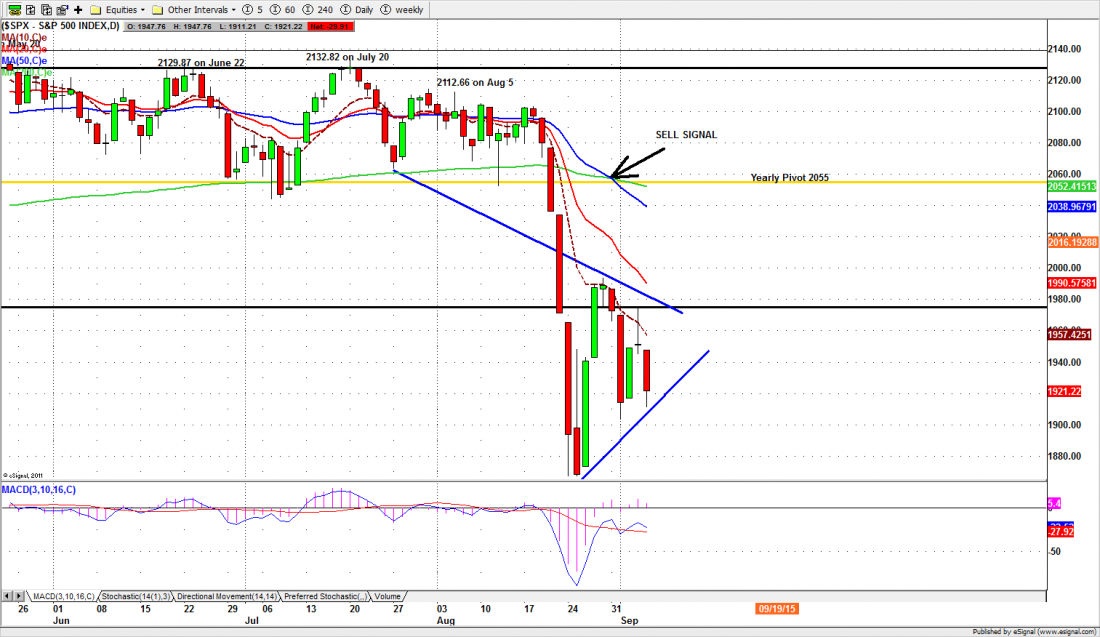
Chart: S&P500 cash index ($SPX) daily chart to Sept. 4, 2015