 In early Novevmber 1999, the Dow was at 10,500.
20 Years later, it’s a different Dow that sits at 10,000 than we had back them with AlliedSignal, Citigroup, Eastman Kodak, GM, International Paper, Minesota Mining, Philip Morris and SBC Communications now replaced by Cisco, Chevron, Hwelett Packard, Kraft, 3M, Pfizer, Travelers (who became Citigroup in 1999, ironically), Verizon and Exxon. The Dow finished 1999 1,000 points higher, at almost exactly 11,500 despite the fact that many people thought computer clocks would fail to roll over and wipe out Western Civilization on January 1st.
Not even 60 days later, the Dow was down 2,000 points in what used to be the second worrst market collapse in history but it took us all the way until Septermber of 2003 (33 months) for the Dow to really bottom out at 7,500, where we consolidated until early March and then flew up all the way back to 10,500 again to close they year. We flatlined between 10,000 and 11,000 until the Summer of 2006, when the market went into overdrive, led by financials and commodities all the way to Dow 14,000 in October of 2007, where we bottomed out this March (18 months), once again at 7,500 (discounting the crazy, panic-spike down in March) and, once again, we are back at 10,000 in November.
 One of the key reasons that “this time it’s different” is that inflation has now become a friend of the markets. Just look at the Dow – Oil is a COST to most companies, high oil prices benefit only oil producers yet we’ve replaced an Auto Manufacturer (GM) who was wiped out in part due to the high price of fuel, with CVX, who makes that fuel. GM lost hundreds of thousands of productive American jobs in their collapse – were those people hired by Chevron? Hardly – it takes the same 67,000 people at Chevron to charge you $3 a gallon for gas as it does when gas is at $1.50, it’s all a question of profits for the oil companies and, sadly, 75% of that exess money gets shipped overseas and does nothing to benefit the US economy.
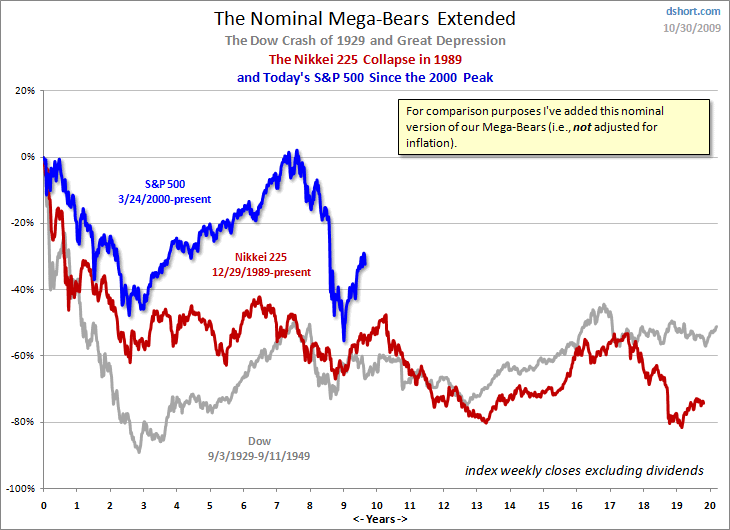
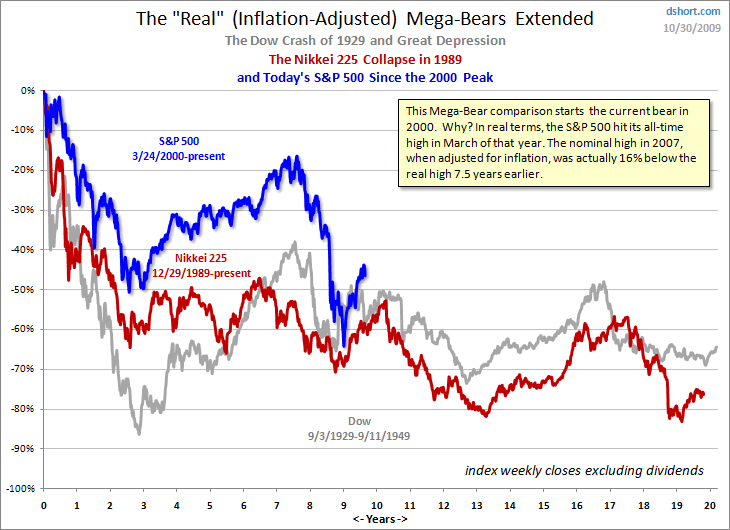
If we were to adjust the S&P for inflation in the above chart, you can see that our recent run-up looks a little less impressive in the grand scheme of things. Like the Dow, the S&P has altered considerably in the last 20 years but think about the disproportionate weighting now given…


