

A simple and potentially powerful tool within technical analysis is the moving average. It is easy to calculate and even easier to understand. A “simple moving average” is calculated by averaging the closing price of an asset over a specified timeframe.
IT’S VERSATILE
There are many ways to use moving averages as a technical analysis tool.
o Traders may use a moving average to spot an existing trend or the start of a potential new trend.
o They may be used to gauge the strength of a trend.
o They often serve as potential support or resistance for the underlying asset.
o They may be useful in determining entry and exit points.
o They can be used on any timeframe (intraday, daily, weekly or longer).
COMBINE THEM
A popular strategy is the use of multiple moving averages. By using more than one timeframe, a trader can gauge the slope of a shorter term moving average versus that of a longer term moving average. This information can help to determine the strength of an existing trend.
For example, if a short term moving average is rising or falling at a faster rate than a longer term average, then one might conclude that the price trend itself has been accelerating. Or, if a short term moving average is rising or falling at a slower rate than a longer term average, then one might conclude that the price trend may be decelerating or weakening.
THEY DO LAG
Since moving averages are considered a lagging indicator, current price action is the most important component in forecasting whether momentum may be changing.
For the purpose of this discussion, we will use 20-period simple moving averages (MA) for a shorter, more sensitive price trend. For a longer term price trend, we will use a 50-period simple moving average.
Figure 1 below is a daily chart of crude oil futures.
On the chart, the “red” line is the 20-day MA and the “blue” line is the 50-day MA. Notice that in late-April the “red” line decelerated and began moving virtually parallel to the “blue” line. This is indicating indecision in the price action.
However, once price decisively broke lower in the first week of May, the “red” line began to accelerate lower at a faster rate than the “blue” line and has continued to incrementally to do so throughout the extent of this graph. Looking forward, if the sideways price action that has persisted in the early days of June continues, one would expect the “red” line to begin leveling out again or possibly turning higher.
If price breaks lower from the congestion area, one would expect the “red” line to continue to accelerate lower at a faster pace than the “blue” line and, in turn, confirm that the trend is beginning to strengthen again.
TREND REVERSAL
Another way to use multiple moving averages is to watch for crossovers. Crossovers occur when a short term moving average crosses through a long term moving average. These crossovers can sometimes indicate a trend reversal may be happening. The key to this indicator is, “waiting for confirmation.” Having patience and waiting for a basic set of rules to occur may help a trader spot a true trend reversal signal and avoid the false signals that can potentially lead to large losses.
YOUR CHECKLIST
The following five questions can serve as a checklist to help determine the possible strength of an asset’s uptrend or downtrend and help to avoid getting a false crossover signal:
1. Is the 20-day moving average sloping up or down?
2. Is the 50-day moving average sloping up or down?
3. Is the 20-day moving average above or below the 50-day moving average?
4. Is the asset’s price above or below the 20-day moving average?
5. Is the asset’s price above or below the 50-day moving average?
The crossing of the short term moving average through the long term moving average can be a great clue as to whether a trend is being established. The foundation for an uptrend is to have a positive answer for as many of the questions as possible. Conversely, the foundation for a downtrend is to have a negative answer for as many of the questions as possible. As with any indicator, moving average crossovers are not infallible and can provide false signals. Trend analysis should be confirmed by other indicators and/or fundamentals.
Figure 2 below is a weekly bar chart of the gold futures contract.
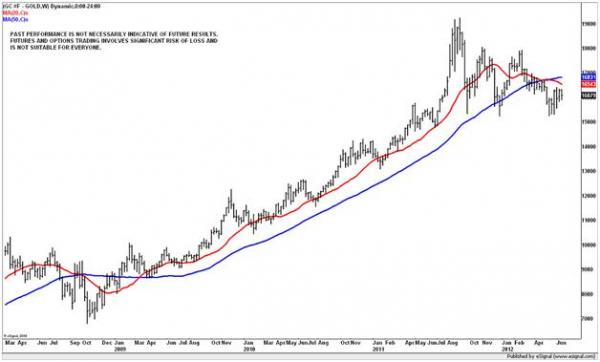
Notice that in late 2008 a bearish signal was given and each question on the checklist above confirmed the signal. However, price soon began to climb back above the moving averages and the checklist became mixed. Soon the checklist began to provide positive responses and it remained so for an extended period of time. Also notice how the moving averages provided support throughout the trend.
In late 2011, the moving average support began to fail and the rules of the checklist, once again, became mixed. In the spring of 2012, a bearish crossover occurred. However, the 100-period moving average had not rolled over. As mentioned earlier, the key to this indicator is, “waiting for confirmation.” Having patience and waiting for a basic set of rules to occur may help a trader spot a true trend reversal signal and avoid the false signals that can potentially lead to large losses.
THREE CHOICES
An asset can only be doing one of three things: trending higher, trending lower or trading sideways (range bound). Price action such as higher highs and higher lows coupled with upward sloping moving averages are identifiers of an uptrend. Conversely, lower lows and lower highs coupled with downward sloping moving averages are identifiers of a downtrend.
THE TAKEAWAY
Finding ways of identifying the onset of a new trend in an asset may be a useful tool when trading. However, it is not the Holy Grail and should be confirmed by using other indicators that fit the trader’s personal style. Positions should be monitored closely as there is substantial risk of loss in trading futures and options. Such an investment is not suitable for everyone as an investor could lose more than the original investment.
Moving averages may help a trader find a trend and perhaps capture more of a move.
Remember, the trend is your friend.

