From Bloomberg yesterday, ‘Oil declined the most in eight weeks after dropping $2.67 a barrel in six minutes during the last 30 minutes of floor trading.’
We get the sense that the cyclical rally has run into a rather formidable brick wall; the kind of wall that might hold until we see an improving trend in the weekly U.S. jobless claims numbers. To explain we return to two charts that we ran in yesterday’s issue.
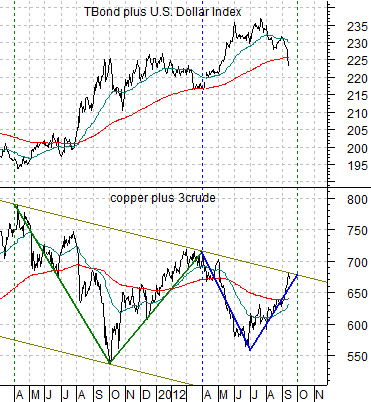
First is a comparison between the sum of copper and crude oil (copper in cents plus three times the price of crude oil in dollars) and the combination of the U.S. 30-year T-Bond futures plus the U.S. Dollar Index.
Our focus is on the sum of copper and crude oil. It declined for six months through September of 2011 and then rallied for six month back to the channel top. It moved lower for three months through June and then rallied for three months into September. Once again it is back to the channel top.
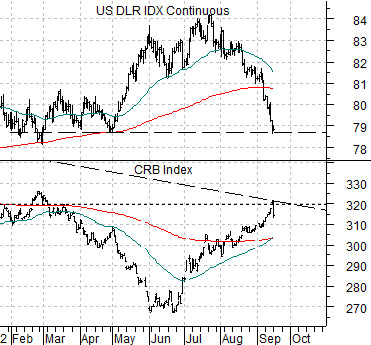
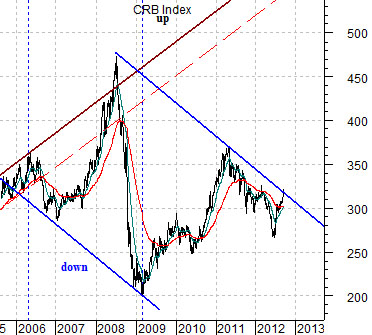
The chart positioned next shows the CRB Index. The argument is that the down trending channel began to form in 2006 (two years after the Fed started to tighten credit) with the channel top being made in 2008 (the end of the 5-year trend initiated with falling bond prices in 2003).
The bearish slope of the channel defines the way the markets have been struggling with an absence of cyclical growth since the 2006- 08 time period. The last serious test of the channel top was made in the spring of 2011 which, of course, was the time frame associated with the start of the series of crises that have swept through the Eurozone.
The point is that the CRB Index has rallied to the upper edge of a negative price trend. The sum of copper and crude oil has rallied to the upper edge of a negative price trend. The cyclical pivot that we were looking for would be enough to bust both the CRB Index and the sum of copper and crude oil through resistance and back into bullish trends. If the rally is going to pause, stall, or even fail this is the place where it should happen. That is why the knee-buckling and seemingly out-of-the-blue price break for crude oil was so intriguing.
Equity/Bond Markets
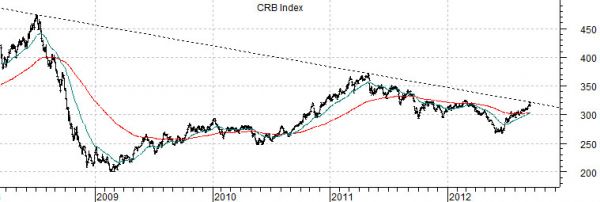
Below we have added a somewhat larger chart of the CRB Index to show how the rally appears to have run into the down trending resistance line that connects the 2008 top with the highs from early 2011.
Keeping in mind the carnage witnessed through the second half of 2008 and the bearish resolution for cyclical asset prices through the second and third quarters of 2011 we have to admit that the CRB Index stalling out and turning lower at this juncture is somewhat unnerving.
Our view is that while we appreciated the way the stock market rallied we were bothered by the ‘way’ it rallied or, perhaps, by the intermarket levers that helped push prices upwards.
To explain… at top right is a chart of the U.S. Dollar Index (DXY) futures and the CRB Index.
Commodity prices rose in response to a weaker dollar. In a sense the CRB Index went from 320 in March with the DXY around 79 down to 270 into June on a stronger dollar before moving back up to 320 as the dollar corrected back to 79.
Our view is that trend from the last decade was powered by dollar weakness and our conviction is that the markets don’t do the same thing two decades in a row.
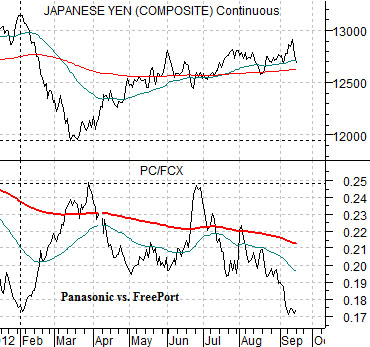
The chart at middle compares the Japanese yen futures with the ratio between the share prices of Panasonic (PC) and FreePort McMoRan (FCX).
PC is part of the ‘Japan’ theme and represents one facet of the consumer discretionary trend. FCX is more of a ‘China’ theme and relates to Asian capital spending.
The expectation was that the trend for the current decade would be driven by strength in the consumer discretionary and, to a less extent, tech sectors. In other words… the PC/FCX ratio should rise. In order for this to happen the Japanese yen has to weaken.
The point? We had a frantic cyclical rally on dollar weakness instead of yen weakness. This pushed the commodity cyclicals higher instead of the consumer cyclicals. We would prefer to see the trend driven by yen and bond price weakness instead of being levered up off of dollar weakness.