

Apple (AAPL) is currently a technical analysis dream.
First and foremost, it is clear to me that AAPL has formed one of the largest and most gorgeous head and shoulder patterns I personally have ever seen or come across.
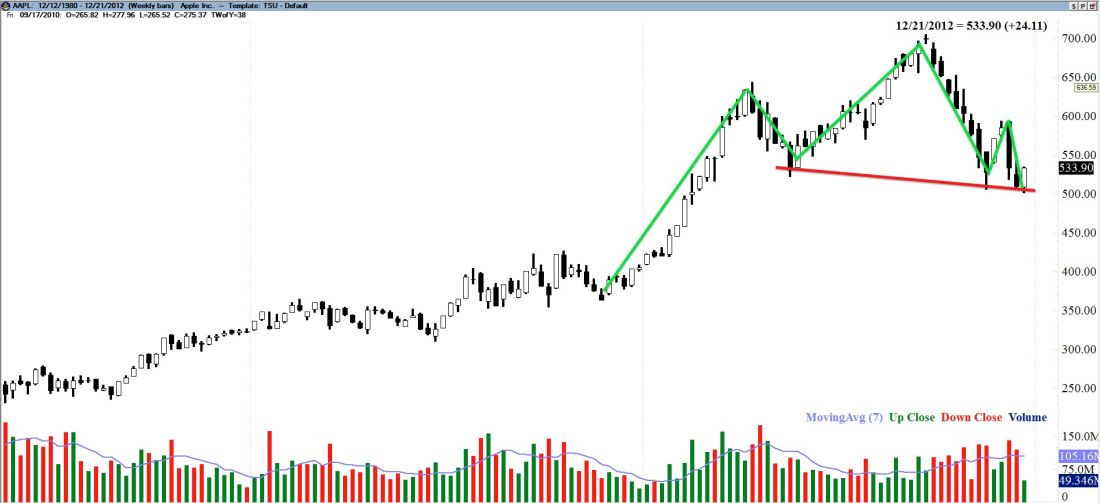
This is a leaning head and shoulders pattern on a weekly chart, which means that it carries a significant amount of weight. The second shoulder is currently lower than the first shoulder. The neckline is leaning and has textbook increasing volume on the second shoulder.
Continuing the bearish brushstrokes, you can also notice that AAPL formed what many would call an island reversal, which is one of the strongest reversal chart patterns found.
It is a terminal pattern and in the case of a bearish island reversal, it’s found at the “tippy top” of the bullish trend, al la NFLX in July 2011. An island reversal is formed when the stock has an exhaustion gap and then a breakaway gap. They only way to know we have had an exhaustion gap is in hindsight as exhaustion gaps are filled.
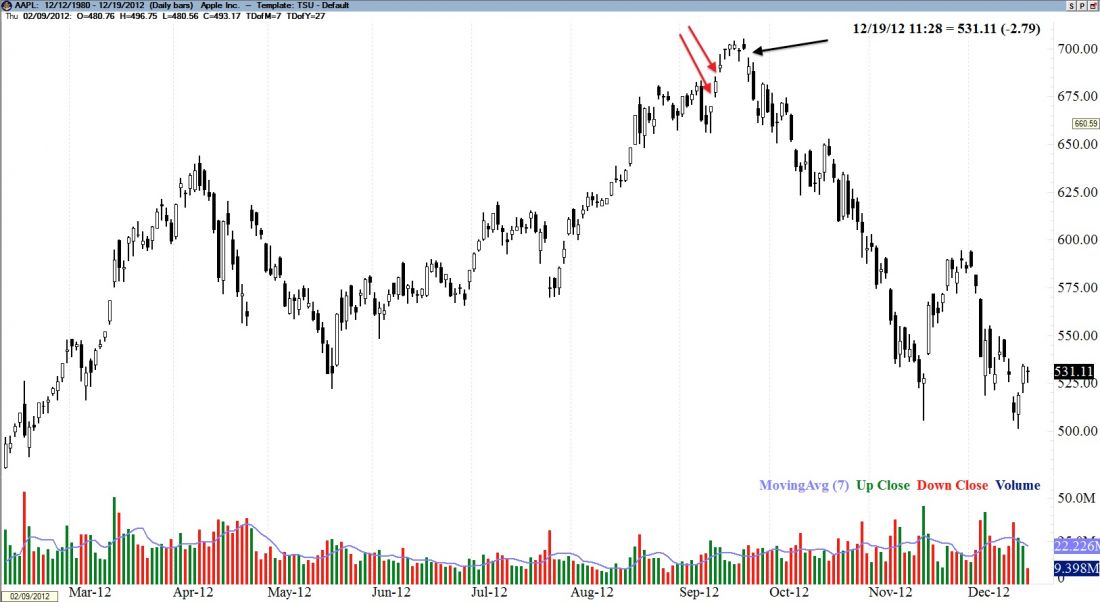
The red arrows in September (when the news was most bullish on AAPL) show the two exhaustion gaps. In both cases there was high volume or, in this case, exhaustion volume. The black arrow shows the breakaway gap, meaning the gap had not been filled yet. Then the “apple dropped from the tree” some 200 points in less than 2 full months. During this higher high in September, the moving average convergence divergence (MACD) showed bearish divergence. Another non-encouraging sign for the bulls, to say the least.
Now you’re begging for me to tell you my thoughts present date, right? Because anyone can read the left, it’s how you read the right that pays them bills! AAPL had a really nice pennant just a few days ago, complete with declining volume, higher lows and lower highs. We broke out of that continuation pattern with a gap and great volume and traded right to a picture perfect target: the bottom of the giant wick on the 11/16/12 candle. At this point, I have two scenarios. If we get a close below $499.90 the likelihood of hitting our $475 long term trend line is very high. If we do get a close above $540.80, we would have broken bullish through a Fibonacci fan line from the bottom and likely test the long-term moving averages from the bottom. Additionally, there are some bearish breakaway gaps in early December that will be tested if we continue strongly past $540.80.
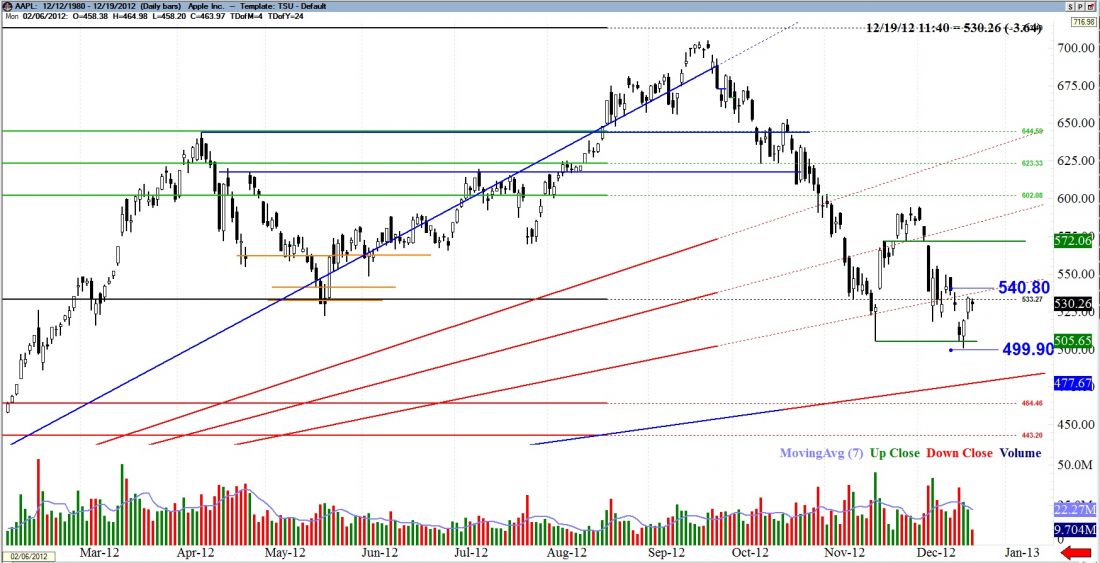
Currently, there is some potential bullish divergence, looking at the MACD on a daily level on AAPL. Therefore, I am cautious in both directions but I do not mind waiting. This is a neutral trade; let this trade be free of emotions. I can see insane bearish signals and I can see bullish optimism and hope (for a little while at least).
AAPL will move in one direction or the other. Bearish trades, for now, will continue to have a higher probability than bullish trades. Let’s go make the market our playground and go bobbing for apples.
= = =
Read more trading ideas in our daily Markets section.
Stock Story:
Does This Stock Rally Have Legs? January Barometer Will Be Key

