

Mean reversion and momentum are the workhorses of quantitative investing. Most systematic trading technologies use a variation of these time-tested techniques. In this article I will be discussing the recent concept of using data from Twitter and the social Internet to augment mean reversion strategies.
AlphaGenius, the firm I run, is a quantitative hedge fund that specializes in collecting data from Twitter, Google, and other Internet data sources to build investing models. Our models generally involve machine learning as we take in data on all sorts of topics like employment and housing. I am not going to go into any overly complex concepts about machine learning because we, and other academics, have found that Twitter can be powerful tool for the trader using simple resources freely available on the Internet.
STOCK REACTIONS
The affects of news on stock returns have been heavily studied in academia. Stocks tend to under-react or over-react depending on the nature of the news (Tetlock [2010]). The general consensus is that stocks that make sudden movements in the absence of news tend to revert. News analysis software is an entire industry and is being profitably deployed to augment traditional mean reversion and momentum strategies. The theory is fairly intuitive. The news simply confirms if the drops or pops in stocks are justified by actual fundamental events or are just noise created by supply and demand imbalances.
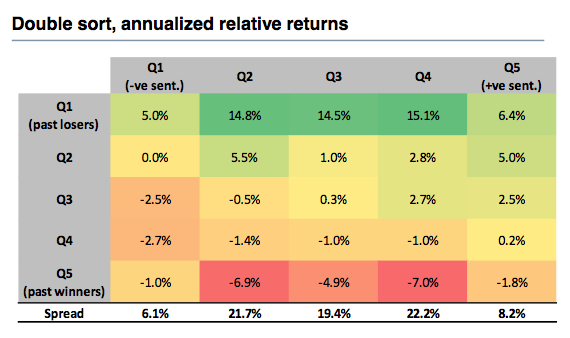
Rochester Cahan at Deutsche Bank did a study where he found that stocks with the least news and Internet activity had the strongest mean reverting properties. In Figure 1 (Cahan [2013]) the rows represent stocks broken up into quintets sorted from biggest losers to biggest gainers in price. The columns represent the news and Internet sentiment data for those stocks over the same period sorted from most negative to most positive. The fascinating finding was that both positive and negative news had detrimental effects on mean reversion. The stocks with no news in quintets 2-4 were the ones with the best mean reverting properties, consistent with the above-mentioned academic research.
Cahan’s study had a lot of resources behind it that may not be accessible to most traders without considerable expense. He used data from Bloomberg, Compustat, and Thomson Reuters. I am going to spend the rest of this article discussing how an individual trader might utilize some of these techniques with freely available Internet resources.
Twitter is free and is the biggest real time news data engine ever created. When people talk about stocks on Twitter they use the “$” hashtag. As an example, $AAPL denotes Apple’s stock ticker. This is important on Twitter because there are a lot of short codes, like LOL, which could be misinterpreted as a ticker. You can go on Twitter.com or Stocktwits.com and see users discuss all sorts of companies. Prominent companies get a greater volume of Tweets, but this is probably the best place to get dialog on lesser-known companies.
VISUALIZE VOLUME OF TWEETS
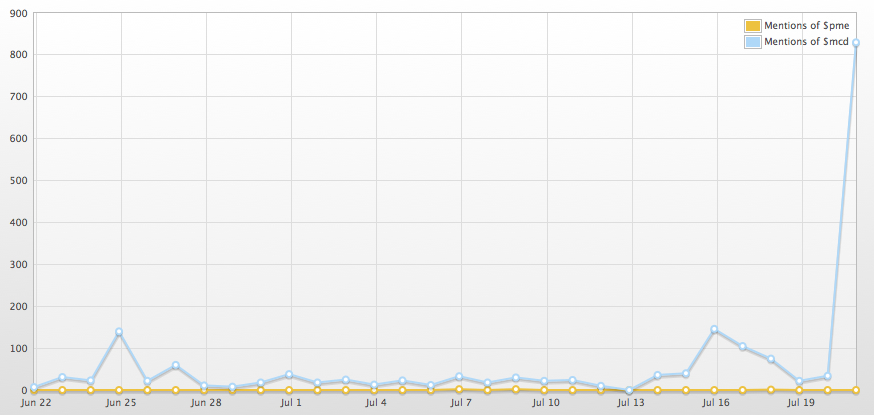
The key from a trading perspective is the ability to visualize the volume of Tweets. I find that http://analytics.topsy.com/ and http://stocktwits.com are good free resources to trace the volume of stock Tweets. I used Topsy to plot the last 30 days of Tweets for $PME and $MCD [Figure 2]. I picked $MCD because it knew it had an earnings miss today (writing this July 22, 2013). It is an admittedly data-snooped, loaded example. The soaring number of Tweets is all about the Q2 miss.
The theory would go that $MCD is not a good mean reversion candidate. On the other hand, I have never heard of $PME. I found it on a list of stocks at 52-week lows (http://www.stockpickr.com/today/52-Week-Lows/), which can be an effective value screen. It dropped by 2% today and there is no mention of it on Twitter. I am not advocating going out and loading up on $PME, but this is a practical example of how you can find stocks that may show stronger than normal mean reverting properties. I think the real power in this is that you do not need to know anything about the company to use Tweet volume as a mean reversion screen. In practice, a trader would then do fundamental research to further confirm if you believe this is a good mean reversion candidate.
CRITICAL MASS
I know some of you may think that microcap and non-consumer stocks do not get talked about on Twitter. I can assure you that is no longer the case. Almost all stocks get talked about now that Twitter has reached a critical mass. The quantity of individual stock Tweets is all relative. If a stock gets an average of 3 tweets a day, then suddenly gets 30 Tweets, it is an important indicator an astute investor should pay attention to. There are also Tweet volume affects on momentum that I may address in future writings.
= = =
[Have you used Twitter in your trading? If so, let us know your strategy below.]
Related Reading:
Use Twitter Sentiment As A Technical Indicator
Buy The Rumor Sell The News? Social Media’s Impact

