

Editor Note:
[Did you miss Madden’s introduction to Elliott wave?]
The Three Major Rules of Elliott Wave Principle
Trading With Elliott: Corrective Waves
#####
Because the WP has specific rules price must adhere to, it provides an excellent model in which to formulate ones trading plan around. (Check back to my Part Two article to review the rules). In this article I will take a look at some of the guidelines that are used when applying the WP and as we go on from here I will show how they can be used along with the rules as Trade Set-up opportunities.
KEY EWP GUIDELINES
ALTERNATION
The guideline of alternation states that if wave two of an impulse is a sharp retracement (often deep), expect wave four to be a sideways (often shallow) correction, and vice versa. Sharp corrections never include a new price extreme, i.e., one that lies beyond the orthodox end of the preceding impulse wave. They are almost always zigzag (single, double or triple) Sideways corrections include flats, triangles, and double and triple corrections. They usually include a new price extreme, i.e., one that lies beyond the orthodox end of the preceding impulse wave.
DEPTH OF CORRECTIVE WAVES
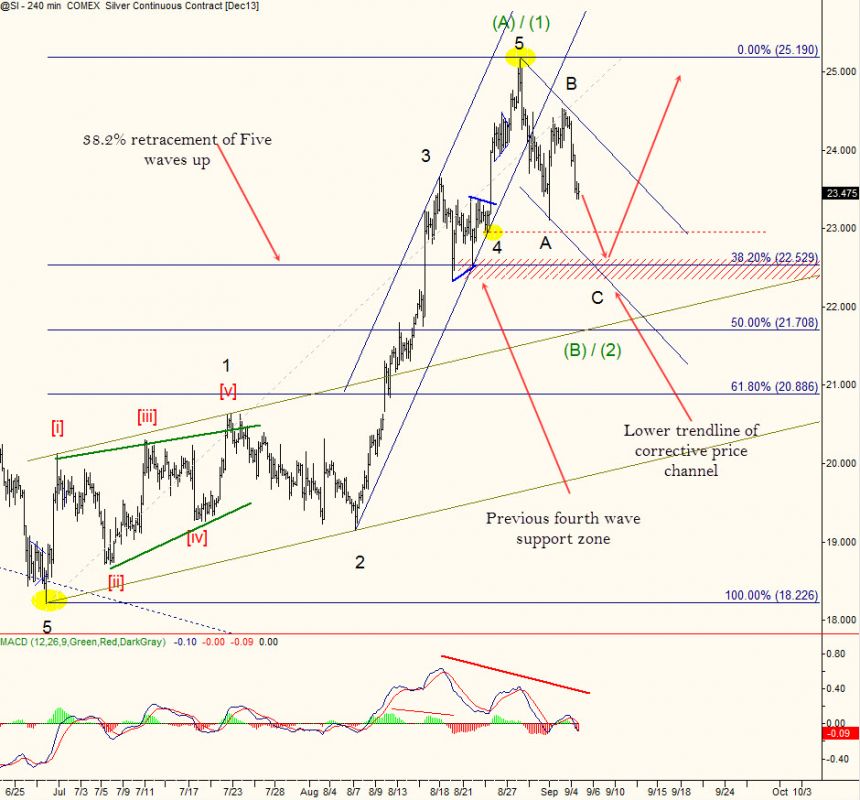
The primary guideline is that corrections, especially when they themselves are fourth waves, tend to register their maximum retracement within the span of travel of the previous fourth wave of one lesser degree, most commonly near the level of its terminus. Also note that second waves often register what is considered a deep retrace, 61.8% of wave one and greater, fourth waves on the other hand tend to make a shallow retracement of the third wave registering a 23.6% or 32.8% retracement.
CHANNELING
I am a big proponent of Channeling Techniques and I find them to be a very simple but a powerful guideline for the wave principle and trading in general. Elliott noted that parallel trend channels typically mark the upper and lower boundaries of impulse waves, often with dramatic precision.
To draw a proper Impulse Channel, first connect the ends of waves two and four. Take a parallel of this line and extend it form the termination point of wave three to forecasts the end of wave five. If wave three is abnormally strong, almost vertical, experience has shown that a parallel that touches the top of wave one is then more useful.
Within parallel channels and the converging lines of diagonal triangles, if a fifth wave approaches its upper trendline on declining volume, it is an indication that the end of the wave will meet or fall short of it. If volume is heavy as the fifth wave approaches its upper trendline, it indicates a possible penetration of the upper line, which Elliott called “throw-over.” Throw-overs also occur, with the same characteristics, in declining markets.
Corrective price action tends to be contained within parallel lines also. Jeffery Kennedy at EWI came up with the Basing Channel Technique which can be uses to differentiate a corrective structure from an impulsive one. Here you draw a line that connects the start of wave one to the end of wave two and extend a parallel from the end of wave one. If a third wave is unfolding it will break out of the upper trendline of the channel, failure to do so would confirm a corrective structure is still unfolding. In figure 1, a six hour chart of Silver Continuous Contact (@SI) see how I am using the guidelines to confirm my wave labelling.
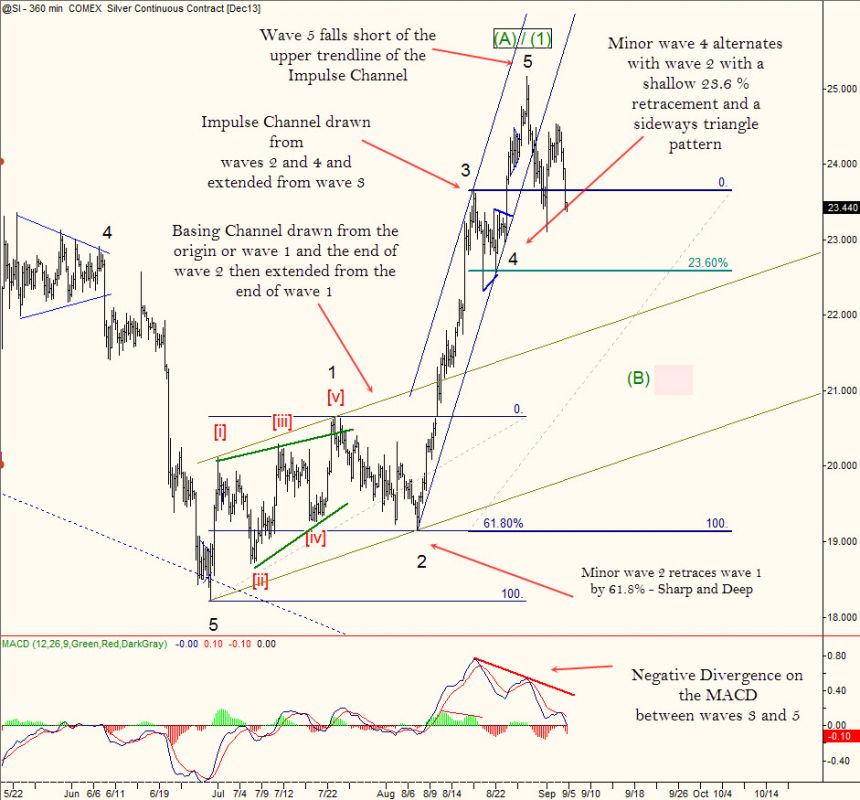
(TIP: When using channeling or trendlines allocate colours, weights and dashing to give lines specific meaning. That way when there are multiple lines on the chart you will know at a glance their meaning.)
WAVE EQUALITY
When wave three is extended, which is a common occurrence the distance travelled in wave one will often equal the distance travelled in wave five (see red boxes in figure 2). Also a common relationship for the A and C waves of Zigzags and Flats is equality, the distance travelled in wave C is often equal to the distance travelled in wave A.
DIVERGENCE: VOLUME AND MOMENTUM INDICATORS
This guideline is often referred to as just “Volume” and it states that in normal fifth waves below Primary degree, volume tends to be less than in third waves. So just like you’ve learnt in basic technicals expect a turn when price is advancing or declining on falling volume. Today a lot of traders have replaced charting volume with other indicators such as RSI, MACD etc. The same observation applies: the signal line in momentum indicators will often hit the extreme on the completion of wave three and will diverge with price for the development of wave five (see MACD in figures 1&2). If volume / or the signal line in an advancing fifth wave of less than Primary degree is equal to or greater than that in the third wave, an extension is likely in force.
THE “RIGHT LOOK”
While there is not an exact template for the basic cycle, five waves followed by three waves, the correct interpretation seldom differ from the basic and most simplistic interpretation of the WP’s structure. Using simple lines to draw from the extremes of swings in price action will often lead to / distract you from the correct wave count through the right look.
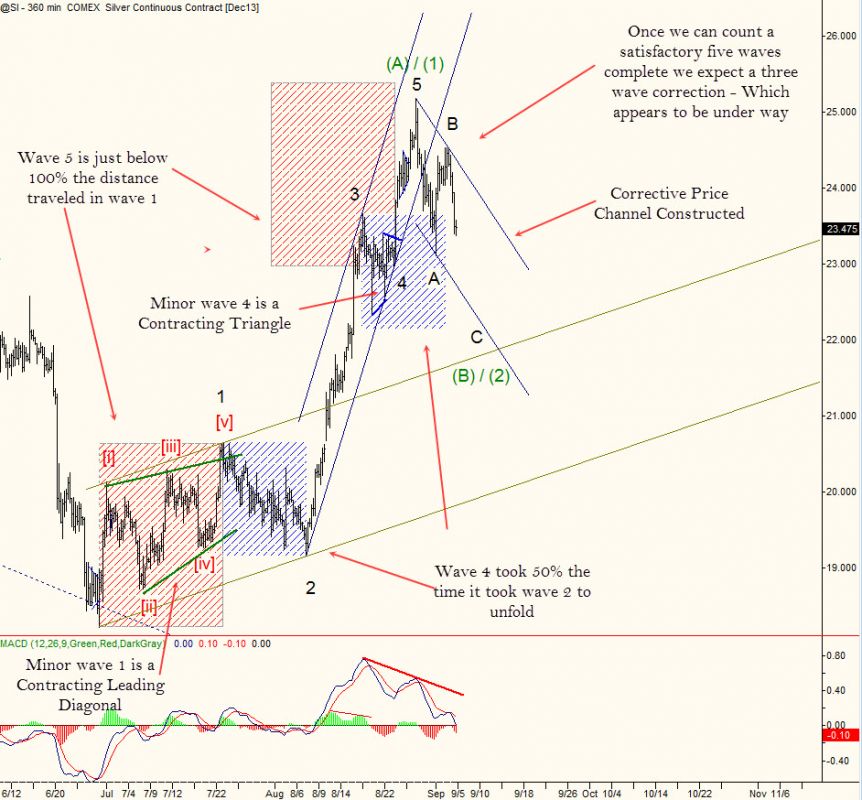
Silver futures Dec cc (SI) as of Sept 4th (as shown above) is dropping after completing a five wave advance, we will continue to track price action as it unfolds in an expected correction after the five waves. With the corrective price channel constructed from the start of Minor wave A and the end of wave B extended from the end of wave A let’s see how price reacts to the anticipated support
#####

