

Identifying turning points in the market can be a daunting task for beginner to intermediate level traders. If you are already in a position, it’s easy to let your emotions take over and throw out your larger goal out the window in favor of smaller, more immediate returns. Often this is the wrong approach and you will stand on the sidelines as prices continue to rise or fall in accordance with your initial bias.
The greatest key to building confidence and hanging onto winning positions longer is to have a solid target and exit strategy in place before you even initiate the trade to begin with. In today’s article, I’m going to show you how Fibonacci expansion levels, combined with momentum, can be used to establish high-probability target levels and manage open positions as they unfold.
THE BASICS
Let’s begin with the first question that might come to mind: What is a Fibonacci Expansion level? A Fibonacci Expansion is a type of Fibonacci projection indicator that you can apply to your charting. It is used when comparing one trend development to another that is currently unfolding. You may already be familiar with the concept of a “measured move” on trading range breakouts, whereby a breakout from a trading range will often yield a “measured” or “equal” move as compared to the trend move that unfolded prior to the development of the trading range. The Fibonacci Expansion tool takes this concept even further.
Measured moves in a trading range breakout will typically only happen when the momentum or pace of the breakout is comparable to the momentum or pace of the trend that formed heading into the trading range. If the breakout is stronger or weaker than that prior impulse move, projected a measured move level as a target on your trade will often leave you with smaller gains than you should have if you had adjusted that target based on the momentum.
IDENTIFY KEY POINTS
This is where the expansion tool comes into play. It helps you identify major levels of support or resistance that can hit before or after a measured move has occurred, allowing you to keep an eye on these price points and then compare the breakout momentum to the prior impulse trend. If the breakout is slower, you would watch the Fibonacci Expansion levels that are under the 100% expansion. If the move is stronger, you can watch the levels that are greater than 100%, such as the 161.8% expansion level to time your target.
FIBONACCI EXPANSION LEVELS IN ACTION
Let’s look at a couple of recent trades in the S&P 500 to show you how this looks in real time.
Below is a trade in ES (S&P 500 E-mini futures) that began developing afterhours. The “impulse” move had two wave of buying, followed by two waves of correction lasting from 3:20 to 6:00 AM ET. To draw the Fibonacci Expansion levels, I went from the lows the prior evening into the 3:20 AM ET highs and then expanded that into the second low of the correction at 6:00 AM. ET. This created expansion points that compared the continuation breakout to the earlier uptrend, thus giving me target levels to watch for.
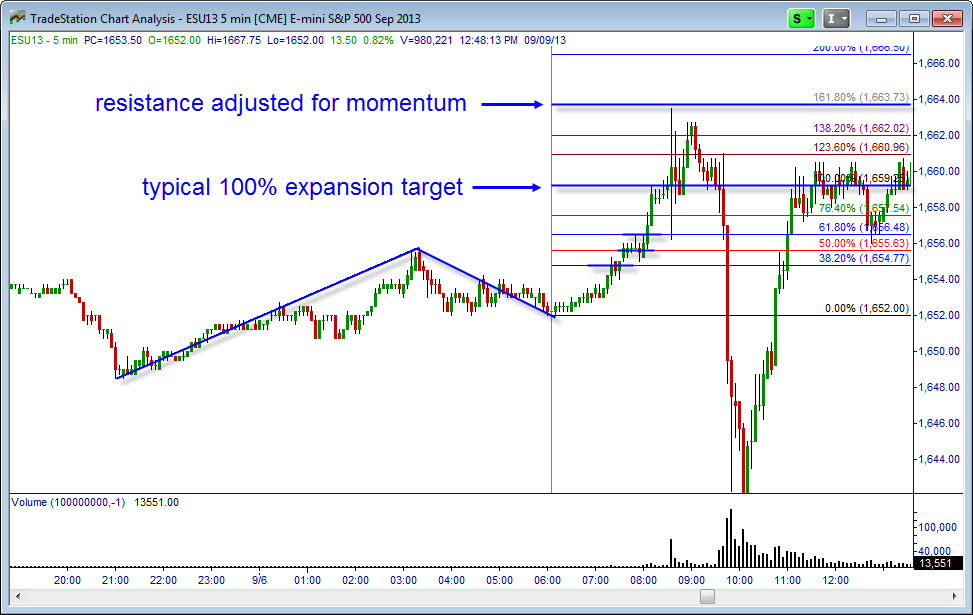
As the morning breakout took place, however, it was very clear early on that the momentum of the breakout was substantially stronger than the trend than had begun the prior evening from 21:00 PM ET into 3:20 AM ET. A typical target for a breakout from a trading range that consists of 2 waves of correction is a 100% expansion level.
MAKE YOUR TARGET TIMING MORE PRECISE
Notice that the 38.2%, 50%, 61.8% and 100% expansion levels all stalled the rally, but they did not halt the uptrend. The expanding momentum led to even further upside. Premarket economic data created added volatility after the 100% expansion level, but notice that the 161.8% expansion zone still held incredibly well. Using even smaller time frames and similar projection points on those time frames, you can make your target timing even more precise.
#####
Related Reading:
Day Trading with Fibonacci Expansions

