

In our most recent article at TraderPlanet, we highlighted oil’s expected rising trend in the coming year as part of the regular business cycle. Since the write-up, XOM has begun to trend after breaking out of its multi-year high, while CVX continues to trade sideways. The expectation for oil to rise follows the hypothesis that we are in the middle to late bull stage of the current business cycle. Following this hypothesis, we might begin looking at a group that often enjoys rising demand during the latter stage of a bull market, the computer hardware group.
HPQ AND EARLY SIGNS OF ECONOMIC RECOVERY
For those of you who watch or have watched Jim Cramer, do you recall in early 2009 when the entertaining market guru told his viewers to “back up the truck” when fear was at its height?
However you might find Jim Cramer’s visual and audio aids, they are effective at driving home some invaluable lessons about Mr. Market. The lesson then was that the market often begins to recover when fear and doom and gloom is the only thing anyone can agree on.
Since then, the market has marveled at new growth names and the reawakening of old giants. In contrast, the computer hardware group has enjoyed relatively lackluster performance as a whole during this same period. However, by late 2012, as captured in the image below, some interesting technical action was noted for the computer giant Hewlett Packard Co., (HPQ).
HPQ appeared to be under accumulation despite various caveats, e.g. poor earnings and non-existent positive coverage by analysts. Today, we may surmise that big cap HPQ’s action was just one of many clues that the economy was in the early stages of recovery after years of pain and high unemployment. Today HPQ is trading above its 10/50 week moving average. More importantly, HPQ’s sales and earnings have improved since the picture below was taken. In
recent months, the group’s strength is proving noteworthy as even Pitney Bowes, Inc., a company who manufactures postage meters is on the rise.
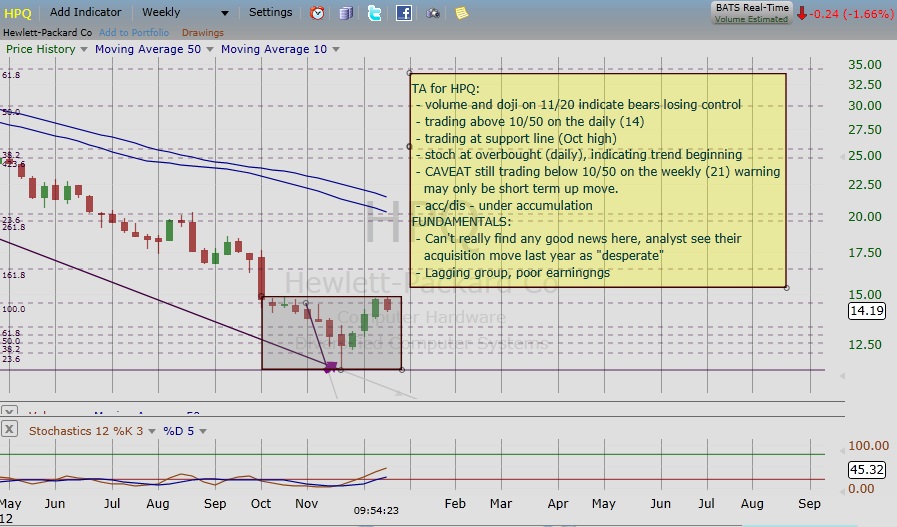
Figure 1 HPQ Weekly Chart in Late 2012
A YEAR LATER, IS IT NOW TIME TO WATCH THE SMALL AND MID-CAPS?
Synaptics Inc., (SYNA), specializes in user interface software and touch screens for devices, and has traded side-ways since 2008, but recently broke above its multi-year high this September. In recent weeks, the security has traded in a tight pattern after finding resistance in late October and selling off, but then finding support at its 10/50 day moving average. The daily chart shows a deep cup and handle pattern.
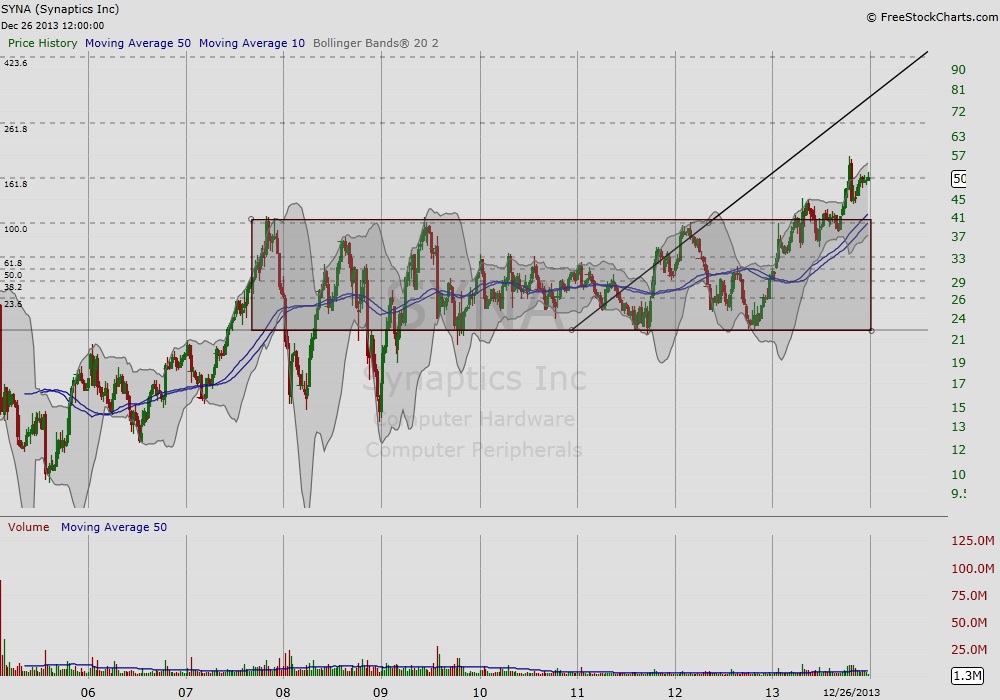
Figure 2, Weekly Chart of SYNA
Super Micro Computer Inc., (SMCI) is a small cap and manufactures computer hardware, including chassis and server boards. The stock formed a cup base and high handle on the weekly in 2013, and has been trending since early November from this initial base. Today, it is approaching its multiyear high. As often happens at these levels it would not be surprising for SMCI to hit overhead supply and suffer some near term exhaustion before continuing the prior trend.
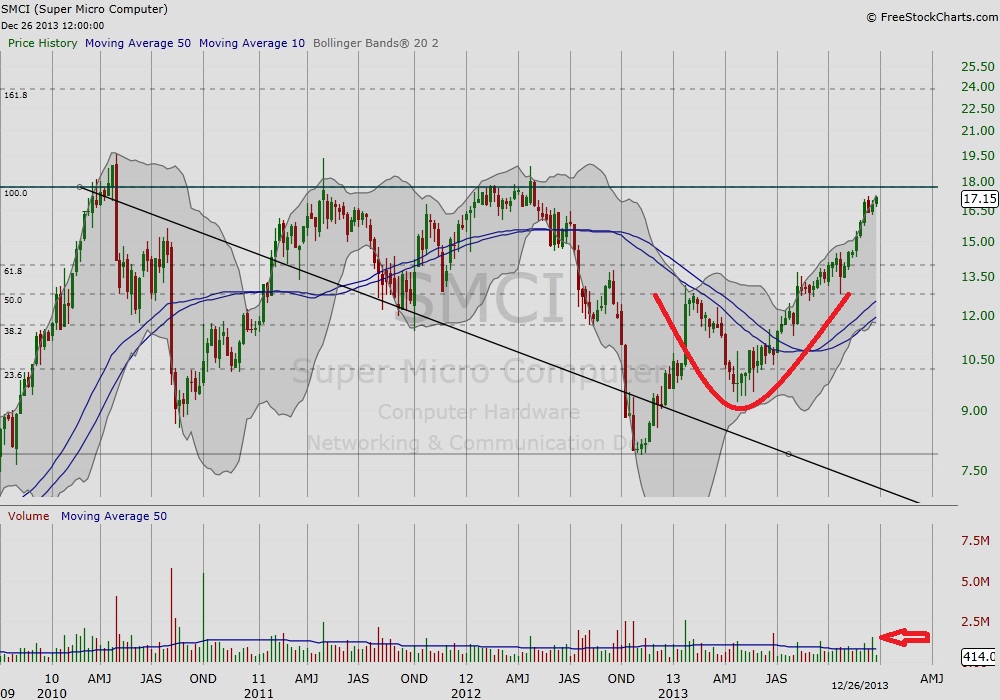
Figure 3, Weekly Chart of SMCI
HAPPY NEW YEAR
This market just keeps heading up. Although, distribution days (sign of professional selling) are up as we head into the New Year for those who follow this count to gauge the current uptrend risk. When the market returns from the holiday season, we might expect strong moves in either direction as we have in past seasons.
Outside of any near term market action, the market appears to be in the mid-late stage of a bull market cycle, and so we might expect groups such as the computer hardware group to demonstrate strength in the year ahead. Thank you for reading.
Reference
General company info and data from Investors.com
Stock charts from FreeStockCharts.com
No position in any security mentioned.
= = =
RELATED READING
Read another story by Rinehart here:
Use Volume In Your Market Analysis

