

Mr. Market is beginning to show real signs of struggle, not surprising given its steep trajectory throughout 2013. It is now more than two years since the market experienced a substantial pullback. Today with many great movers well off their initial bases and showing signs of struggle, it is a waiting game, and a time to assess where the market has been, how it has fared to date, and what we might expect going forward.
Great Rotation
The Great Rotation refers to the phenomenon when, due to the anticipated end to a decade of deflation, money would begin flowing out of long term bonds into equities. The TLT (20+ year US Treasury Bond) chart below illustrates this phenomenon. In early 2013, the TLT broke below the 10/50 week moving average accelerating the uptrend in the S&P 500. The rest is history or is it? In the next week(s) trader’s will be watching to see if the TLT will be able to break back above the 10/50 wk ma, a sign that we have yet to conquer deflation.
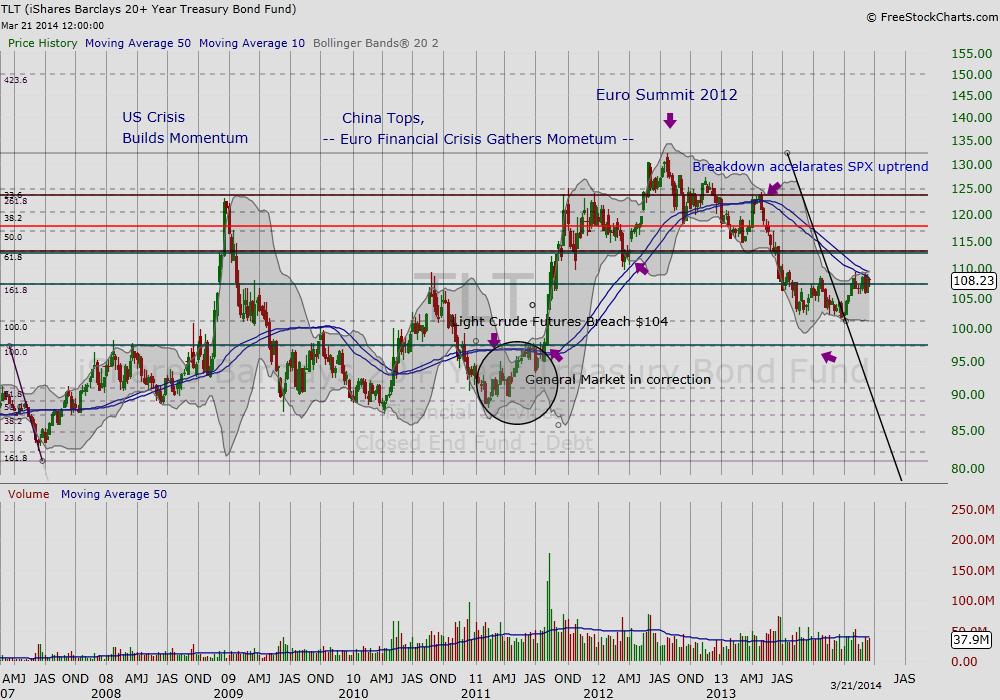
Figure 1 TLT
Demand And Oil
In our November article we noted that at this respective stage of the market, we should expect energy stocks to begin gaining momentum as part of the expected rotation in bull markets and recoveries. Last summer, and coinciding with the TLT’s failed attempt to recoup its 10/50 wk ma, we see Crude Oil break out of the triangle in Figure 2 below. However, the breakdown by the TLT (confirming inflation) did not correlate with a strong break out of Crude Oil. Instead, the oil breakout was short-lived, and its breakdown foreshadowed retail’s poor performance over the holidays.
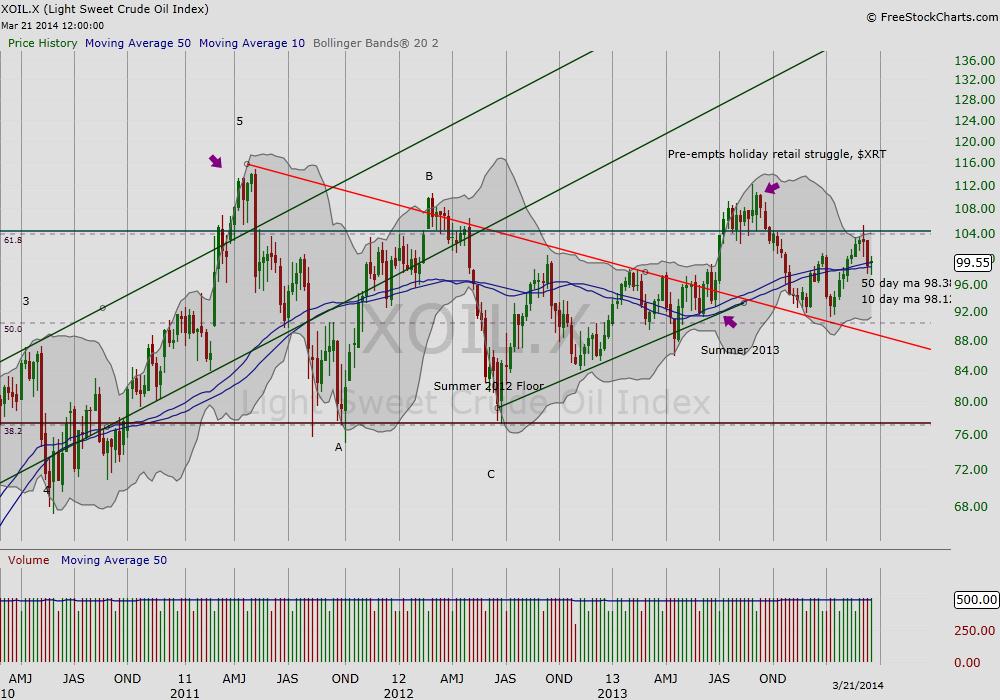
Figure 2 Crude Oil
Where Do You We Go From Here
A study of previous bull markets, we note that after an extended run without much rest, as in after the market recovery in 1994, at the minimum we might expect a prolonged sideways action. Another scenario might be a sharper contraction to reconcile where we are in our battle to defeat deflation if the TLT breaks above the resistance at its 10/50 wk ma (Figure 1) or if Crude Oil continues to indicate poor demand (Figure 2). Figure 3 below is the S&P500 and the channel it has traded in since 2010 to provide us a visual of potential supports and resistance for the coming period.
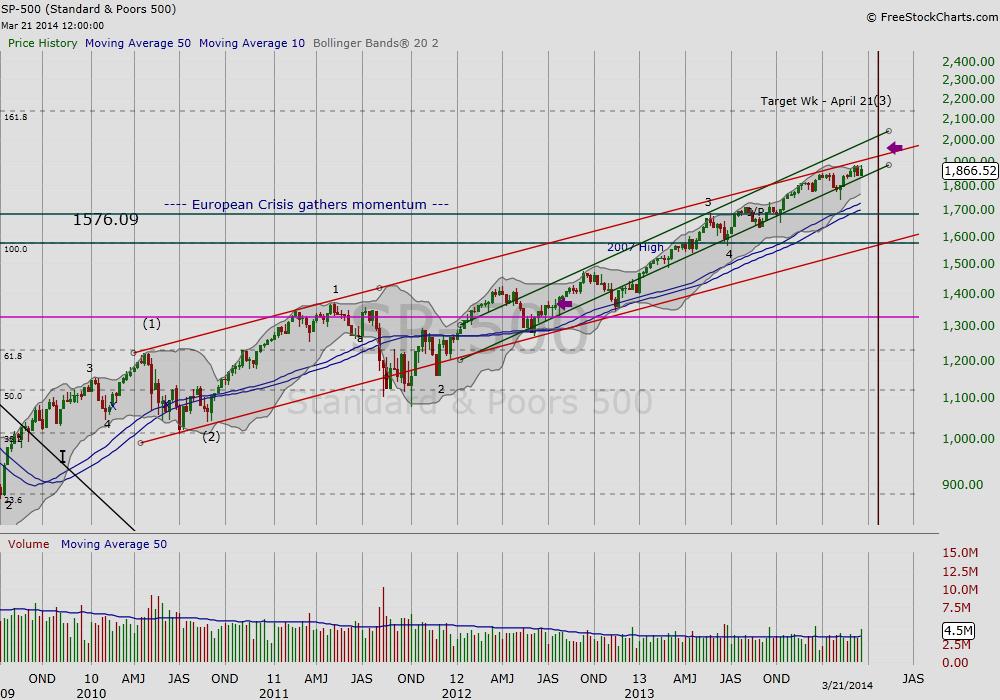
Figure 3, S&P500
Take Away
The market has been in steady upward march for an extended period. It is not unreasonable to expect an extended pull-back or prolonged sideways action given market behavior in previous bull markets after a similar extended run. A couple of caveats that may play into the market psychology are Crude Oil’s failure to confirm demand and signs that we may see more challenges ahead with our battle to defeat deflation.
Thank you for reading.
Charts from FreeStockCharts.com No Positions
= = =
RELATED READING
It’s Game Time: Volume Reveals Bulls Versus Bears by Maria Rinehart

