

In past articles, I have shared that corrections or maybe just weak markets are an opportune time to begin following the flow of money to determine where the market is moving in the ongoing evolution to find the next winners or simply to minimize risk depending on your perspective.
Last November, we looked at Perfcharts to gauge the industry where we might find the next movers based on our understanding of sector rotation. As a re-cap, we noted then that materials and industrials were gaining momentum, and indicated that it may be time once again to look at energy names.
Accumulation Vs. Distribution
A more direct method may be to simply study accumulation vs. distribution. In other words, who is getting bought, and who is getting dumped? Those who subscribe to Investors.com will be familiar with their handy rating of stocks. One column that provides an objective view of where the market is moving is the Accumulation/Distribution Rating that IBD calculates for each stock. ‘A’ indicates that money is flowing into these names, and ‘E’ indicates money is flowing out of these names.
Benefits of Weak Markets
“Don’t chase the trade” is the sage advice from many trading classics. However, once the market is trending it can be a challenge to find a bus to catch. Thus, the best time to begin studying where money may be flowing next is when the market is either long in the tooth or when it is at a pull-back.
Energy and Utilities
The chart of Figure 1 below is a snapshot from April 17, 2014 of those stocks in the S&P500 and Nasdaq100 who received at least an A rating from Investors.com database. Quickly, we can confirm from our November study using PerfCharts that the market did move into energy names.
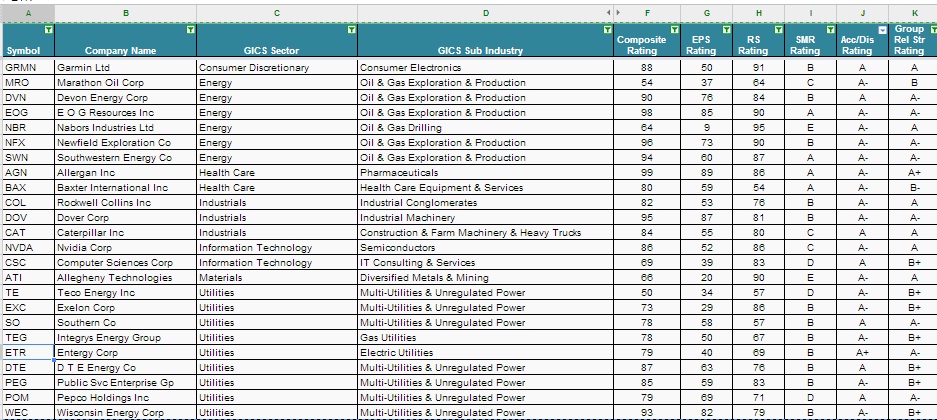
Figure 1 S&P500/Nasdaq100 Acc/Dis A Rating as of April 17, 2004
Getting a Sense of Market Trend
Take a look at Entergy Corp. (ETR) in Figure 2 who sports an A+ accumulation/distribution rating. From a technical perspective, this name appears to be heading into some overhead supply. It is currently at years-long high, a common area when those who bought at this area will look to break even; furthermore, it is forming a “shooting star” on the weekly candle in elevated volume. Elevated volume that fails to push a stock through the next resistance is a clue that for now ETR will likely experience a period of profit taking. However, as it is bumping against years- long high, it is also likely that base traders will be looking for ETR to build the next base in preparation for the next trend.
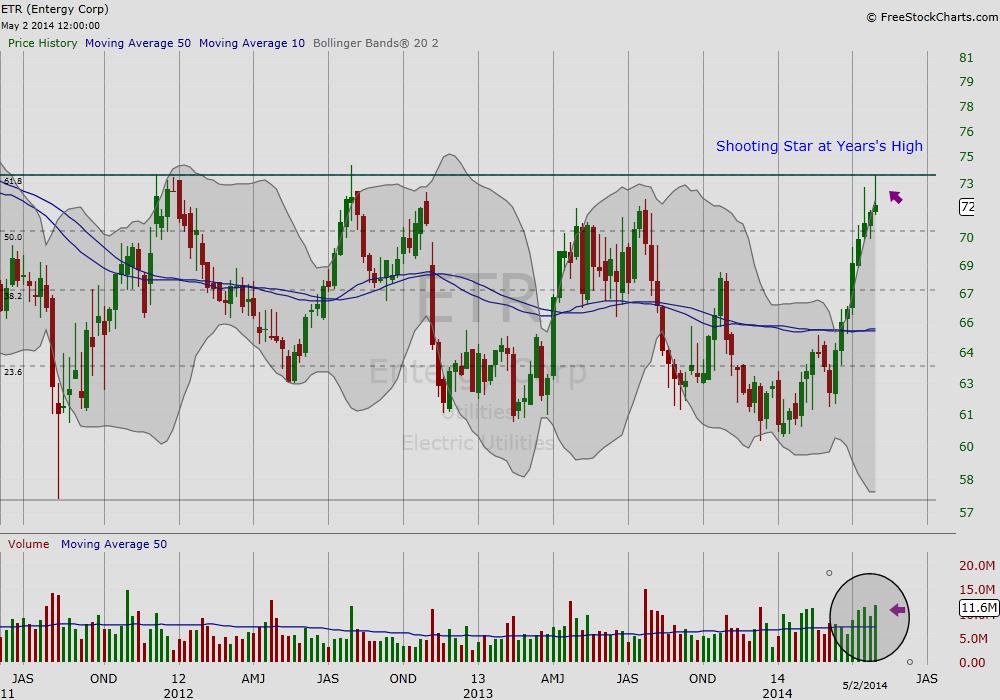
Figure 2, Weekly Chart of Entergy Corporation
Figure 3 is the weekly chart of Rockwell Collins Inc., (COL). Although, COL has not enjoyed the stellar A+ accumulation/distribution rating enjoyed by ETR, the base on base chart below describes a bullish pattern in an otherwise weak market. Rockwell is at all-time highs. In fact, the top of the first base on the base on base pattern is the 2007 high. It might be worth following this name.
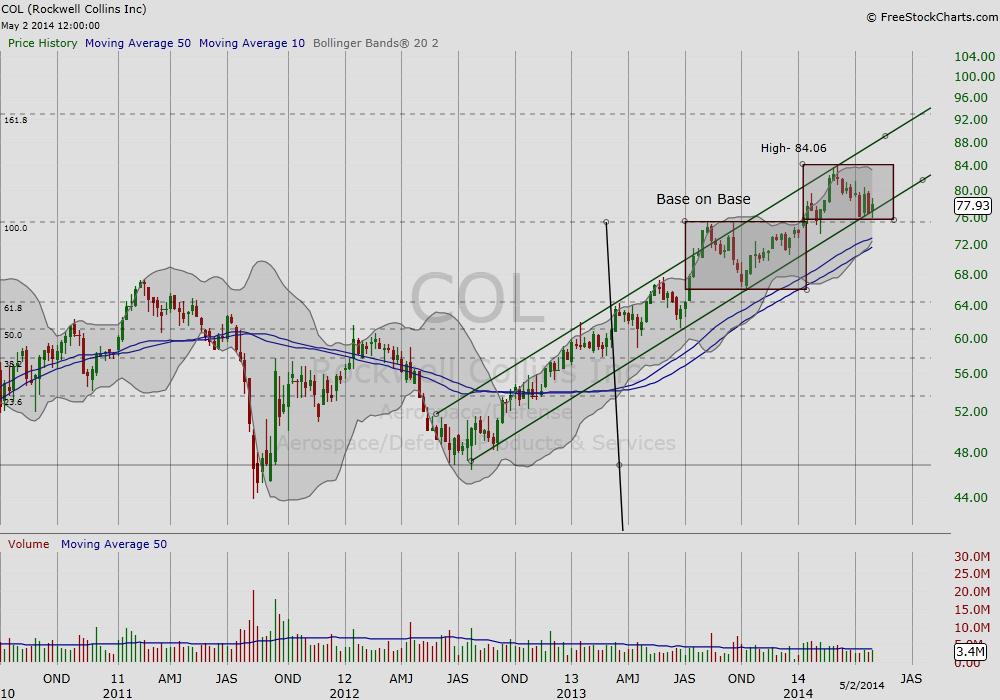
Figure 3 Weekly Chart of Rockwell Collins Inc., (COL)
Take Away
Weak or difficult markets are an opportune time to prepare for better days by remaining objective with an eye on where money is flowing next. Perfcharts and studying accumulation vs. distribution are just two methods used to gauge where interests are moving.
Reference
Accumulation/Distribution rating from IBD database at Investors.com
Stock Charts from FreeStockCharts.com
No positions.

