

Biotech has been one of the best performing sectors year to date and over the last two years. Six different biotech ETFs are among the Top 10 YTD leaders: Alps Medical Breakthroughs (SBIO), up 51%; Bioshares Biotechnology Product (BBP), up 38%; the SPDR S&P Biotech (XBI) up 36%; Bioshares Biotechnology Clinical Trials (BBC), up 31%; and NYSE Arca Biotech Index First Trust (FBT), up 23%.
The Nasdaq Biotech ETF (IBB) stands at #9 YTD with a 26% gain, but it is the volume leader and I consider it representative of the sector overall.
When it comes to valuation, however, not all Biotech ETFs are created equal. Some have no earnings to speak of, whereas others consist of well-established, profitable companies. The SPDR S&P Biotech ETF (XBI) and the Nasdaq Biotech ETF (IBB), for example, have fairly reasonable trailing 12 month P/E ratios according to Yahoo Finance. And with IBB, one is investing mostly in industry leaders such as Gilead Sciences (8%), Biogen Idec (8%), Celgene 8%, Amgen (7.7%) and Regeneron (7%).
While I’m not calling for a ‘top’ in biotech, the sector is over-loved and at risk for a correction. The Volume Profile chart shows critical support at $364. If that level is taken out, the ETF has risk to $339 and then $313.
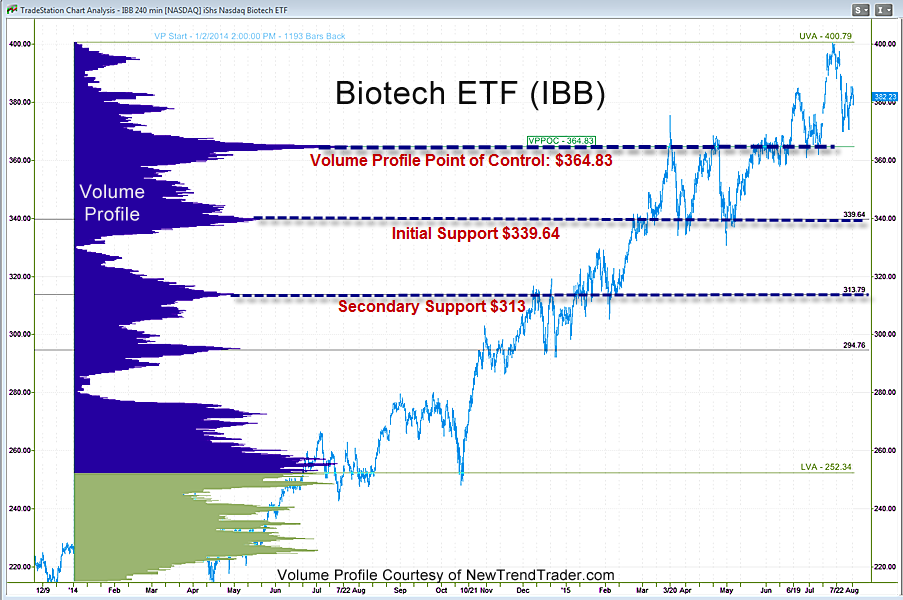
A Note on Volume Profile
The histogram on the left side of the chart shows the volume distribution in the Nasdaq futures for different periods of time. Key support and resistance levels are indicated by the peaks and troughs. If you would like to receive a primer on using Volume Profile, please click here: www.daytradingpsychology.com/contact

