

I have traded the futures markets (plus stocks and ETFs in recent years) since the 1970s. Has the trading environment changed? Wow, has it! Is it tougher for an individual trader to earn a living in the markets today than it was 10, 20 or 30 years ago? Some traders find the huge volatility today works in their favor. But, I can provide first-hand testimony that the markets of today are more challenging –for my style of trading –then were the markets of the “good old days.”
MOMENTUM BREAKOUTS
I trade classical chart patterns —head and shoulders, triangles, wedges, rectangles and the like. I trade breakouts, which means I go with momentum. I am always buying markets that are overbought and sell markets that are oversold, hoping that the oversold or overbought conditions become obscenely overdone. This article attempts to answer two questions for those of you whose trading approach is somewhat similar to mine:
o What has changed to make trading more difficult for position and swing traders using chart patterns?
o How can a trader modify his or her tactics to adjust for the evolving nature of the markets?
WHAT HAS CHANGED?
I believe that four fundamental changes in the futures market have impacted price behavior in a manner that greatly increases volatility. Some of these factors are inter-related.
TRANSITION FROM PIT TO ELECTRONIC
This may be news to some of you, but individual traders buy at the offer price and sell at the bid price –this is true whether they are using limit or market orders. In the “old days” the bid/offer spread was “owned” by the pit traders, who paid hundreds of thousands of dollars for “seats” entitling them to the bid/offer edge. Floor brokers (separate from pit traders) held orders to execute orders for the public –the honest brokers, who usually executed the largest volume, did not reveal their order deck to other traders. At least in principle, the pit traders and floor brokers, in composite, were charged with maintaining orderly markets. In general, I believe the “pit” model did a better job maintaining order than has been done, to date, by the electronic exchanges. Others will disagree with my assessment.
By contract, all futures traders can attest to some examples of extreme price disorder on the electronic platforms we have today. For example, there was an instance in 2007 when I had a silver stop run by $2 per ounce, only to have the market immediately recover the lost ground. The official low of the day was changed to a price above my fill, but my fill price still stood. Figure that one out! While the exchanges have made modifications to avoid the huge “holes, spaces and voids,” the electronic platforms at present still have problems.
HFT AND ALGO TRADING
High frequency trading (HFT) programs now own the bid/offer spread once belonging to the pit traders. Accounting for 60 to 70 percent of the volume in some markets on some days, HFT operations have changed the nature of markets in subtle ways. With the ability to react in micro-seconds, HFT algo programs are designed to detect when a certain amount of selling volume can trigger cascading stop loss selling.
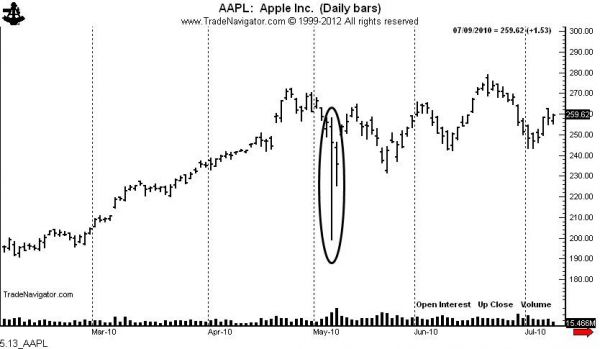
What happened in Apple on May 6, 2010 (a 25% decline into a void) does not have to happen too many times to loudly ring the cash register at HFT firms, as shown in the chart of Apple Inc. (APPL) for the period. See Figure 1.
HFTs have a laser beam on running blocks of stop orders. They are more efficient at doing this with algorithms than were the pit traders at doing it with a hunting pack mentality. The result is that key chart levels are routinely violated with little or no follow through. I want to emphasize that HFT firms are doing nothing illegal. These firms are run by honest and very bright people. They use the same data flow available to you and me. I am not citing this as a complaint, but rather as a reality to be acknowledged by individual speculators.
MASSIVE INFLUX OF VOLUME
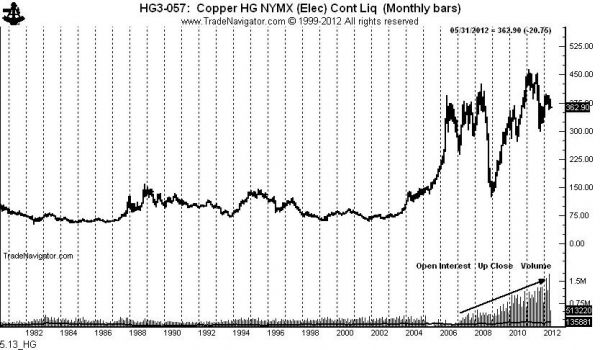
We “old timers” could have never imagined the volume in futures markets today. In 2011 the volume in all international futures markets combined topped 25 billion contracts. The average daily volume in gold from 2005 to 2012 was 3.8 times larger than the average daily volume during the previous 20 years. During the same comparable periods, the volume in crude oil increased 4.3 fold. The volume increase shown on the copper chart is typical of all futures markets. See Figure 2.
MORE VOLATILITY
Futures markets are far more volatile today compared to the past than would be indicated by the flat price changes. For example, the average price of copper from 1985 through 2004 was approximately $1.05 per pound. The average price of copper since 2005 has been about $3.10. One might then expect volatility to be about three times greater today due simply to flat price appreciation. But, this is not the case.
Price volatility in copper since 2005 compared to the period 1985 through 2004 has been 5.4 times greater. Looked at different way, from 1985 through 2004 the average annual price ranges (from high to low) equaled about one-third of the average annual flat price. Since 2005, the average annual price ranges have equaled 62% of the average annual flat price. The same expanded relative volatility is true whether measured on an annual, monthly, weekly, daily or intra-day basis.
The practical implications of this expansion in price-adjusted volatility are striking. For example, prior to 2005 I could trade copper using a protective stop 100 or 200 points away from my entry. Now I would not consider trading copper with a stop any closer than 800 to 1,000 points. That equals as much as $2,500 per contract.
MORE NOISE=MORE FALSE BREAKOUTS
All of these four factors combine to equal one unavoidable fact –greatly increased market noise leading to many false breakouts of classical chart patterns.
What can a trader do to adjust for greatly expanded volatility and noise? Ultimately you are responsible to answer this question for yourself. I can only tell you what my response is to adjust for the vast expansion of volatility, noise and false intra-day chart pattern breakouts. I have made, and continue to make, a number of minor and major adjustments.
MY APPROACH: FEWER TRADES
Historically, my trading approach has generated 20 to 30 trading signals per month. I have become much more selective about signals, now averaging five to seven signals per month. Ultimately a trader needs to ask the question, “Am I involved in the markets for the action or to make money?” The next question becomes, “What is more profitable, trading for quick in and out results or holding positions for longer periods?” I know how I have answered these questions.
AVOID OVERNIGHT ACTION
Avoid overnight (non-daytime hours) markets except for limit orders. Overnight markets do not have any value added in my opinion. Overnight trades are a “sucker’s bet.”
SKIP SIDEWAYS TRENDS
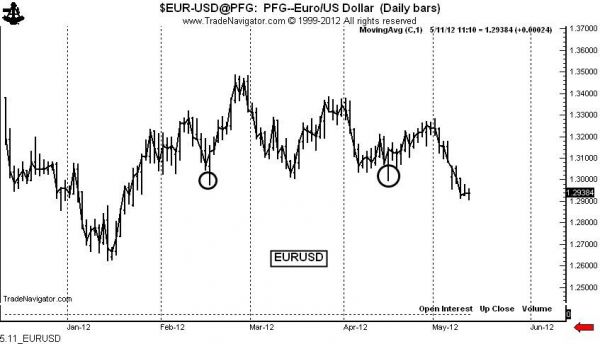
Avoid markets that are locked in a broad trading range. There is nothing to be gained for a momentum chart pattern trader to engage a range-bound market. Let others waste their valuable ammunition (capital) in trading range markets. The chart of the euro/dollar (EUR/USD) in Figure 3 is an excellent example.
Prior to recent weeks this forex cross went up, went down, but went nowhere. Wait to engage a market until a trading range had been resolved –by a closing price. The circled areas show where prices burst out of the trading range intraday, washed out weak longs and trapped the bears. The breakout on May 7 finally resolved this 3-plus month congestion.
FOCUS ON SETTLEMENT
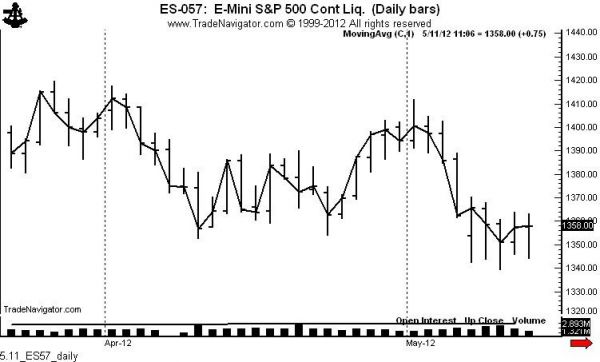
Avoid the use of intraday stop orders. The most important price of the day is the closing price (the price at which exchanges determine the settlement price). The most important price of the week is the Friday close. Intraday completions of classical chart patterns do not mean anything anymore. The closing price must be paramount when determining if a chart pattern has been completed by a breakout. This means doing the bulk of my trading near the close of daytime hours. The close is the only price of importance – all other prices are noise. The following is a high/low/close chart of the S&Ps. Everything above and below the closing price is simply noise. I want to “trade the line” and not the noise.
SHUT OUT THE NOISE
Figure 4 is included to make my point about intraday noise. Everything above and below the closing price on the daily bars was just noise. It is the close that counts. Buying intraday bursts and selling intraday sell-offs is not a good trading practice.
FORGET TRIANGLES
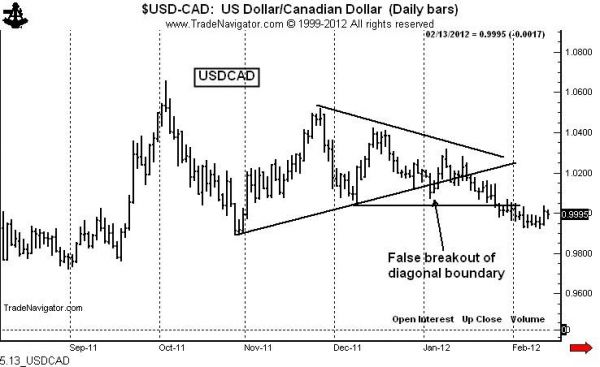
Ignore “diagonal” chart patterns. I have come to despise patterns such as symmetrical triangles and trendlines. The reason is that a breakout of these chart structures can occur without resolving a larger trading range. Figure 5 shows that the early January decline in the dollar/Canada (USD/CAD) violated the lower boundary of a symmetrical triangle without penetrating the December low. Following breakouts of diagonal boundary lines can lead to great trading frustration.
TRADE CHECKLIST
So, what am I looking for in a trade? The chart patterns I am looking for fulfill the conditions below.
1. A weekly chart pattern at least 10 to 12 weeks in duration, preferably longer. Obviously a weekly chart pattern will be manifested by a daily chart pattern. All other things being equal, I prefer the breakout of a horizontal boundary line.
2. A decisive closing price breakout. I use the daily charts for entry signals.
3. A trade that goes against the conventional wisdom of the market.
4. A daily ADX reading (14 bar) at the time of the breakout of 11 or lower.
5. Confirmation by intra-market spreads or highly correlated markets. This applies more to the raw material commodities.
6. Confirmation by the 21-day moving average which I use as a proxy for trend.
7. Some other confirming factor, such as a multi-month trendline or a launching pattern at the end of a larger pattern or the CFTC COT data.
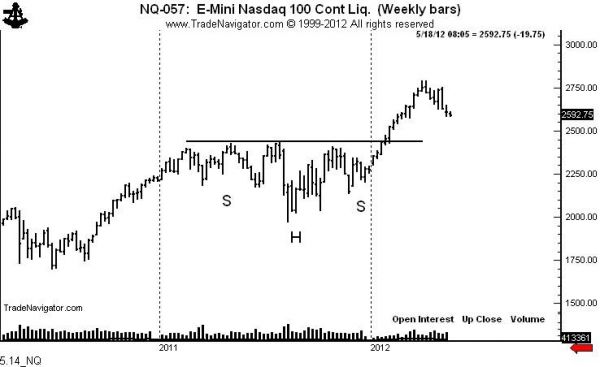
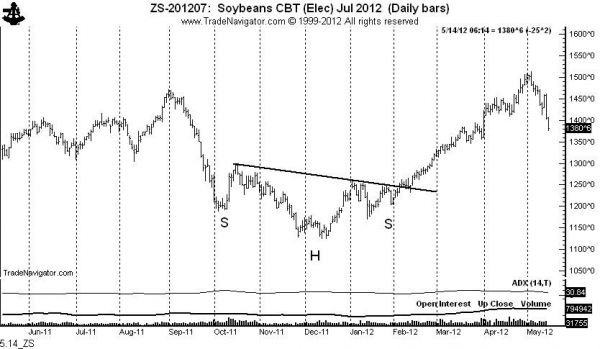
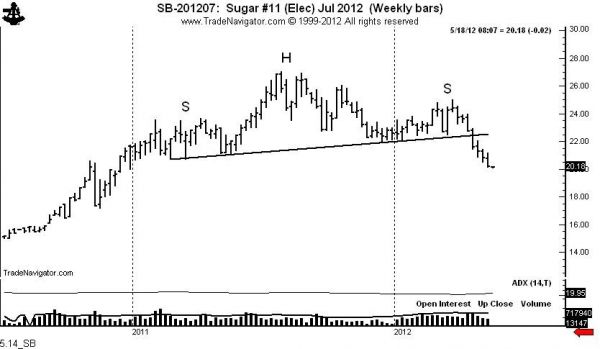
TOP PICKS
The next three charts are three examples of the type of trade signals I seek. The head and shoulders pattern is my favorite set up. My signal comes only when the right shoulder “arm-pit” low or high is exceeded on a closing basis.
Bottom line? A trader has no control over the outcome of a trade. The only controllable is the placement of orders.
Read out latest story on Why Seasonals Don’t Work Anymore in Commodity Markets.
Looking for ideas for your “Watch List?” Click here for our daily stories.

