Descending Triangle
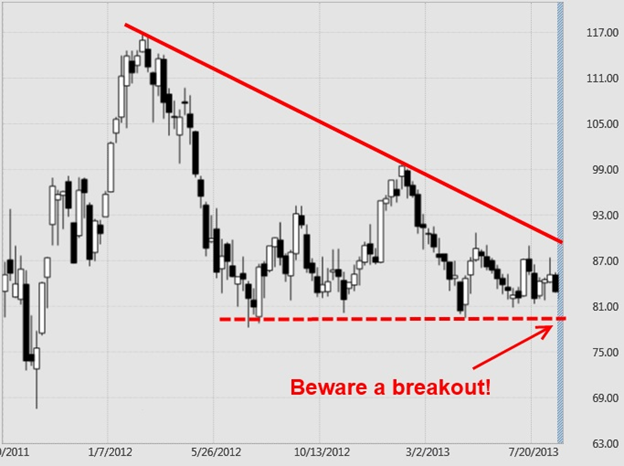
Another triangle pattern that could turn into a reversal pattern, either to the upside or downside, depending upon your time frame, is the descending triangle. To illustrate that price patterns form over multiple time frames, the chart below shows a succession of lower highs on a weekly chart forming a downtrend line but with lows stalling around 80 to form the flat side of a triangle.
Prices could reverse the downtrend line by moving above 90. On the other hand, a price break below the flat side of the triangle around 80 could be an ominous sign for a further move downward, adding to the continuation pattern of the trend in place.
No one knows for sure which way the market will go. But, as traders monitor a price pattern like this to see its outcome, note the potential spots to place orders become more defined – buy a breakout above 90, sell a breakout below 80 or perhaps use those parameters in an options trading strategy. Exact orders will depend on your time reference and style of trading in using these formations.
Ascending Triangle
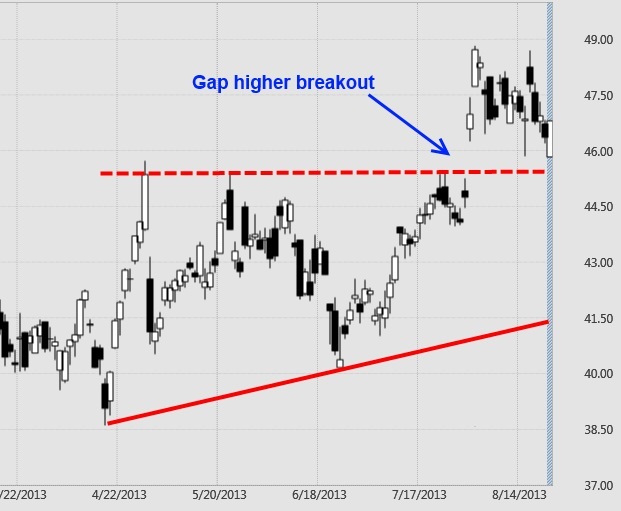
Like the descending triangle, price action in the ascending triangle is another modification of a triangle formation but with the pressure to the upside. Higher lows produce an uptrend line but prices stall at a price level that forms the flat side of the triangle.
Depending on when and where you are viewing the chart and historical prices from the past, you might surmise that the dashed line on the chart below marks a triple top and will turn prices back down again. Or you might see prices pressing higher into a developing ascending triangle.
As the upward pressure pushes prices above the flat side of the triangle, the breakout is marked by a gap higher, a sharp move that is fairly common in triangle breakout situations. If you expected the market to respect the dashed line and turn back down, at least you had a good spot to place a stop in case you might be wrong.
What’s next? Some analysts like to set targets by looking at the width of the triangle at its base. In this case, the width at the triangle’s origination was about 6 points with the low around 39, high around 45. Add the 6 points to the point of the breakout at 45, and you have a target around 51. Time will tell whether that target will be achieved.