Like a pebble dropped into a still pond creating ripples that extend and expand effecting conditions in all directions… a seemingly minor change in one market can alter the trend in a myriad of ways. Our initial focus today is on copper in general and copper prices north of 4.00 in particular.
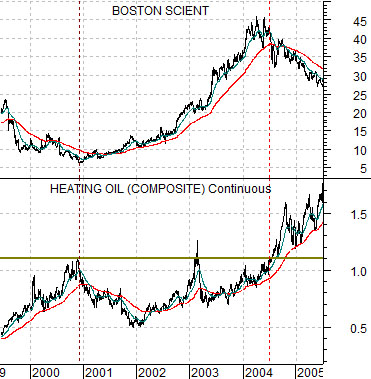
The chart below compares heating oil futures and the share price of Boston Scientific (BSX) from 1999 into 2005.
In 2004 crude oil and heating oil futures pushed to new all time highs. When this happened a number of sectors that had previously been strong- including lumber futures and BSX- began to weaken. In other words the impact of new highs for energy prices led into a rising trend for interest rates and the start of credit tightening by the Federal Reserve which, in turn, initiated the first crack in the U.S. housing market which, in turn, almost demolished the banking system four years later.
What started out as mere ripples ended up as veritable tidal waves.
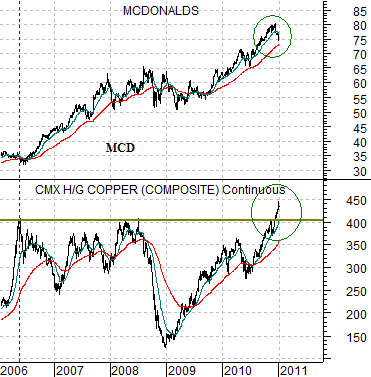
Further below we features a comparison between copper futures and the share price of McDonalds (MCD).
When copper prices peaked in 2006 the nature of the markets changed in a number of ways as one of the weaker cyclical themes- Japan- turned negative. The offset to cyclical weakness, however, was a rising trend for a number of global consumer stocks. We are focusing on MCD today although a similar case could be made for Coca Cola (KO).
From the spring of 2006 into the end of 2010 copper futures prices traded below 4.00 while the share price of MCD trended higher. While one might not look to the base metals markets when analyzing the trend for MCD the chart suggests that there may be a causal link between the upside break for copper and the price roll over for MCD.
Our view is that this may well be important. If the markets are throwing us a curve then similar to heating oil in early 2003 the break out will be temporary with copper prices failing rather briskly back below 3.50 before starting the price building process once again. In this case the bullish trend for MCD would be extended in the same manner that Boston Scientific added to its gains from 2003 into 2004. However… if copper prices continue to hold above 4.00 then all kinds of trends are in the process of ending and starting. We will look at a couple of notable examples below.
Equity/Bond Markets
We are going to try to ignore what we think ‘should’ be happening and focus instead on what appears to be happening. In other words we have argued in the past that the trend for copper prices is similar to the trend for the Asian equity markets which are also similar to the trends for the commodity currencies. To suggest that copper price strength may be a negative for the Asian equity markets is intuitively difficult for us but… if that is the way the markets are responding then we need to accept it (for the time being at least).
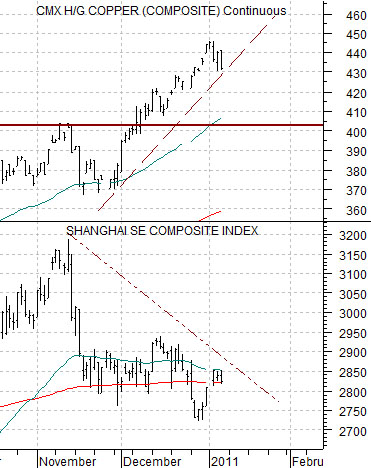
Below is a chart of copper futures and the Shanghai Composite Index.
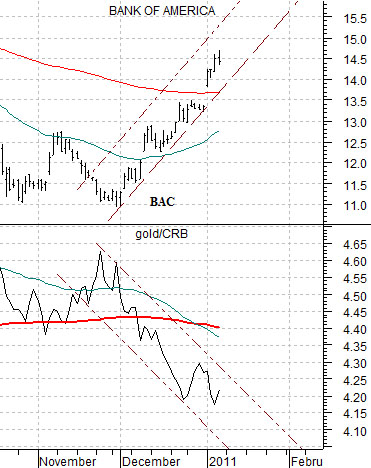
Next is a chart of the Bank of America (BAC) and the ratio between gold and the CRB Index.
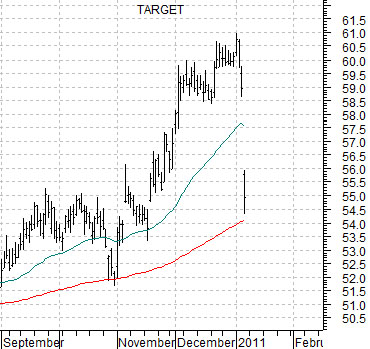
Below is a chart of U.S. retailer Target (TGT).
When copper prices began to rise in November the trend for the Shanghai Comp. began to weaken somewhat. This might be explained by the fact that rising copper prices were more a function of strength in U.S. economy which, in turn, helped turn the dollar higher.
When copper prices rise it usually means that there is upward pressure on interest rates. The recovery in the U.S. economy helped swing the share prices of U.S. banks upwards as gold prices started to weaken relative to the CRB Index.
Copper prices moving to new all time highs appears to created a trend that may be negative for the Asian equity markets and gold while being positive for the banks. The initial reaction to the trend (i.e. McDonalds) suggests some downward pressure on valuations in the defensive sectors.
The price decline for Target yesterday may be linked in some way to the trend changes discussed above. Typically Target (and Amazon) outperform Wal Mart when Asian growth is strong and rising. If the Hang Seng Index, Shanghai Comp., and commodity currencies start to weaken then look for Wal Mart to outperform TGT.