

Over the last several years we have seen natural gas drop like a rock.
A quick glance at a chart from 2008 and one would have thought natural gas would end up being practically free with the rate of decay it had been in. But in 2012 that decline hit a bottom and we have seen a nice recovery over the last year in the energy commodity.
The United States Natural Gas ETF (UNG) is currently up 12% year-to-date, while U.S. stocks (based on the S&P 500) are up just under 9.5%. However it appears some headwinds might be coming into place for the gas ETF.
TAKE A LOOK AT THE TECHNICALS
As the chart below shows, we have a falling trendline that was created from the lower lows in October and November of last year that would act as resistance just above the $21.50 level. We have another trendline that started in April of last year that become resistance during the first month of 2013 and is coming into play near $21.50 as well. Looking at the natural gas market Monday morning it appears we will open above this level. I’ll be watching for a close on strong volume in order to trust any form of a breakout.
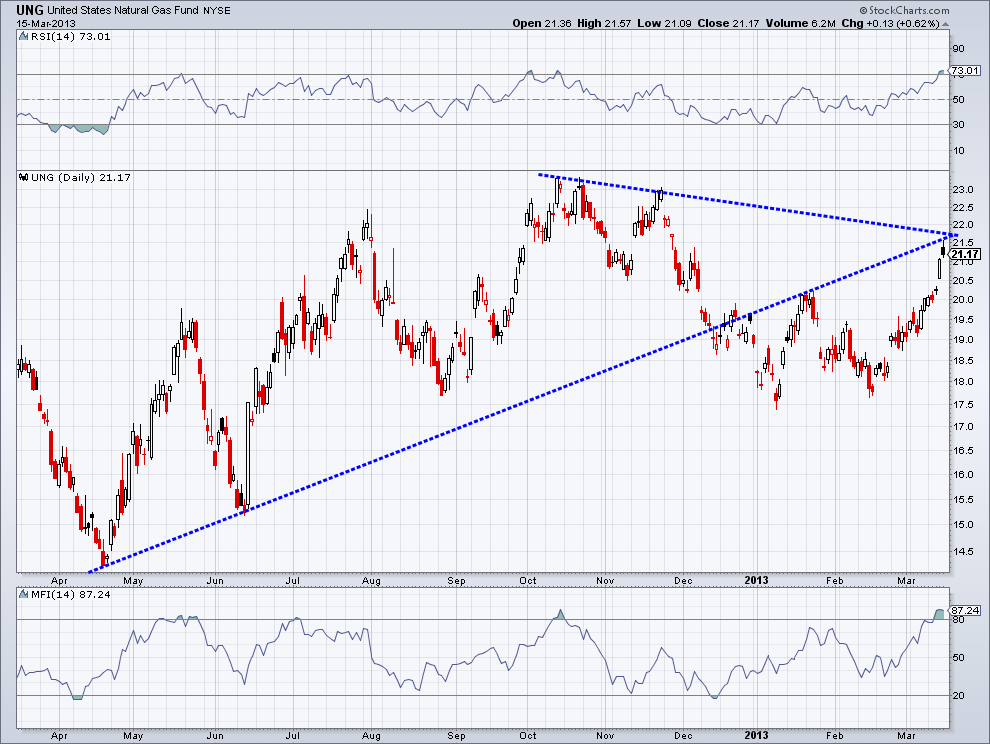
Turning our attention to momentum, we have traditionally overbought Relative Strength Index and Money Flow Index indicators. Overbought momentum can be healthy. We don’t want to assume just because momentum is overextended that UNG will weaken. What we can look for is a divergence if RSI and MFI begin to drop while shares of UNG continue to appreciate.
YELLOW FLAG
This is exactly what we saw in Oct. ’12 when UNG hit $23 and then fell to $17.50. Overbought momentum is just a yellow flag to an uptrend, something that can be worked off in a form of price and/or time. However if price begins to falter and is unable to keep above the two mentioned trend lines or if a divergence is created then we the headwinds mentioned may be too much for nat gas bulls to overcome.
We’ll see how price plays out and what the market deems important.
Disclaimer: The information contained in this article should not be construed as investment advice, research, or an offer to buy or sell securities. Everything written here is meant for educational and entertainment purposes only. I or my affiliates may hold positions in securities mentioned.
= = =

