

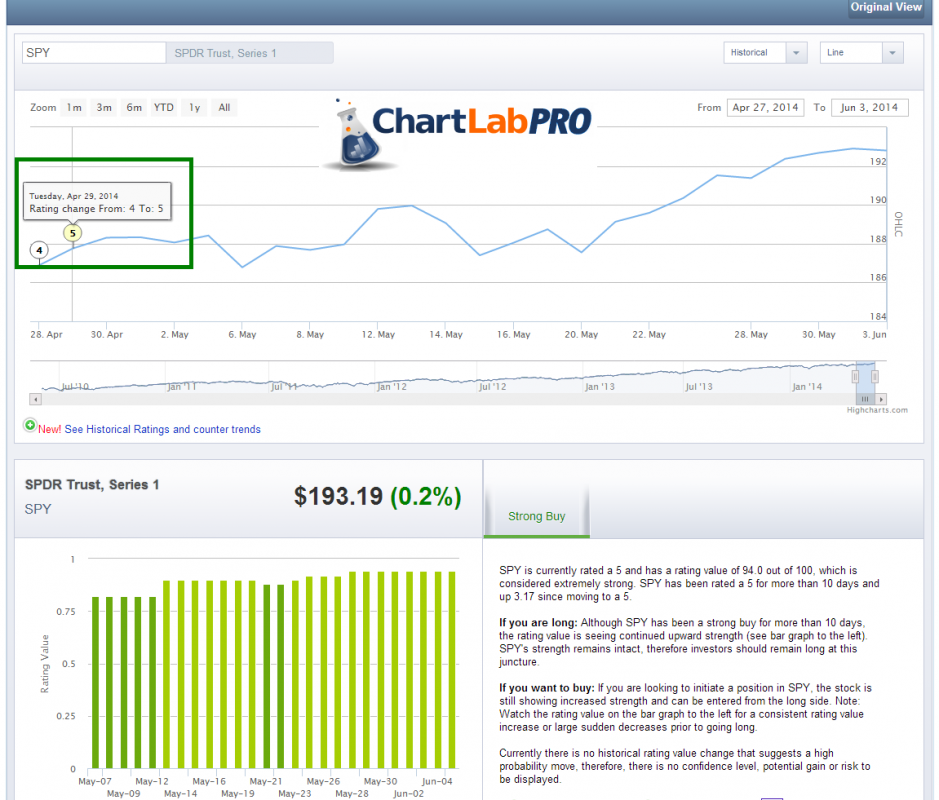
S&P 500 update: Back on April 29 ChartLabPro.com went to a Strong Buy (5) from a Buy (4) and since then our model has been getting stronger. The market is far from overbought on a longer term trend. We are currently reading a -.29 on our counter trend model, a -.65 is where we start reduces some equity exposure.
On a shorter time frame, the S&P 500 is 2.25 Standard Deviations above the 50 day moving average, which is getting expend on a short term basis. However, since most of ChartLabPro.com is longer term trend following we focus more on the counter trend model for reduction in equity exposure. Depending on your time horizon, traders and investors should be aware of their own defined risk.
Any thought of the index not following through, to the upside last week, was quickly negated last Tuesday. The index finally continued significantly higher on its third attempt to clear the sideways congestion dating back to February.
A measurement of that congestion, and subsequent breakout should measure an upside objective toward the 1940.00 – 1960.00 region. Just note, daily ranges have been tight as the volatility in this market has dropped by 30% recently. Therefore, profit taking (downside corrections) can ensue swiftly and with little warning.
Major trend support, dating back to July of last year (depicted by the red up-trend line), is currently positioned at 1830.00.
= = =
For more information visit www.chartlabpro.com

