

As a trader with a longer time frame, the U.S. Dollar Index can be one of your most useful tools even if you never plan to trade the futures contract directly. Monitoring the index with an eye toward continuation and reversal patterns lends a real edge in the timing and targeting of forex trades. More generally, an understanding of where the U.S. Dollar is headed provides context for planning trades in precious metals as well as other commodities.
This year, the Dollar Index has an important message for traders and investors: expect continued deflation for at least two more years and possibly much longer.
In future posts here, we will refer back to the Dollar Index occasionally when identifying trades in gold, the Euro, the Yen, copper, energy products, etc. However, this week we present an Elliott wave “road map” for the index itself.
As shown on the monthly chart, the Dollar appears to be in the midst of an impulsive (i)-(ii)-(iii)-(iv)-(v) move up from its 2011 higher low – a move which is structurally the counterpart to the smaller rise from 2008 to 2009. If the earlier rally was either wave 1 or wave ‘A’, then the rally from 2011 is either wave 3 or wave ‘C’. (Third waves and ‘C’ waves are close cousins, and it can sometimes be difficult to distinguish between them until the larger pattern has matured.)
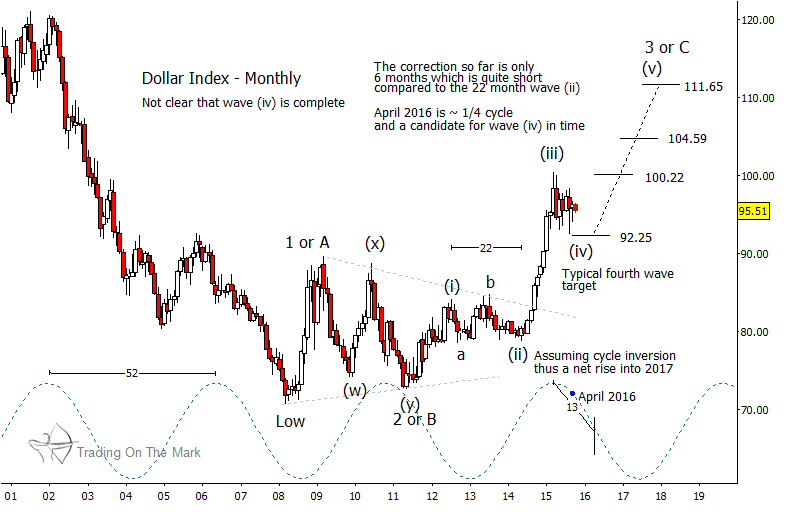
In recent months, the index found support near a typical target for internal wave (iv), and a closer analysis of a weekly chart (not shown) suggests that the 92.25 area may be tested again in early 2016 before the upward trend reasserts itself. That forecast is also consistent with the prospect of an inversion in the 52-month cycle that has coincided with the index’s turns until fairly recently. With a cycle inversion, we would expect the Dollar to find support between now and approximately April so that it may reach for higher highs into 2017.
We’d like to help you find the trades. Visit Trading On The Mark today!

