
The U.S. Dollar is the world reserve currency. Being the world reserve currency brings a variety of economic benefits to the US dollar. For example, the widespread acceptance of the dollar as an international medium of exchange reduces transaction costs for multinationals who find it unnecessary to convert currencies when making payments and receiving payments from foreign countries. Finally, a strong currency can make imports cheaper and attract foreign capital investment. All these advantages help bolster America’s position as a leader in economic affairs and make the US Dollar a cornerstone on which their economy is built.
As the world’s reserve currency, the dollar provides a number of economic benefits to the global economy. For one, it allows for greater international trade because all countries recognize it as payment. Additionally, its status as the reserve currency facilitates borrowing and lending between central banks, which bolsters global economic stability. This can be particularly helpful in times of crisis, giving nations access to capital when needed most. Lastly, all major commodities are priced in US Dollars worldwide and having this peg helps ensure a relatively stable commodity market environment.
Over the past two day, Fed Chairman has testified to the U.S. Senate Banking, Housing and Urban Affairs Committee hearing on the “Semiannual Monetary Policy Report to the Congress.” For purposes of brevity. I’ll try and summarize his testimony in two sentences. Here is what he said:
“The latest economic data have come in stronger than expected, which suggests that the ultimate level of interest rates is likely to be higher than previously anticipated. If the totality of the data were to indicate that faster tightening is warranted, we would be prepared to increase the pace of rate hikes.”
This is not what Wall Street wanted to hear. Since November, Wall Street has been whistling in the graveyard trying to convince themselves that the Fed pivot is right around the corner.
Whenever you analyze a currency there are several factors that need to be confronted to try and comprehend how value is being understood amongst traders.
With regards to the U.S. dollar here are the major factors that determine its strength or weakness.
Interest rates
Economic growth of the United States
Inflation
Political and Geopolitical Risks
International Trade Balances
Monetary Policy
Government Deficits
These are the key drivers that define risk for any currency. Since the U.S. dollar is the world’s reserve currency everyone on the planet bases the value of their currency in comparison to what is happening in the U.S. dollar. This factor cannot be overstated because during times of turmoil in foreign countries the U.S dollar acts as a safe haven and store of value.
In this weekly stock study, we will look at and analyze the following indicators and metrics as are our guidelines which dictate our behavior in deciding whether to buy, sell, or stand aside on a particular stock.
- U.S. Dollar Interest Rate Fundamentals
- Foreign Currency Performance Metrics
- 52-week high and low boundaries
- 10-Year High and Low Boundaries
- Best Case – Worst Case Analysis and Takeaways
- Correlation Analysis
- Vantagepoint A.I. Triple Cross Forecast (Predictive Blue Line)
- Neural Network Forecast
- Daily Range Forecast
- Intermarket Analysis
- Our trading suggestion
We don’t base our trading decisions on fundamental analysis. However, we do look at them to better understand the financial landscape that the U.S. dollar is operating under.
U.S. Dollar Interest Rate Fundamentals
One often overlooked but important way to determine the risks associated with different currencies is to subtract the inflation rate from the 1-year government bond for all major currencies. This calculation will provide an accurate and real rate of return, removing any possibility of distortion due to inflation or other external factors. Because this rate should be calculated across all major currencies, it can live as a baseline that investors, both private citizens and large entities alike, can use in assessing the amount of risk they would like to assume while still making money on their investments. By subtracting the inflation rate instead of ignoring it, investors are able to make more informed decisions and understand the true nature of their investment risk.
Subtracting the inflation rate from the 1-year government bond yield for all major currencies can provide a more accurate measure of how much return an investor can expect from a given investment when compared to their local cost of goods and services. This measure, known as the real rate of return, takes into account the effects of a currency’s purchasing power over time and provides investors with a more commonly accepted benchmark to determine risk in all currencies.
This simple metric shocks investors because upon performing this calculation they quickly discover that negative real rates of return have been the flavor of the day since the great financial crisis.
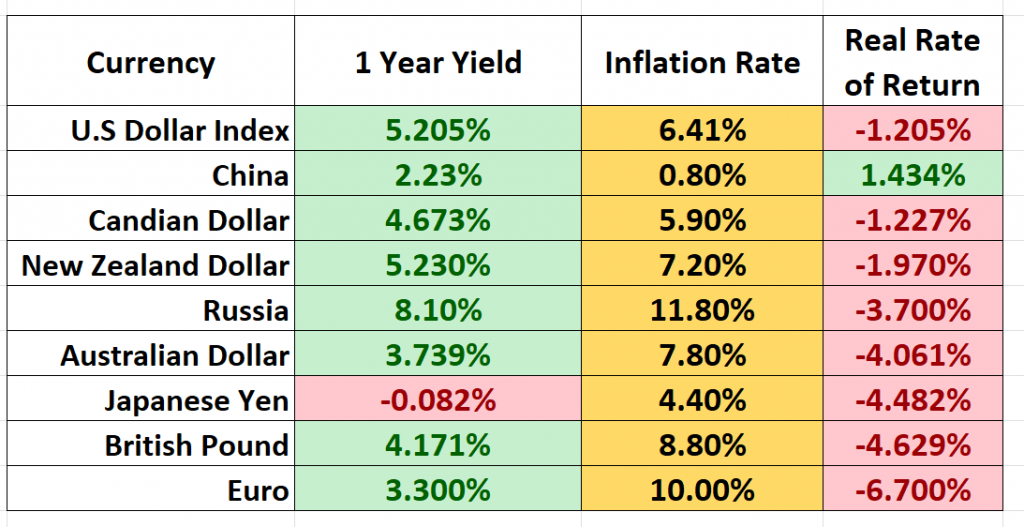
Investors and traders confront these metrics in their decision making every day. Observe how according to these simple numbers China is the only country offering a positive real rate of return! It is fair to be skeptical of Chinas economic reports. Last year they reported a 3% GDP growth rate. What makes that number so difficult to believe is that their largest port and trade center Shanghai was shut down completely for 2 months.
When you subtract inflation from the 1 year treasury you can see the United States is still the cleanest dirty shirt on the rack. It is offering a negative 1.205% return. The U.S is closely followed by Canada and New Zealand.
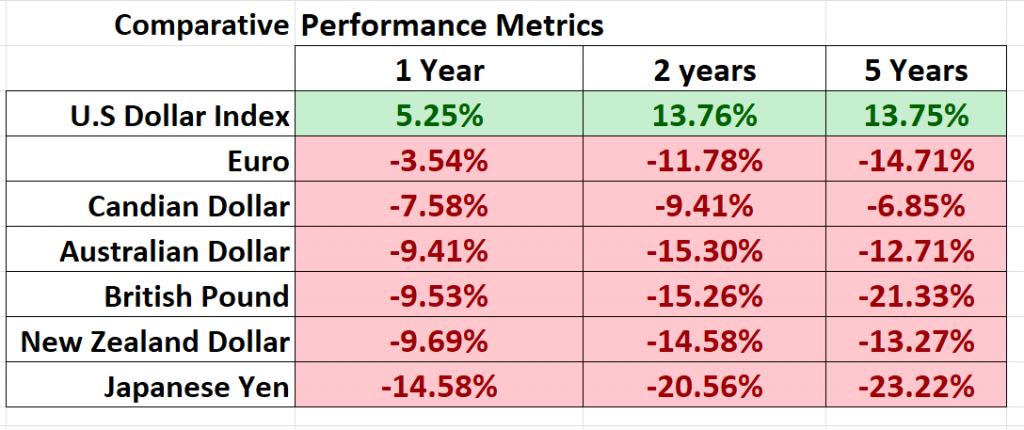
Performance Metrics U.S. Dollar versus Foreign Currencies
The simplest and fastest way to understand and appreciate foreign currency risk is to simply compare the U.S. Dollar performance against the major forex pairs for 1 year, 2 years and 5-year time frames.
When you do this, the conclusion is that the Dollar is the benchmark all currencies compare themselves to.
With all the economic uncertainty of the last few years the U.S. dollar has acted like a magnet to draw capital from around the world. This is because it has offered a higher real rate of return than other foreign currencies and has offered less currency risk.

52-Week High and Low Boundaries
Looking at the Long-Term chart of U.S. DOLLAR ($DXY) provides us with the 52-week high and low boundaries.
Over the past year we have seen U.S. Dollar ($DXY) trade as low as $98.309 and as high as $114.778. The U.S. Dollar is trading at is 44th percentile of its annual range.
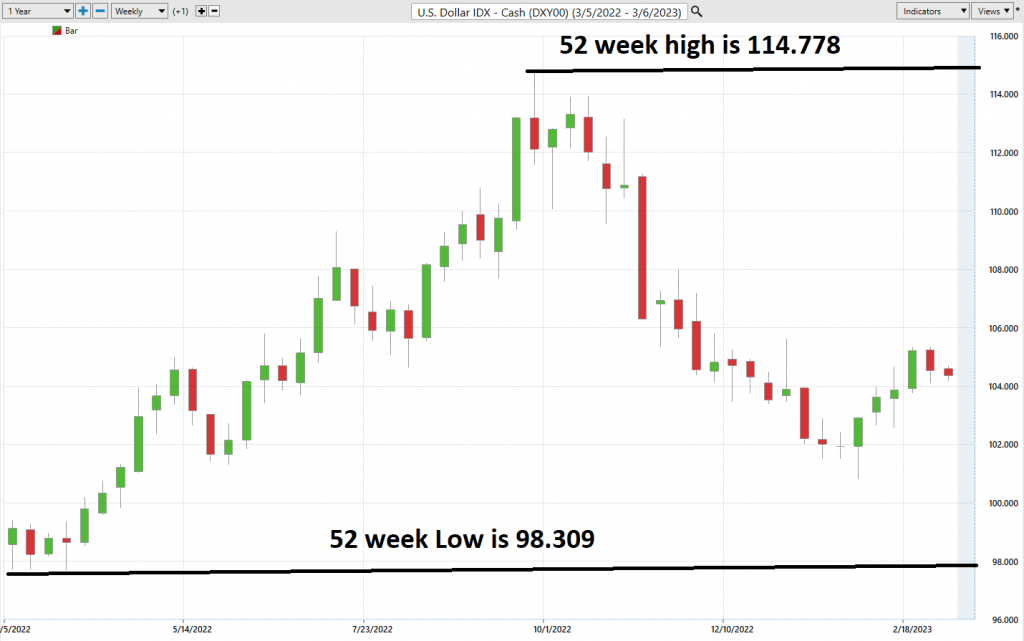
What we would also like to do is to divide the current price by the annual trading range to get a measure of annualized volatility. This metric tells us what we can expect over the next 12 months should it be like the last 12 months. Currently, the annualized volatility in $U.S. Dollar ($DXY) is 15.6%. What this metric tells us is that if the next 12 months are driven by the exact same factors as the last 12 months, it would be considered normal to see U.S. Dollar ($DXY) trade as much as 15.6% higher and lower than its current price level. For a currency this is considered hyper-volatile.
Equally as important is that being aware of the statistical volatility provides us with a benchmark value that usually hinders rallies and offers support during market declines.
10-Year High and Low Boundaries
Simply looking at the 10-year monthly chart of the U.S. dollar you can see that over the last 12 months it broke out from a sideways channel, made new highs and has pulled back to old resistance.
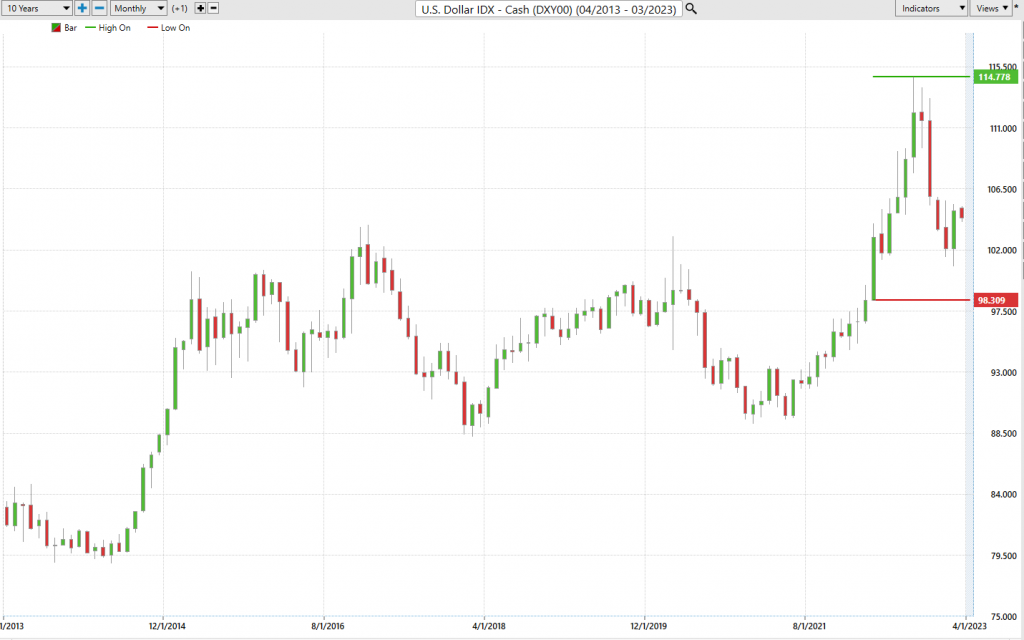
On the 10 year monthly chart the U.S. dollar is trading at its 74th percentile of its 10 year range.
Best Case – Worst Case Scenario
When we study the long-term 52-week chart we can look at the best case and worst-case scenarios just to get an eyeball perspective of the risk and volatility of this asset. This is worth doing anytime you invest or trade to monetarily understand what the potential risks and rewards have been over the past year. All we’re looking to analyze is the distance and speed between highs and lows over a given year.
It is worth doing this type of baseline analysis because it allows you to visually ascertain how quickly an asset drops in comparison to the speed with which it moves higher. Normally you will find that rallies and declines are contained within the annualized statistical volatility.
First, we do the Best-Case analysis:
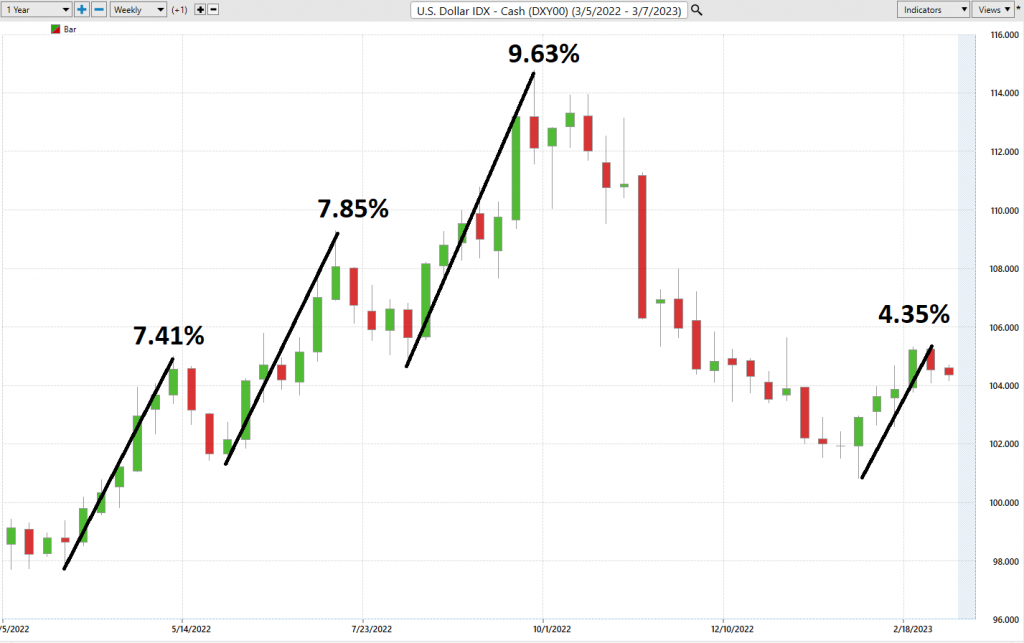
Followed by the WORST-CASE Analysis:
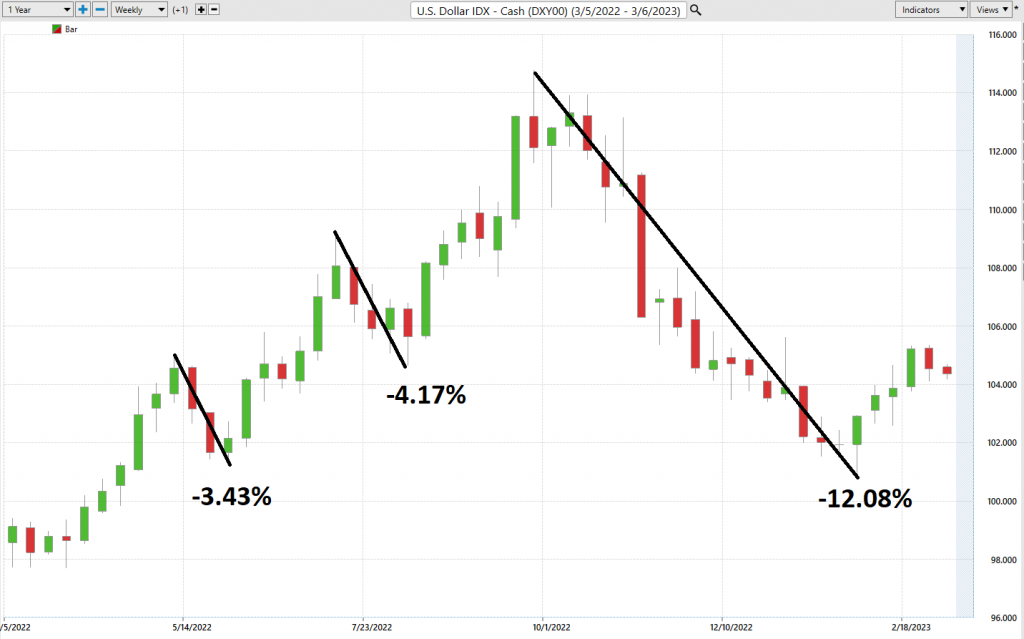
This initial analysis lets us see how quickly U.S. Dollar ($DXY) falls in comparison to its rallies.
Also note how the statistical volatility which we just reviewed in the previous section capped the rallies and declines over the last year.
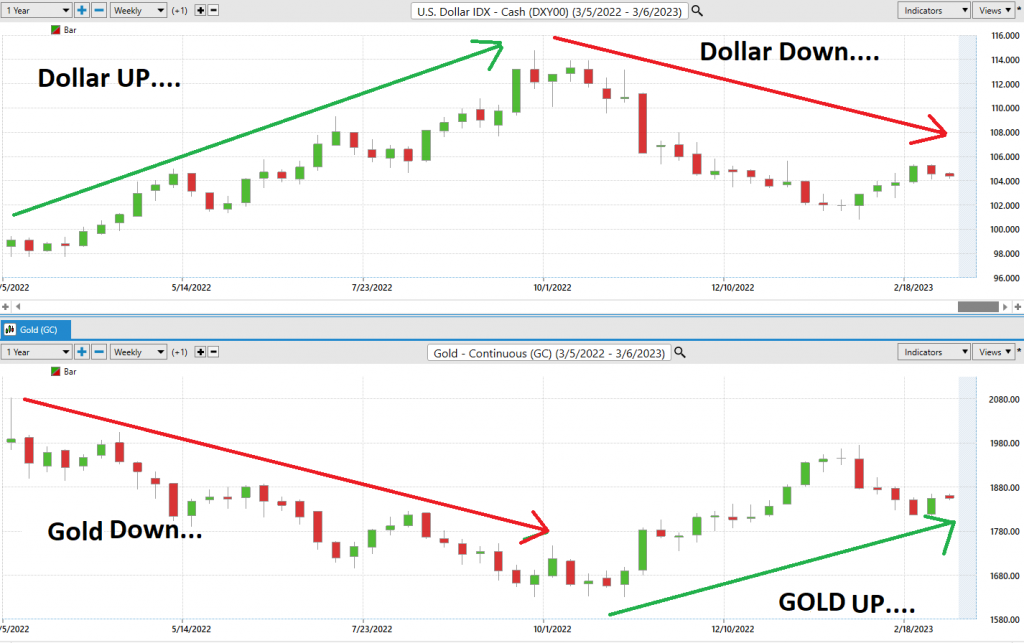
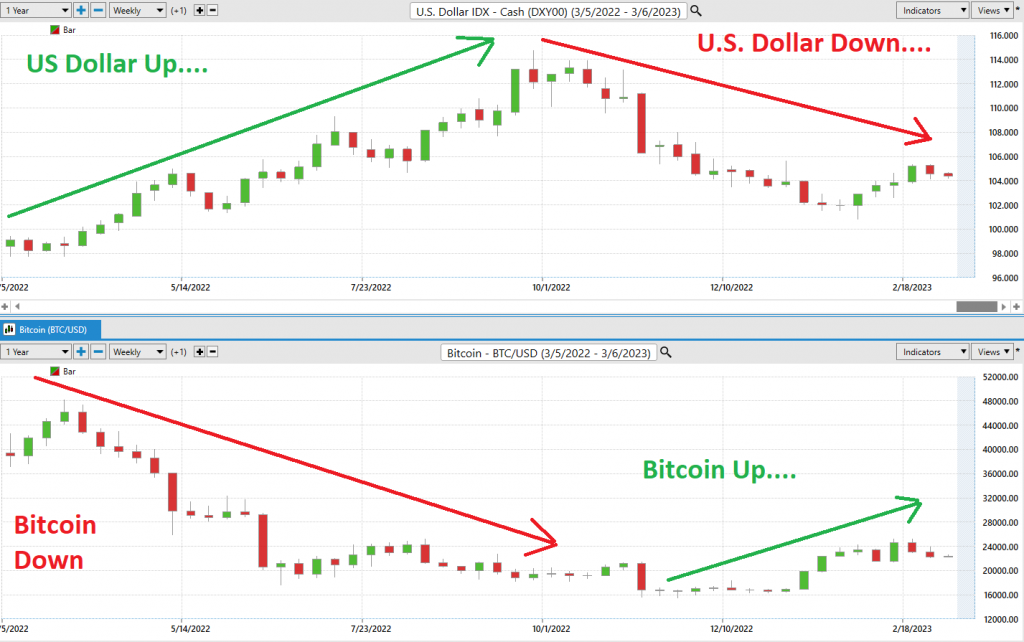
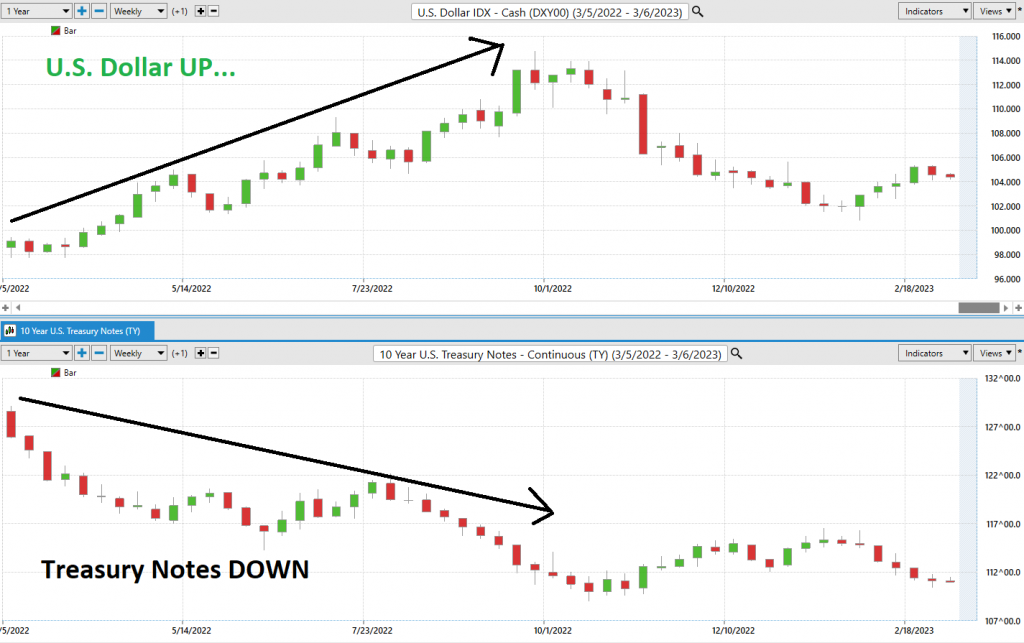
Correlation Analysis
Next, to understand the importance of the U.S. dollar we want to do a correlation analysis to some of the larger markets.
It is fair to say that when the dollar goes UP. Everything else goes down. While this may sound like hyperbole, simply look at the charts and decide for yourself.
First let’s look at Gold.
Next, let’s look at Bitcoin.
Next let’s look at Treasury Notes…
Lastly, let’s look at the strong inverse correlation between the U.S. Dollar and the S&P 500 Index.
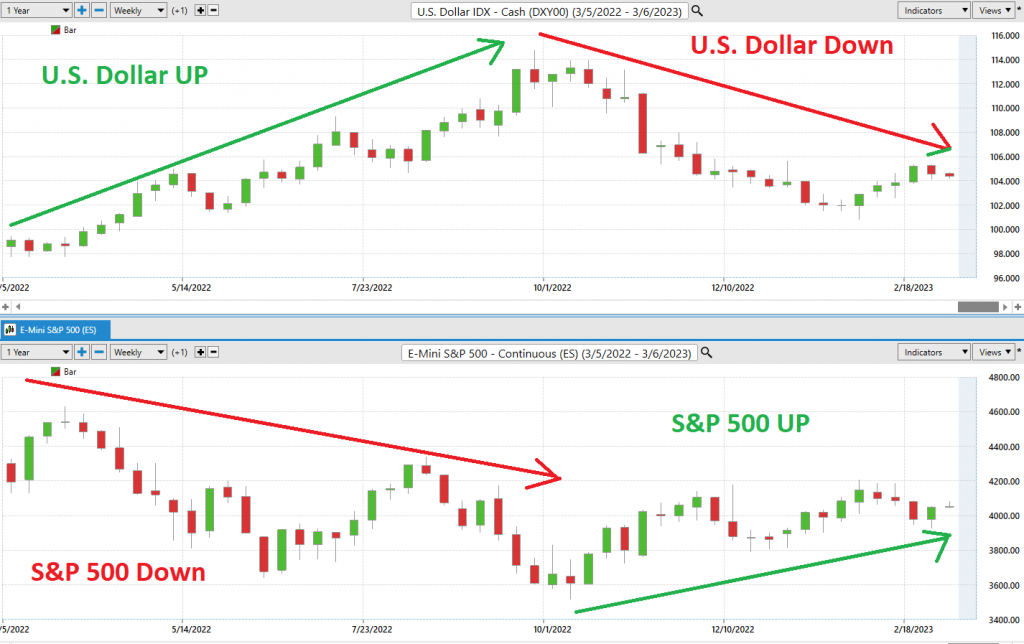
If you are looking for a stock market rally, we are going to need the $U.S. dollar to decline.
By analyzing the correlation between different markets, traders are able to better assess their risk and determine which investments have the highest potential reward. An inverse correlation between two markets can be used as a financial indicator of tumultuous times ahead, when the price of one asset moves in the opposite direction to another. This can act as a warning sign for traders and allow them to take steps to minimize potential losses. Knowing that multiple markets are connected in an inverse way also helps investors plan their trades wisely and make smarter decisions when entering any deal. Overall, recognizing inverse correlations between markets gives investors an edge.
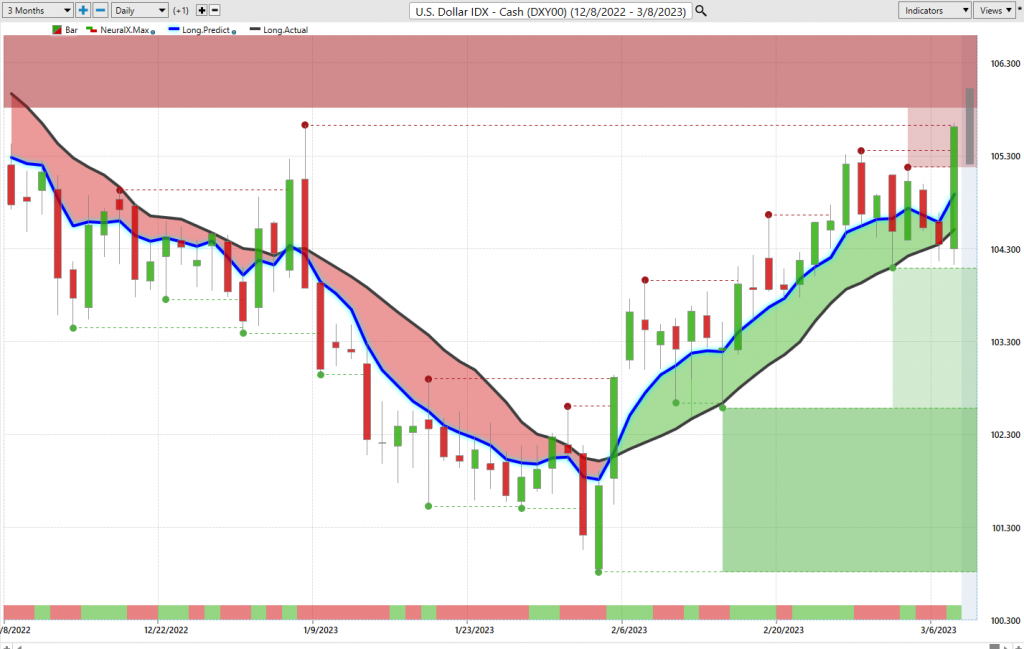
Vantagepoint A.I. Forecast (Predictive Blue Line)
On the following chart you will see the power of the VantagePoint Predictive blue line which determines the medium term trend price forecast.
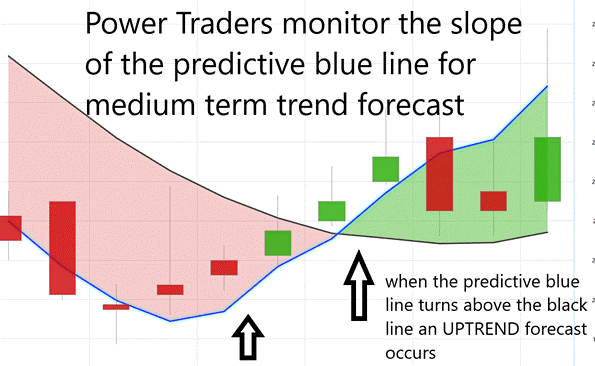
The guidelines we abide by are as follows:
- The slope of the predictive blue line determines the trend forecast and general direction of U.S. Dollar ($DXY)
- Ideally, the VALUE ZONE is determined to try and find buy opportunities at or below the predictive blue line, or to sell opportunities above the predictive blue line during a downtrend.
Naturally when the predictive blue line slopes lower traders would be anticipating lower prices and either moving to the sidelines or hedging their positions.
Using VantagePoint Software and the artificial intelligence, traders are alerted to trend forecasts by monitoring the slope of the predictive blue line.
The predictive blue line, however, utilizes the VantagePoint-patented Neural Network and Intermarket Analysis to arrive at its value. It looks at the strongest price drivers of an asset through artificial intelligence and statistical correlations to determine its value.
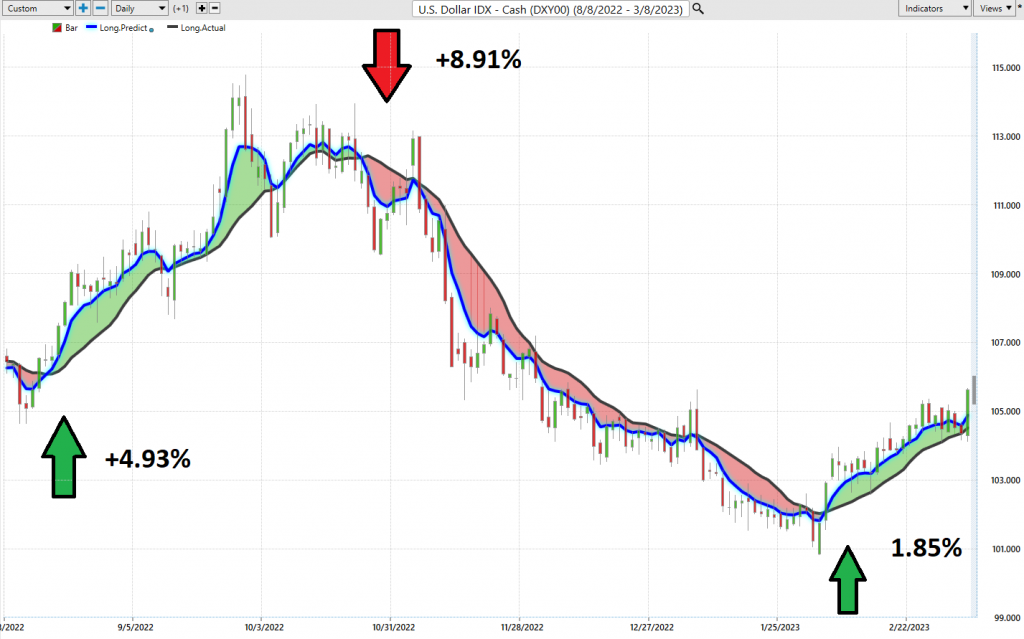
Over the last 7 months there have been 3 very clear a.i. trend forecasts in the U.S. Dollar.
All three were winners.
You can quickly understand what the artificial intelligence is forecasting by simply looking at the chart. Also, observe the duration of each trend forecast was very brief.
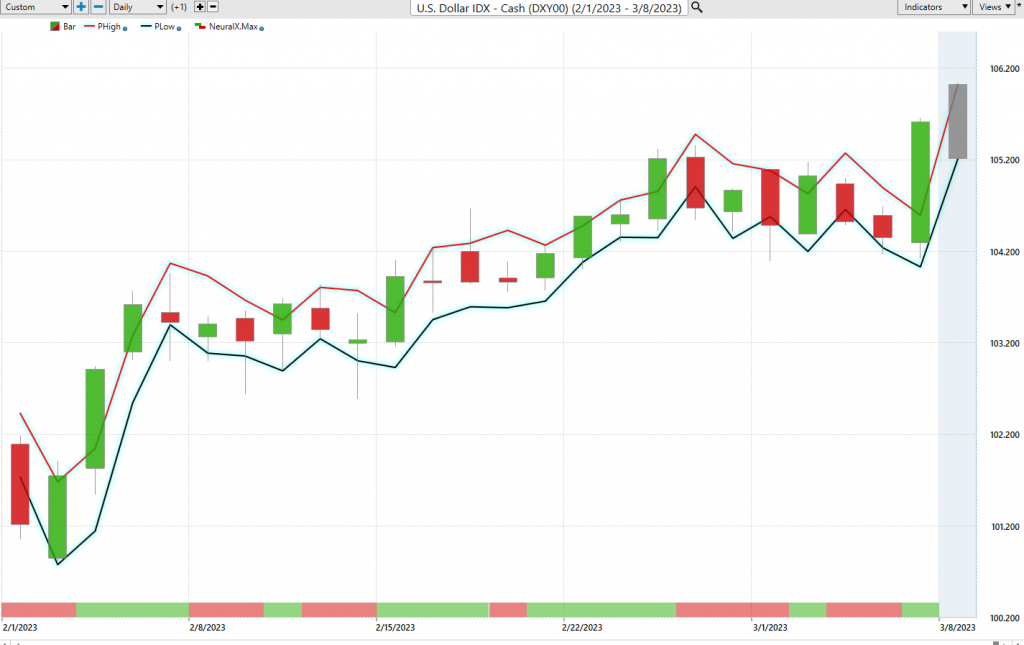
Neural Network Indicator (Machine Learning)
At the bottom of the chart is the Neural Network Indicator which predicts future short-term strength and/or weakness in the market. When the Neural Net Indicator is green it communicates strength. When the Neural Net is Red it is forecasting short term weakness in the market. When it is yellow it is anticipating sideways prices.
A Neural Net is a computational learning system that uses a network of functions to understand and translate massive amounts of data into a desired output, consistently monitoring itself and improving its performance. A neural network in trading is a type of artificial intelligence system that uses algorithms to learn patterns in financial markets and make predictions about future market behavior. This can give traders a distinct advantage over those not using these systems, as they have access to more precise market insights and opportunities with deeper analysis. Furthermore, neural networks can detect subtle variations in behavior that may be missed by human analysts due to their sheer speed and accuracy in evaluating markets.
Neural Networks are essentially trainable algorithms that emulate aspects of the human brain. This means they can be trained based upon criteria for assessing risk and potential reward to determine the best move forward. This allows them to make high probability forecasts based on available historical information.
We advocate that Power Traders cross reference the chart with the predictive blue line and neural network indicator to create optimal entry and exit points.
For the serious trader, neural networks are a next-generation trading tool that can detect subtle non-linear interdependencies and patterns that traditional methods of technical analysis are unable to uncover.
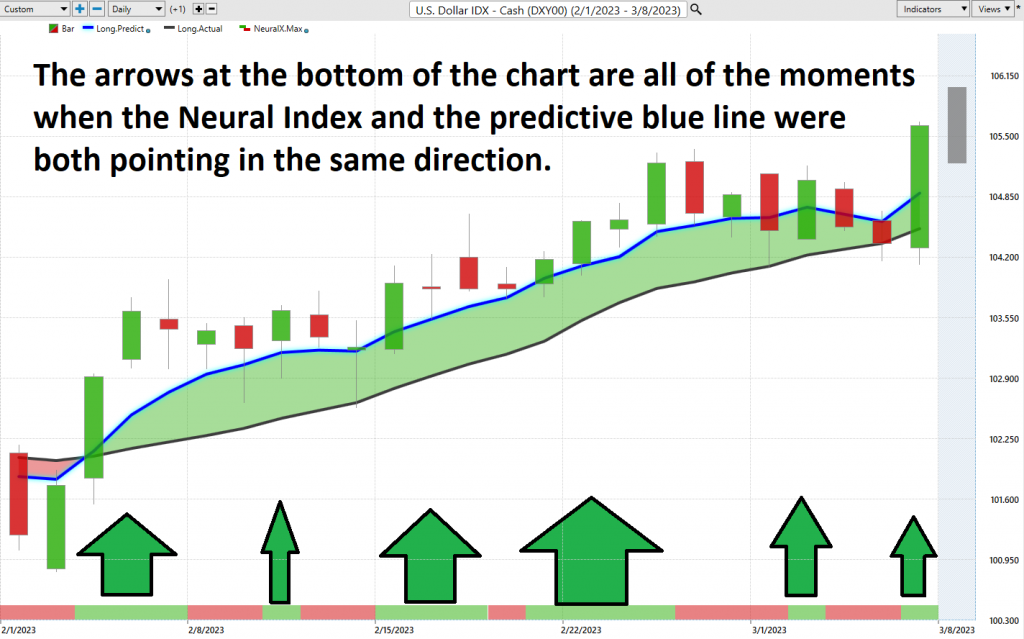
Traders look for confirmation on Neural Net to position themselves LONG or SHORT in the market. In other words, when the A.I. forecast is green, and The Neural Net is green, that presents a buying opportunity.
The inverse is also true, when the A.I. forecast is red and the Neural Net is red, that is a selling opportunity. The arrows on the chart below highlight the trading zones where Power Traders would’ve been using double confirmation to BUY in cross referencing the A.I. forecast with the Neural Net.
The arrows on the chart are the moments when the a.i. and the neural index were both pointing in the same direction.
Power Traders are always looking to apply both the Neural Network and A.I. to the markets to find statistically sound trading opportunities.
VantagePoint Software Daily Price Range Prediction
We will zoom in in on the last 1 month of price action so that you can see for yourself how the a.i. and machine learning combine to create a very accurate daily price range forecast that keeps traders focused on optimal trade placement.
But let’s first look at the Vantagepoint Verified Support and Resistance Levels.
We can see from the chart above that the U.S. Dollar is testing a very strong resistance area. This zone if successfully breached will send the dollar several percentage points higher.
When we zoom in and look at the VantagePoint Daily Range forecast this is where we see the exacting precision of the Daily Range Forecast. Every day a predicted high and low price is provided to traders, which is essential in knowing where to buy and sell for short-term traders.
One of the powerful features in the VantagePoint Software which Power Traders use daily is the Price Range prediction forecast.
Every day traders are faced with the anxiety and frustration of wondering where they should be looking to buy and sell the market. VantagePoint’s A.I. makes this decision super easy with the Daily Price Range Forecast.
This chart helps traders decide where stop placement should occur. Observing how placing protective sell stops below the dark line on the chart was a powerful way to minimize risk on this trade.
See how the upper and lower bands of the price range forecast for a clear channel of trading activity as well. Swing traders are always looking for buying opportunities towards the bottom of the predicted channel and try to find selling opportunities above the top band.
Intermarket Analysis
Power lies in the way we respond to the truth we understand.
One of the supremely important questions in trading is what is driving the price? Headlines often create interesting narratives. But these “stories” only capture the imagination. Traders want and need to understand the cause and effect of price movement.
The only way to get an answer to this important question is through intermarket analysis which looks at the key drivers of an asset and the statistical price correlations of assets.
We live in a global marketplace.
Everything is interconnected.
Analyzing intermarket relationships is a complex process that leaves no stone unturned.
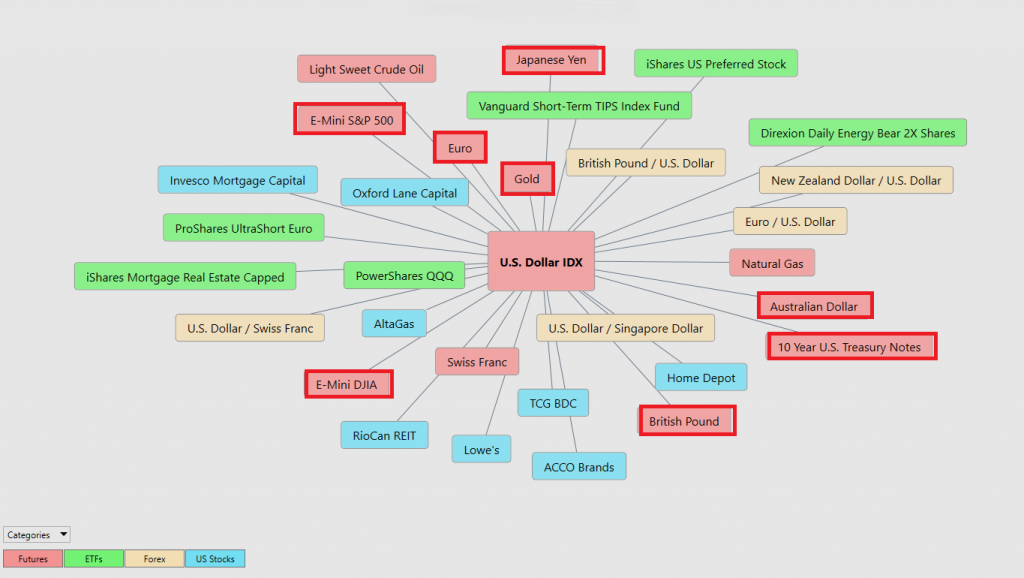
Interest rates, U.S. Dollar ($DXY) Prices, and the volatility of the Dollar amongst thousands of other variables affect the decisions companies must make to flourish and prosper in these particularly challenging times. Trying to determine what these factors are is one of the huge problems facing investors and traders.
Intermarket analysis is a powerful tool for currency traders to have in their arsenal. It involves analyzing performance across various industries – commodities, stocks, and bonds – as an indicator of future market movements of individual currency pairs. By studying the influence between different markets and price trends, intermarket analysis can provide insight into whether a particular currency pair is gaining strength or getting weaker. This information gives traders an opportunity to act accordingly and take advantage of available opportunities in the market. For example, if the performance of one commodity suggests that a certain currency pair is declining, then it’s likely time to sell that pair and look for better opportunities elsewhere.
You always have a choice. You can tune in to the talking heads in the media who spin talking points which promote fear. Or you can rely on facts to base your decision making on.
Within the Intermarket Analysis graphic, you will see the 31 markets that are the key drivers of U.S. Dollar ($DXY)’s price.
I have highlighted in red those markets that have a strong inverse correlation to the dollar that we reviewed in this asset study.
Trading Suggestion
The U.S. dollar received tremendous benefits by being the world’s reserve currency.
From an interest rate differential perspective, the U.S. dollar is the ONLY GAME in town. As far as fiat currencies go it is the cleanest dirty shirt on the rack.

When you compare this real rate of return analysis with performance metrics for all foreign currencies the U.S. dollar remains king of the hill.
The U.S> dollar will continue to act as a safe haven as money leaves jurisdictions where it is penalized. So, as we analyze the fate of the U.S. dollar, it is not a bet on the strength of the U.S. economy but rather a bet on the weakness or chaos in the rest of the world comparatively.
Fed Chairman Powell has stated that he foresees higher interest rates moving forward. In my estimation Chairman Powell is simply trying to keep the real rate of return for the U.S. economy higher than any of our allies.
Money continues to move into the U.S. dollar. Where it goes when it arrives here is the trillion dollar speculators’ question.
The trend is UP.
The Neural Network forecast is positive.
While these two conditions exist stocks will suffer.
Pay attention to the a.i. forecast and practice good money management on your trades.
Based upon these realities we will use the daily range forecast to position ourselves on the long side for short-term swing trading opportunities.

Place U.S. Dollar ($DXY) on your radar for numerous trading opportunities in 2023.
Our recommendation is to follow the A.I. trend analysis as outlined in this asset study and practice good money management in all trades.
Let’s Be Careful Out There!
It’s Not Magic.
It’s Machine Learning.

IMPORTANT NOTICE!
THERE IS SUBSTANTIAL RISK OF LOSS ASSOCIATED WITH TRADING. ONLY RISK CAPITAL SHOULD BE USED TO TRADE. TRADING STOCKS, FUTURES, OPTIONS, FOREX, AND ETFs IS NOT SUITABLE FOR EVERYONE.
DISCLAIMER: STOCKS, FUTURES, OPTIONS, ETFs AND CURRENCY TRADING ALL HAVE LARGE POTENTIAL REWARDS, BUT THEY ALSO HAVE LARGE POTENTIAL RISK. YOU MUST BE AWARE OF THE RISKS AND BE WILLING TO ACCEPT THEM IN ORDER TO INVEST IN THESE MARKETS. DON’T TRADE WITH MONEY YOU CAN’T AFFORD TO LOSE. THIS ARTICLE AND WEBSITE IS NEITHER A SOLICITATION NOR AN OFFER TO BUY/SELL FUTURES, OPTIONS, STOCKS, OR CURRENCIES. NO REPRESENTATION IS BEING MADE THAT ANY ACCOUNT WILL OR IS LIKELY TO ACHIEVE PROFITS OR LOSSES SIMILAR TO THOSE DISCUSSED ON THIS ARTICLE OR WEBSITE. THE PAST PERFORMANCE OF ANY TRADING SYSTEM OR METHODOLOGY IS NOT NECESSARILY INDICATIVE OF FUTURE RESULTS. CFTC RULE 4.41 – HYPOTHETICAL OR SIMULATED PERFORMANCE RESULTS HAVE CERTAIN LIMITATIONS. UNLIKE AN ACTUAL PERFORMANCE RECORD, SIMULATED RESULTS DO NOT REPRESENT ACTUAL TRADING. ALSO, SINCE THE TRADES HAVE NOT BEEN EXECUTED, THE RESULTS MAY HAVE UNDER-OR-OVER COMPENSATED FOR THE IMPACT, IF ANY, OF CERTAIN MARKET FACTORS, SUCH AS LACK OF LIQUIDITY. SIMULATED TRADING PROGRAMS IN GENERAL ARE ALSO SUBJECT TO THE FACT THAT THEY ARE DESIGNED WITH THE BENEFIT OF HINDSIGHT. NO REPRESENTATION IS BEING MADE THAT ANY ACCOUNT WILL OR IS LIKELY TO ACHIEVE PROFIT OR LOSSES SIMILAR TO THOSE SHOWN.

