
p>An Analysis on the failures of Silicon Valley Bank ($SIVB) and Signature Bank ($SBNY)
Fourteen and a half years ago, Lehman Brothers failed and triggered the greatest financial calamity since the Great Depression. During the great financial crisis that wreaked havoc on global economies, a particular term known as “toxic assets” emerged and left an indelible mark on the financial landscape. These toxic assets were primarily composed of mortgage-backed securities (MBS) and other financial instruments that had been widely traded by banks and investors but had lost significant value due to the collapse of the housing market. As homeowners defaulted on their loans en masse and property values plummeted, the MBS and related instruments became essentially worthless, causing severe damage to financial institutions’ balance sheets. The uncertainty and lack of transparency surrounding these toxic assets further exacerbated the crisis, as banks and investors were hesitant to conduct business with one another, fearing hidden exposure to these perilous financial instruments. Consequently, the term “toxic assets” became synonymous with the catastrophic events that characterized the great financial crisis, highlighting the crucial need for enhanced due diligence and increased financial regulation to avert similar disasters in the future.
Analysts, reporters, and media pundits are examining the wreckage of three banks which have failed in the past week. Those banks are Silicon Valley Bank ($SIVB), Signature Bank ($SBNY) and Silvergate Capital ($SI). In this stock study we will do a deep dive analysis on $SIVB and $SBNY and try to make sense of the early commentary on why these banks failed.
Initially much of the commentary surrounding the failures of these institutions related to SOLVENCY issues. There are numerous ratios and metrics used in the banking system to determine solvency of a bank. These metrics are as follows:
- Capital Adequacy Ratio (CAR) – CAR is the ratio of a bank’s capital to its risk-weighted assets. It is a measure of the bank’s ability to absorb losses and continue operating. The higher the CAR, the more solvent the bank is.
- Liquidity Ratio – This ratio measures a bank’s ability to meet its short-term obligations by comparing its liquid assets to its short-term liabilities. A higher liquidity ratio indicates that the bank has sufficient funds to cover its obligations, which is an important indicator of solvency.
- Non-Performing Assets (NPAs) – NPAs are loans and other assets that are not generating income for the bank, either because they are in default or because they are not earning interest. A high level of NPAs can be an indicator of potential solvency issues.
- Return on Assets (ROA) – ROA measures a bank’s profitability by comparing its net income to its total assets. A higher ROA indicates that the bank is generating more profit from its assets, which can be a positive sign for solvency.
- Stress Testing – This involves simulating hypothetical scenarios to assess how a bank would perform under different economic conditions, such as a recession or financial crisis. Stress testing can help to identify potential solvency issues and allow banks to take steps to address them before they become a problem.
While it is not the purpose of this study to examine all of these metrics, my conclusion as far as these solvency metrics are concerned, $SIVB and $SBNY were not displaying any massive solvency red flags that would differentiate them from the rest of the banking industry.
The classical textbook definition of solvency is the ability to meet financial obligations and remain in business. According to $SIVB’s most recent financial statement from December 31, 2022, $SIVB had 173 billion in customer deposits yet only $74 billion in loans. $SIVB did not fail because of risky lending practices. They were only lending out 42% of their customer bases deposits. $SIVB failed because they parked $119.9 billion in low-yielding U.S. Government Bonds. This portfolio was yielding 1.78%. Meanwhile, these same Government Bonds are now yielding anywhere from 3.5% to 5%. This differential is massive.
Many traders are not familiar with the vagaries and nuances of the bond market, but bonds lose value as interest rates rise.
Their 2022 annual report showed $15 billion in unrealized losses in their Treasury portfolio. The issue appears to be that they were overly heavy in government bonds and only had $16 billion is capital.
Last week $SIVB reported a $2 billion loss from liquidating some of their bond portfolio and that is where their liquidity problems started as customers began accelerating withdrawals of their deposits.
Any institution, pension fund, state, local government or individual who has purchased Treasury Bonds over the last 30 months is sitting on enormous losses right now. The FDIC who safeguards the banking system has stated that they believe that unrealized losses from Treasury Bond holding are at roughly $650 billion. Should interest rates continue to increase these losses will also increase.
There is a tremendous amount of irony in all of this. Greg Becker the CEO of $SVP sat on the board of directors of the San Francisco Federal Reserve Bank. Meanwhile, Barney Frank, the influential American politician, is best known for his role as the author of the Dodd-Frank Reform Bill, which was passed in 2010 sat on the Board of Directors of Signature Bank ($SBNY). Throughout his career, Frank consistently displayed an unwavering dedication to advocating for financial reform and consumer protection. As a member of the U.S. House of Representatives from Massachusetts, serving from 1981 to 2013, he established himself as a powerful force within the legislative body. His passion for social and economic justice led him to work closely with Senator Chris Dodd, with whom he co-wrote the comprehensive Dodd-Frank Bill. This landmark legislation was designed to address the pervasive issues that led to the 2008 financial crisis, while also safeguarding American consumers from the potential risks posed by the country’s largest banks and financial institutions. The Dodd-Frank Bill, formally known as the Dodd-Frank Wall Street Reform and Consumer Protection Act, was a transformative piece of legislation passed in response to the devastating 2008 financial crisis. Enacted in July 2010, this comprehensive law aimed to enhance the stability of the American financial system and protect everyday consumers. By implementing a series of new regulations and oversight in areas such as banking, insurance, and investment, the Dodd-Frank Bill sought to prevent the recurrence of systemic risk and the potential collapse of major financial entities. Moreover, the establishment of the Consumer Financial Protection Bureau as part of this legislation signaled a renewed focus on consumer rights and protection against deceptive and abusive financial practices.
The challenge for banking analysts and regulators moving forward is to navigate the treacherous landscape of rising interest rates. One of the common themes that I have made repeatedly in our blog over the last several years, is investing in low-yielding bonds in a high inflation environment is a recipe for financial calamity. Trillions of dollars have been invested by foreign trading partners in low yielding government bonds. It stands to reason that should they choose to liquidate their Treasury portfolios that more volatility is on the horizon.
We will look to demonstrate the effectiveness of artificial intelligence in keeping traders on the right side, of the right trend at the right time. There is no way we could tell that $SIVB and $SBNY would fail, but what will become crystal clear is that the artificial intelligence was clearly alerting traders to negative trends in both banking institutions. We recognize that most traders do not pursue the shorting of stocks. However, by simply being aware of the negative trend that a.i. was forecasting traders would have known to “stay away” from either of these banking institutions.
As you review and study the charts notice the very strong similarities in the price action of both banking institutions.
We will evaluate the following metrics and indicators.
- Wall Street Analyst’s Estimates
- 52-week high and low boundaries
- Intermarket Analysis
- Best Case – Worst Case Analysis
- VantagePoint A.I. Forecast
While we are not fundamental investors we do look at their financial metrics to simply better understand the financial backdrop and narrative that the company is working under.
Wall Street Analyst’s Estimates
Wall Street Analysts were 100% wrong on both banks. We share these estimates with you not to throw salt in their wounds but rather to demonstrate how important it is to apply multiple time frames, indicators, and metrics to your analysis for it to be able to keep you out of trouble.
The graphic below illustrates that Wall Street Analysts could not have seen a liquidity crisis occurring in these banks.
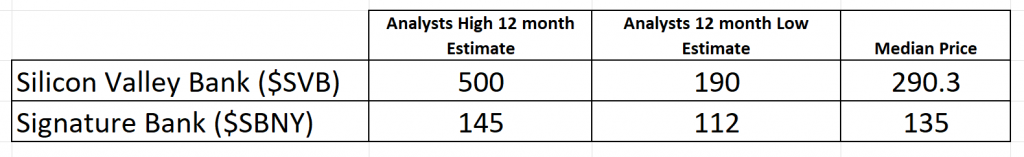
Top Wall Street analysts were extremely bullish on both assets. I am not faulting them in pointing this out. Instead, I am challenging you to make sure that you apply more than one data point to your decision-making process.
52-week high and low boundaries
Observe how both banks were in massive strong downtrends over the last 52 weeks. Over the last year, both $SIVB and $SBNY were incapable of holding gains.
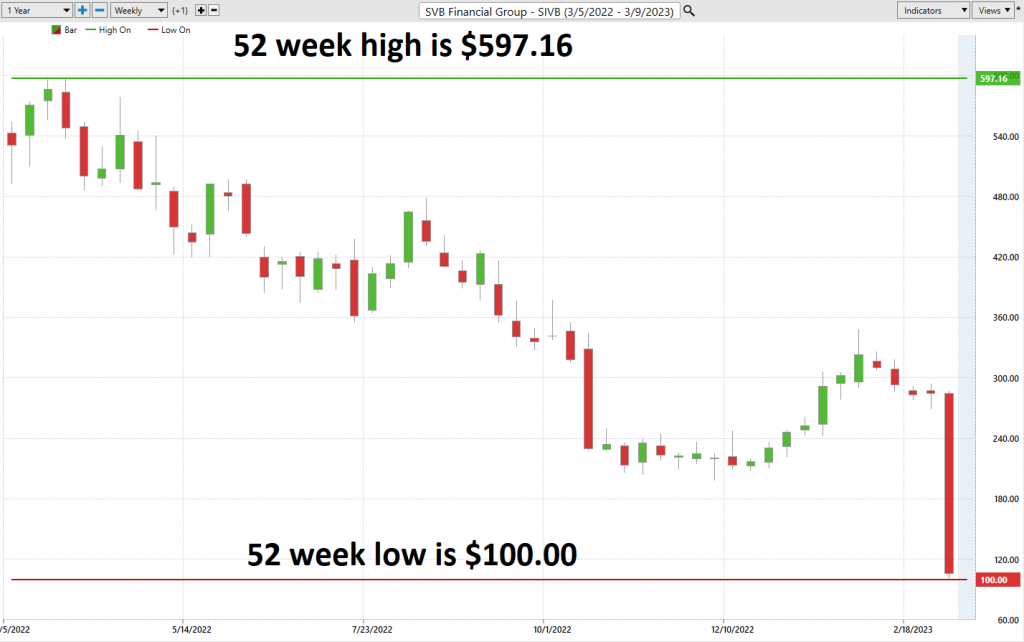
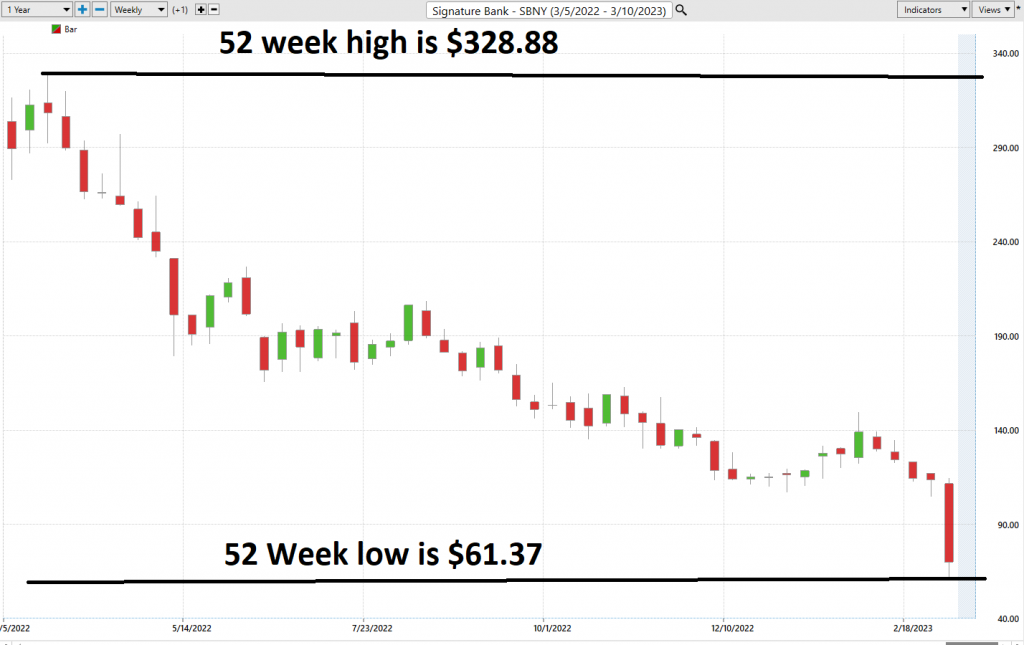
The statistical volatility on $SIVB was 468% which is a massive warning sign in and of itself.
The statistical volatility on $SBNY was 434%.
This volatility measure is very practical and easy to calculate. All you need to do is divide the annual price range by the current price. A good rule of thumb that I always follow is that whenever volatility is this sky high I turn to the options markets to try and capture option volatility with option spreads.
Intermarket Analysis
One of the most valuable analytical modules in the Vantagepoint Software is the power it offers in doing very sophisticated intermarket analysis.
Correlation analysis and intermarket analysis are two essential concepts in the world of finance and investments that share similarities and differences. At their core, both methods revolve around examining relationships between different financial instruments or markets, ultimately aiding investors and traders in making informed decisions. They delve into quantitative methods of evaluation, aiming to explore potential connections and support decision-making. However, this is where their similarities end.
While correlation analysis focuses on establishing the degree of relationship between two variables or financial assets, such as stocks or commodity prices, intermarket analysis goes further to study the linkages between different segments of financial markets. For instance, it investigates how stocks, bonds, commodities, and currency markets influence one another. This key difference makes intermarket analysis a more comprehensive approach, as it considers the complex interactions between various market elements, including global economic factors. Thus, both correlation analysis and intermarket analysis contribute to our understanding of financial data and market trends, albeit with distinctive scopes and applications.
Since $SIVB and $SBNY were both in free fall the first area of investigation would be what other stocks are intimately correlated to the price action of $SIVB and $SBNY?
A picture paints a thousand words. I have taken the liberty of highlighting in red, the numerous banking etf’s and banking stocks which have all been adversely affected by the shutting down of $SIVB and $SBNY. This is incredibly powerful in that seasoned traders can look for shorting opportunities in these stocks, or at least make sure they do not have exposure in their portfolio to these assets.
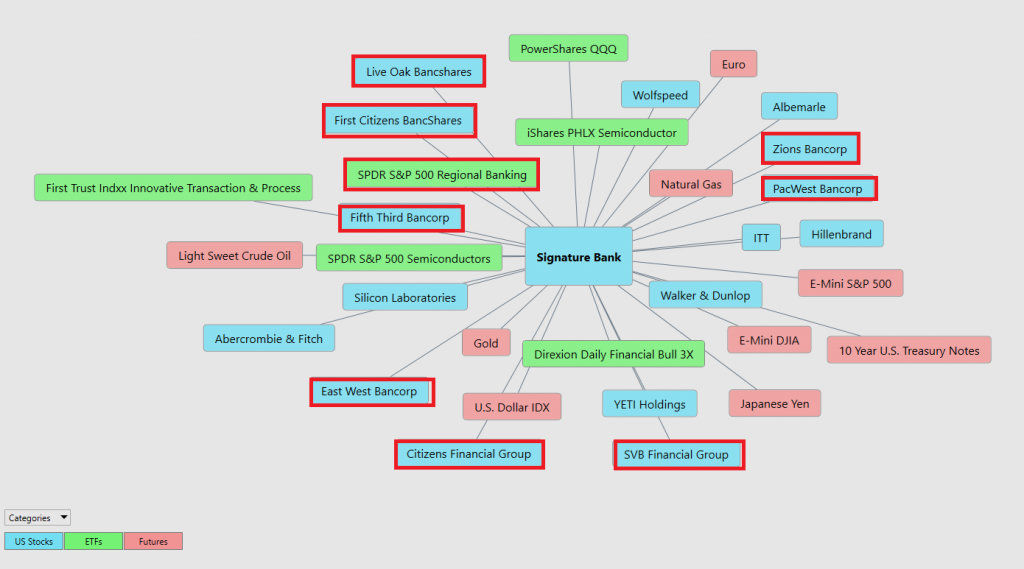
Let’s review the past 5-day performance of these highly correlated stocks which are key price drivers!
Live Oak Bancshares -25.55%
First Citizen BancShares -16.07%
SPDR S&P 500 Regional Banking -22.02%
Fifth Third Bancorp -24.92%
East West Bancorp -22.38%
Zions Bancorp -33.46%
PacWest Bancorp -58.55%
Clearly, you can see the correlation and contagion in effect. This is how artificial intelligence keeps traders out of harms way, or on the right side of the right trend at the right time.
Best Case and Worst-Case Analysis
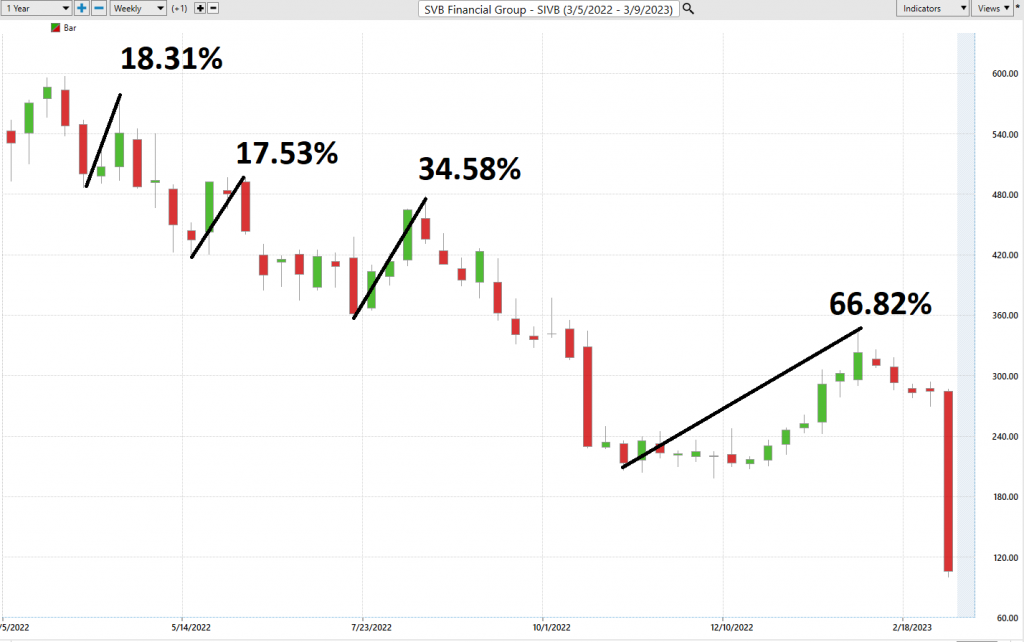
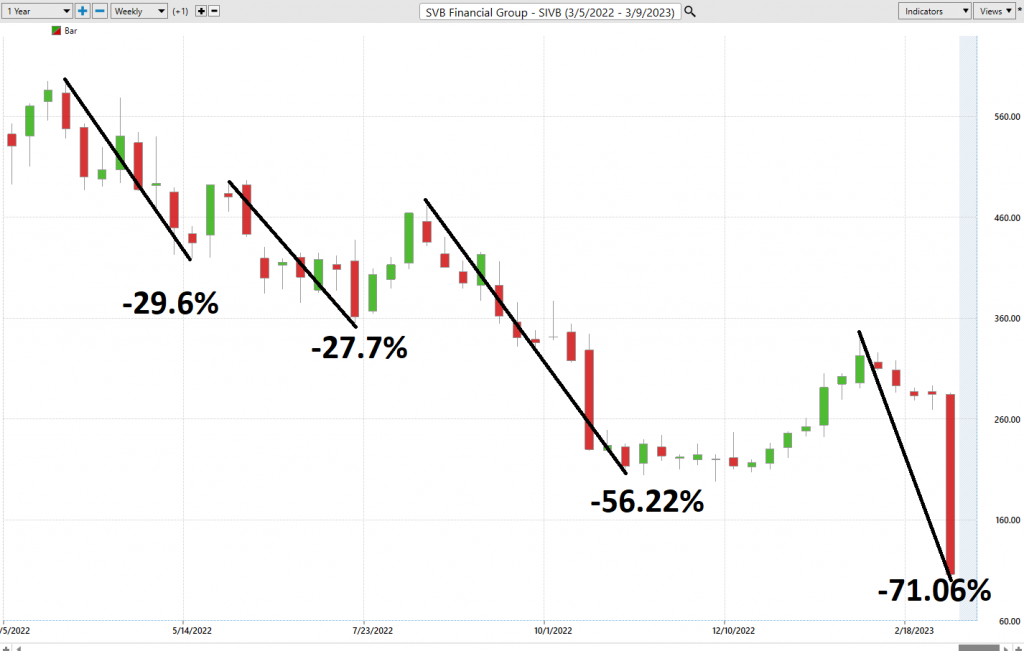
Next, we like to actually perform a best case and worst. This elementary perspective simply assumes and measures the strengths of the best rallies against the depth and magnitude of the worst declines. It quickly allows a trader to see and get a real-world perspective of volatility.
First, we will look at the strongest straightforward rallies in $SIVP and compare it to the declines.
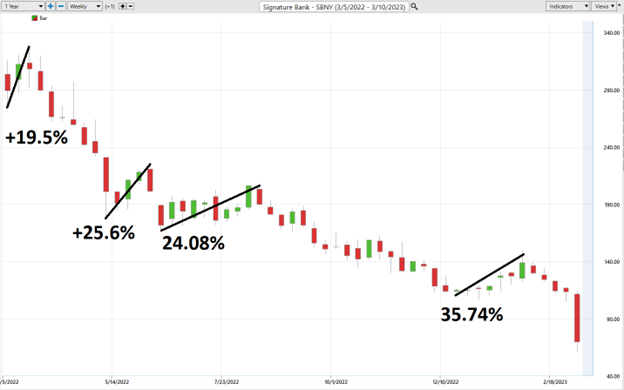
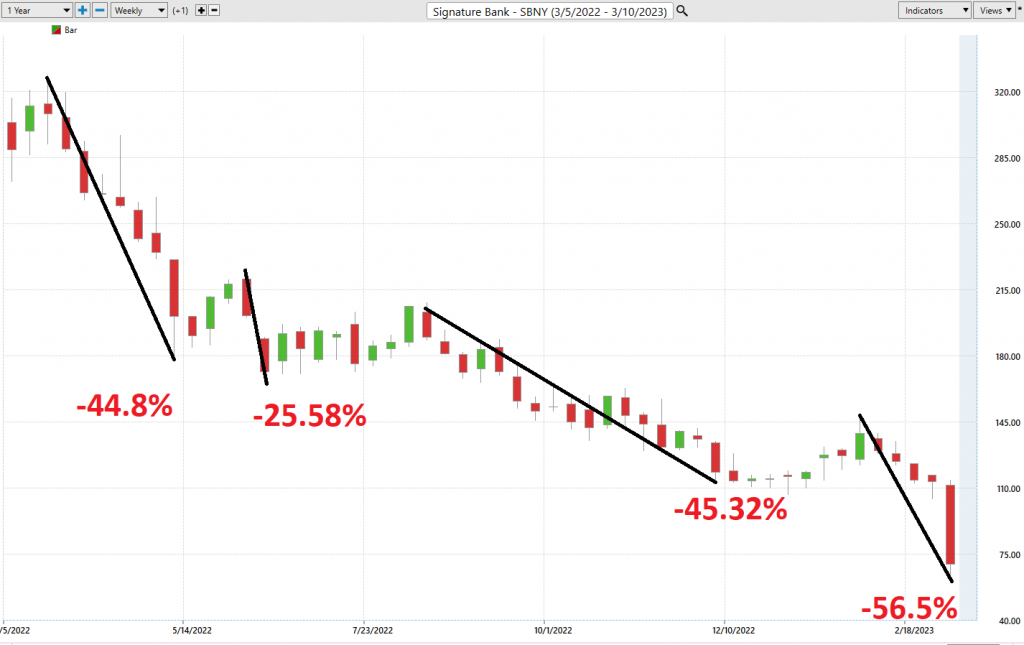
Now look at how similar the best case and worst-case analysis was on $SBNY.
But where the rubber meets the road is when we look at the performance metrics of $SBNY and $SIVB in comparison to the broader stock market indexes.
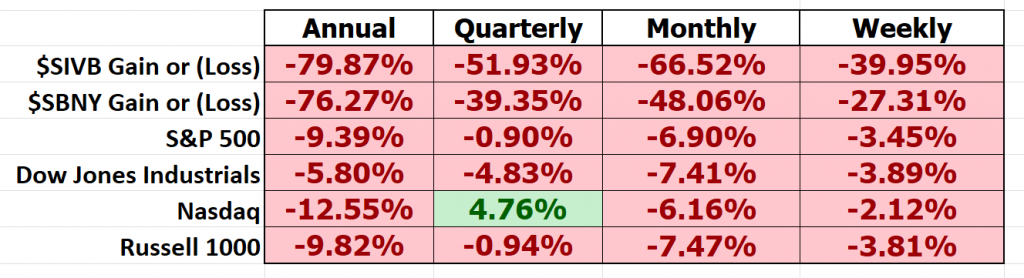
What you can clearly see in comparing performance is that $SIVB and $SBNY are significantly more volatile and have performed exponentially worse than the broader stock market indexes.
The Vantagepoint A.I. Analysis
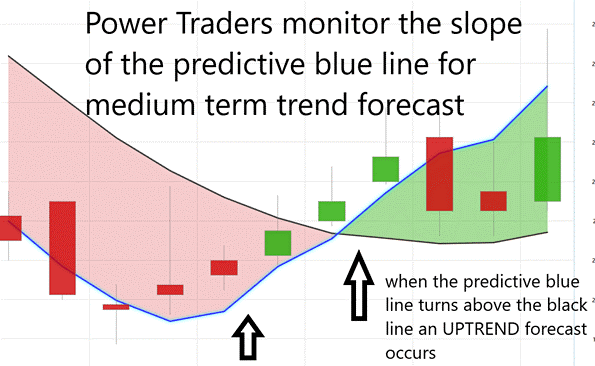
Using VantagePoint Software and artificial intelligence, traders are alerted to trend forecasts by monitoring the slope of the predictive blue line. The black line is a simple 10-day moving average of price which simply tells you what has occurred in the market. The predictive blue line also acts as a value zone where in uptrends traders try to purchase the asset at or below the blue line.
In studying the chart below, pay close attention to the relationship between the black line and predictive blue line. All that the black line tells you is what has occurred. It tells you where prices have been and what the average price over the last ten days is.
The predictive blue line, on the other hand utilizes that Vantagepoint patented Neural Network and Intermarket Analysis to arrive at its value. It looks at the strongest price drivers of an asset through artificial intelligence and statistical correlations to determine its value.
Power Traders rely on this simple chart analysis daily to keep them on the right side of the right trend at the right time.
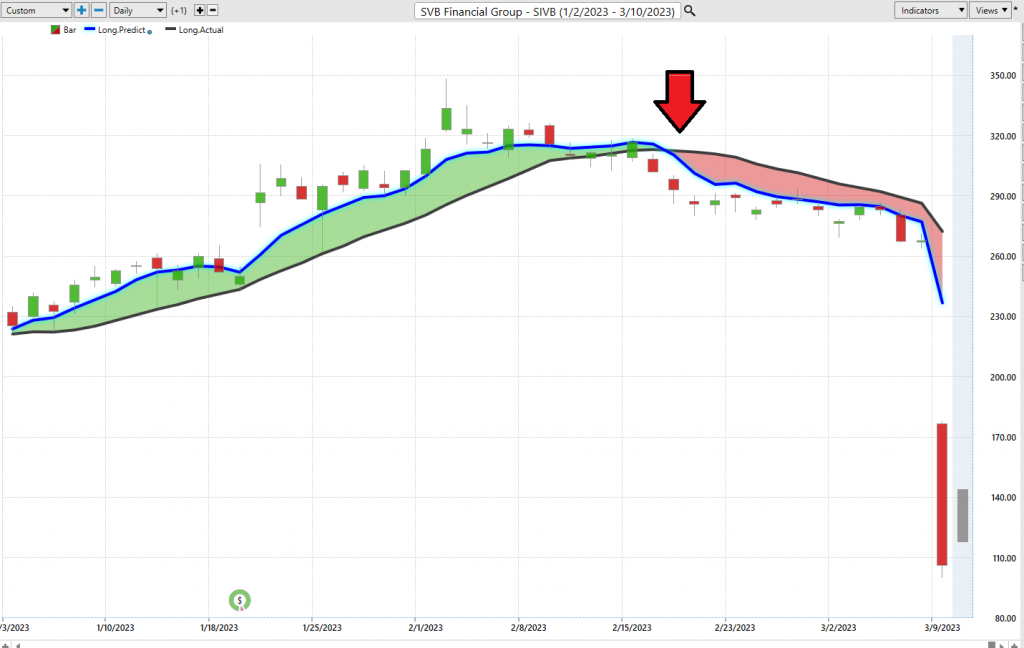
First, here is the Vantagepoint A.I. Market Forecast for $SIVB. Observe how the a.i. market forecast turned negative on $SIVB at a closing price of $292.79 on February 17, 2023. In 14 trading sessions the monetary authorities had shut $SIVB down.
Some Power Traders exploited the move lower. But all Power Traders knew what the a.i. forecast was well in advance.
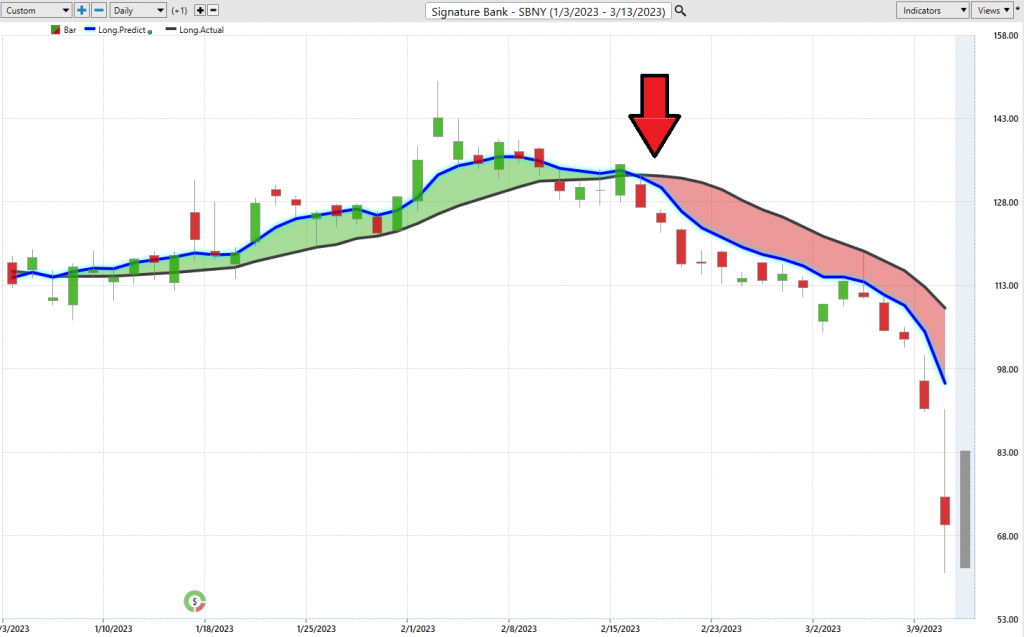
Likewise, for $SBNY you can see the a.i. market forecast turned negative on 2/17/23 at $124.31 per share. In three weeks’ time, it too was shut down by the regulators and monetary authorities.
As a trader, you know how crucial it is to stay ahead of market trends and make informed decisions that can lead to better trades and risk management. Embracing artificial intelligence trading software might just revolutionize your trading decision-making process, as it holds the key to unlocking numerous advantages in this fast-paced financial world. For instance, by analyzing vast amounts of data swiftly and adapting to market changes in real-time, AI-powered trading software can identify lucrative opportunities and exploit them before a human trader would even have the chance to react. Furthermore, AI algorithms can identify patterns that might escape even the sharpest of human eyes, leading to smarter trading strategies and allowing you to make decisions based on solid data analysis rather than relying on intuition alone. When it comes to risk management, AI trading systems can assess possible outcomes and their probabilities more quickly and accurately than their human counterparts, providing you with vital information on where and when to trade. In summary, adopting artificial intelligence trading software into your decision-making process is not only a wise choice but a potentially game-changing approach to making more profitable trades and managing risk more efficiently.
Every day we at Vantagepoint software receive testimonials from customers who were initially skeptical of the power of artificial intelligence in their trading.
As I write this article the banking panic has spread internationally.
Being forewarned is essential in todays fast paced digital world.
Our only loyalty is to the trend as dictated by artificial intelligence.
Do you remember the story of Rip Van Winkle?
It was a story written by Washington Irving in 1819. The story is a fable about a man who goes into the woods to escape his wife’s nagging. However, Rip falls asleep for many, many years and when he awakes, he discovers a world that is almost unrecognizable.
I use this fable as a metaphor because today’s fast paced interconnected world is a far cry from the financial marketplace yesteryear. In the words of futurist Alvin Toffler, “change will happen faster and faster.”
Today, economists defend ideas like negative interest rates which were impossibility before the Great Financial Crisis. Today we have a monetary printing press gone wild at levels never seen in our country’s history.
Imagine if you fell asleep 14 years ago how you might react to seeing how the financial landscape had changed compared to the world of today!
Things are going to get very interesting in the financial markets over the coming weeks as everyone looks for safe havens.
This is how VantagePoint artificial intelligence simplifies and empowers traders daily!
Visit With US and check out the a.i. at our Next Live Training.
It’s not magic. It’s machine learning.
Make it count.

IMPORTANT NOTICE!
THERE IS SUBSTANTIAL RISK OF LOSS ASSOCIATED WITH TRADING. ONLY RISK CAPITAL SHOULD BE USED TO TRADE. TRADING STOCKS, FUTURES, OPTIONS, FOREX, AND ETFs IS NOT SUITABLE FOR EVERYONE.
DISCLAIMER: STOCKS, FUTURES, OPTIONS, ETFs AND CURRENCY TRADING ALL HAVE LARGE POTENTIAL REWARDS, BUT THEY ALSO HAVE LARGE POTENTIAL RISK. YOU MUST BE AWARE OF THE RISKS AND BE WILLING TO ACCEPT THEM IN ORDER TO INVEST IN THESE MARKETS. DON’T TRADE WITH MONEY YOU CAN’T AFFORD TO LOSE. THIS ARTICLE AND WEBSITE IS NEITHER A SOLICITATION NOR AN OFFER TO BUY/SELL FUTURES, OPTIONS, STOCKS, OR CURRENCIES. NO REPRESENTATION IS BEING MADE THAT ANY ACCOUNT WILL OR IS LIKELY TO ACHIEVE PROFITS OR LOSSES SIMILAR TO THOSE DISCUSSED ON THIS ARTICLE OR WEBSITE. THE PAST PERFORMANCE OF ANY TRADING SYSTEM OR METHODOLOGY IS NOT NECESSARILY INDICATIVE OF FUTURE RESULTS. CFTC RULE 4.41 – HYPOTHETICAL OR SIMULATED PERFORMANCE RESULTS HAVE CERTAIN LIMITATIONS. UNLIKE AN ACTUAL PERFORMANCE RECORD, SIMULATED RESULTS DO NOT REPRESENT ACTUAL TRADING. ALSO, SINCE THE TRADES HAVE NOT BEEN EXECUTED, THE RESULTS MAY HAVE UNDER-OR-OVER COMPENSATED FOR THE IMPACT, IF ANY, OF CERTAIN MARKET FACTORS, SUCH AS LACK OF LIQUIDITY. SIMULATED TRADING PROGRAMS IN GENERAL ARE ALSO SUBJECT TO THE FACT THAT THEY ARE DESIGNED WITH THE BENEFIT OF HINDSIGHT. NO REPRESENTATION IS BEING MADE THAT ANY ACCOUNT WILL OR IS LIKELY TO ACHIEVE PROFIT OR LOSSES SIMILAR TO THOSE SHOWN.

