If ever you needed a demonstration of the triumph of hope over harsh reality, you got it Friday in the US equity markets. They staged their biggest reversal in four years, and brought the Bulls bellowing back into the markets.
Why? Well just read on.
The Longest Day ™ began with a shocking dose of reality. The Non-Farm Payrolls report was lousy, no good, really bad: far below expectations this month and big downward revisions for last month. The unemployment rate was unchanged, because the labor force participation rate fell to a 40-year low. And the biggest category of jobs added was for waiters and bartenders. They could have headlined the report: “Do you want fries with that?”
The factory orders – you know, the places where America makes stuff and sells it – were equally bad. Revised down from the previous month, below dismal expectations for the month, and down for four of the last five months.
So how is this good for the stock market?
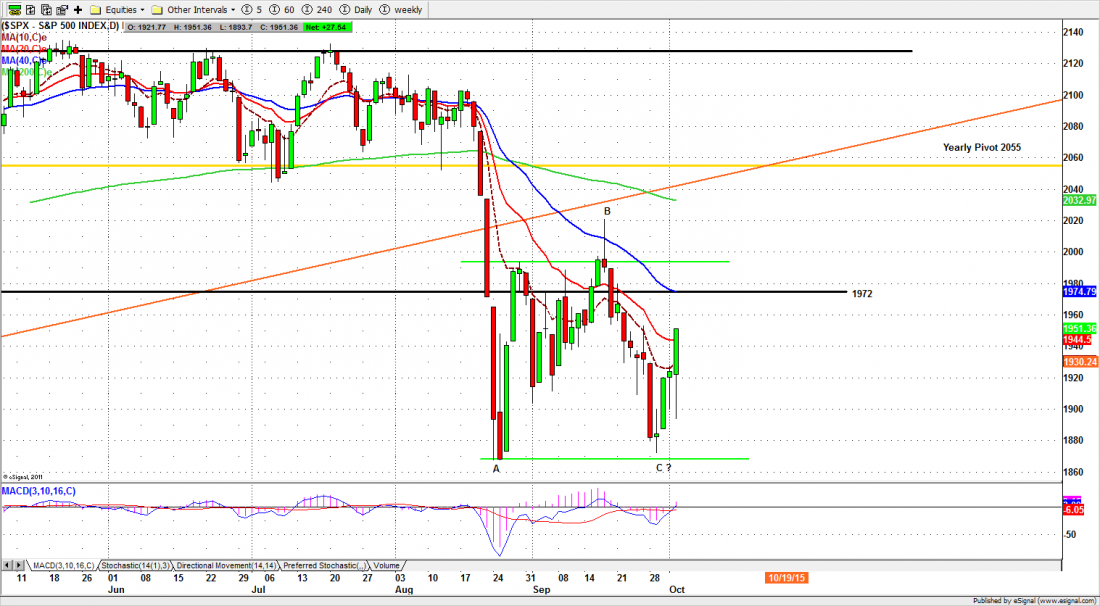
Obviously it isn’t. In the first hour of trading after the bad news was released, the market dropped like a stone. The S&P500 large cap index (SPX) dropped 26.50 in the first hour of trading, and broke decisively through the 1900 support level.
And then, somebody somewhere threw a switch and the market started reversing. By the end of the day the SPX was up 57 points from the intraday low. It closed at 1951.11, up 27 points from the previous close.
The talking points argue that bad news is good news, because the crummy employment data will forestall any impulse by the Federal Reserve to raise interest rates at its October meeting.
That’s the stuff that makes roses grow. The Fed, despite tough talk, talk, talk, has shown very little inclination to raise rates under any circumstances; the possible rate increase is trivial in any event; and the odds against a rate increase in October were about 7:3 before Friday’s trading. You don’t need to jack the market to avoid something that wasn’t going to happen anyway.
One of these days we’ll find out what happened. But this wasn’t a normal, organic movement in prices. Somebody created it. We just don’t know why.
Today.
If Friday was momentum ignition, we should expect some follow-through today. For the short term, the price action is bullish with high volume on rising prices. Sentiment now turns bullish and could help move the index up to test the 50-day moving average line. But sentiment can change quickly. A failure to move above the 1990 level could lead index to drop back near 1905 again.
For the futures (ESZ5) 1944.25-46.50 will be the first key zone to watch Monday. If it says below this zone, the ES could retrace back to retest Friday afternoon’s breakout levels at 1919 and 1910.50 or lower around the 1900 line. But as long as ES holds above 1900 the outlook is bullish.
Traders should focus on the long side if ES has a retracement in the early sessions, especially if the price pulls back into the 1905-03 zone.
Major support levels for Monday: 1905-03, 1875-50.50, 1850-45, 1831-25;
major resistance levels: 1975-85, 1993-95.50, 2015-18.50, 2029-28.50
For more detailed market analysis from Naturus.com, free of charge, follow this link
http://www.naturus.com/mailing-list-signup-page/
Chart: S&P500 cash index daily to Oct. 2, 2015