Over the last two months, I have been updating the sentiment of traders and what it means for the stock market direction. Many have asked how we come up with these sentiment numbers and what they mean. The sentiment numbers come from Woody Dorsey’s proprietary sentiment data. In his best-selling book, Behavioral Trading, he explains in full detail how to track sentiment.
Dorsey is considered the master of sentiment and has been polling investors to see how they “FEEL” about the stock market for over 25 years. By tracking the way investor’s “FEEL” each day, we come up with a sentiment reading that ranges from 0% bullish to 100% bullish. When investors are 100% bullish on the stock market, it is considered an extreme and it becomes dangerous for the long side. When we get a 0% bullish reading, it is a bearish extreme and the short side becomes dangerous. History has showed us over and over, when the majority is expecting the same outcome, the opposite usually happens.
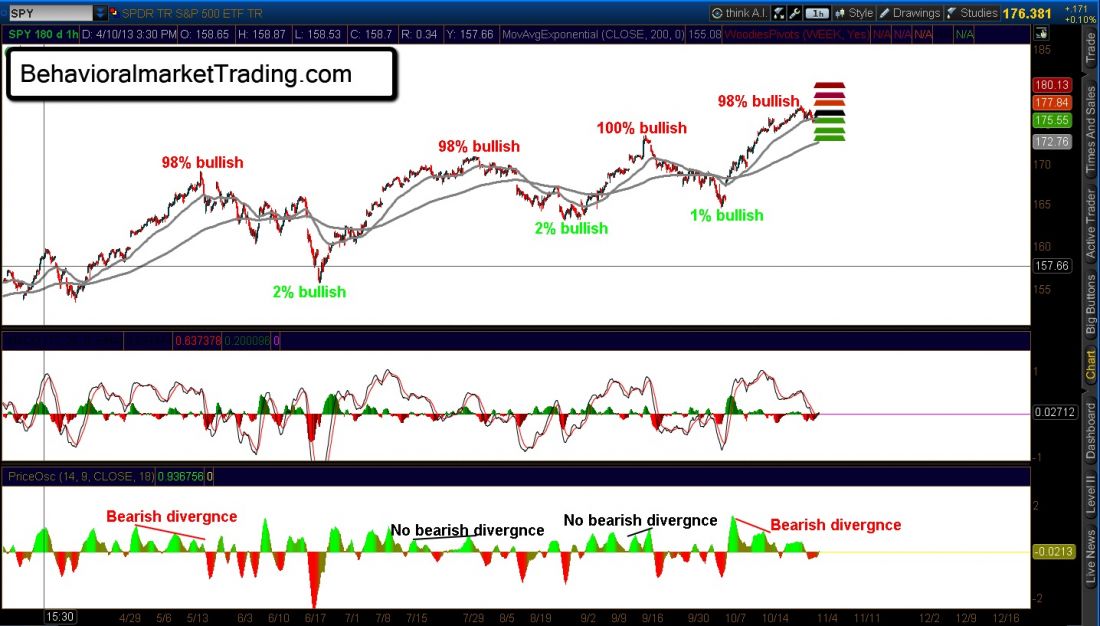
Sentiment alone will NOT trigger a trade. You have to look at the technicals, price action and sentiment together to determine the market direction. Last week we had some bearish divergences on the 60 minute charts. Sentiment did reach an extreme last week, with a 98% bullish reading (that’s bearish for the markets) and we did get a reaction move lower after the Fed announcement.
But the daily charts are not showing the same bearish view as the hourly charts. So whatever pullback we get, will most likely be just a pullback before another new high is reached. 1740 would make sense for a pull back, but it could go deeper. That is if the SPX decides to take a breather here.