
![]()
International Seaway ($INSW) is an international logistics company specializing in freight forwarding, warehousing and finance. Founded in 2001 by its current CEO and Chairman Mr. John Matthews, $INSW has quickly become one of the leading companies in its field. The company provides customers with transportation services using sea freight, airfreight and land transport options, allowing them to source their international products more efficiently. With almost 400 employees around the world, they provide global market expertise and access to top-tier partnerships which allows them to generate consistent revenues from their clientele. $INSW operates in direct competition with other international shipping companies such as Expeditors International, DSV Panalpina and Kuehne + Nagel; however due to their competitive pricing model as well as swift response times on customer interactions have allowed them to stay ahead of their rivals.
International Seaways owns and operates a fleet of 36 vessels, including 11 very large crude carriers (VLCCs), two Suezmax tankers, eight Aframax tankers, and 15 medium range tankers. The company primarily operates in the Atlantic, Pacific, and Indian Oceans, as well as the Mediterranean, the Black Sea, and the Caribbean. One of the biggest opportunities for International Seaways is the increasing demand for energy transportation services, particularly in emerging markets such as China and India. Additionally, the company is well-positioned to benefit from the growth in U.S. oil exports, which have increased significantly in recent years.
The energy transportation sector is a rapidly growing field that provides service to customers in need of secure, efficient and environmentally sustainable energy solutions. Companies in the sector give safe and reliable transport services for energy, whether traditional sources such as oil, gas and coal, or renewable sources like solar and nuclear. Their goal is to provide effective distribution networks for their customers, making it easy to get power from suppliers to where the products are needed most. Some of the top 10 companies leading this massive industry include Kinder Morgan Inc., Enterprise Products Partners L.P., Plains All American Pipeline L.P., Phillips 66 Logistics LLC, Magellan Midstream Partners L.P., Enbridge Energy Partners L.P., Buckeye Partners L.P., Oneok Partners L.P., Energy Transfer Equity L.P., and World Fuel Services Corporation – all of whom have been working constantly to develop new strategies on how best to move energy around the world quickly and efficiently while keeping costs low for those who depend on it to thrive in the modern age.
The company ($INSW) has a market cap of $2.52 billion and trades on average almost 2 million shares per day.
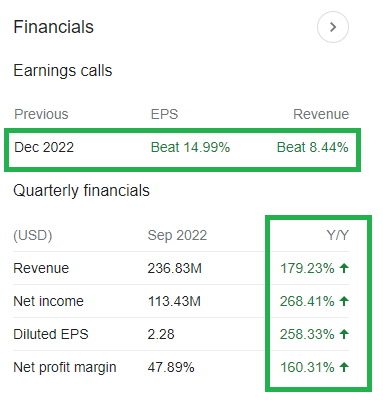
Impressively, $INSW has been promoting incredible financial performance over the last few quarters.
.
They reported most recent financial performance on 2/28/23 with their highest earnings in their history. You can read their press release here.
We will evaluate the following metrics and indicators to determine what the best course of action is regarding $INSW trading.
- Wall Street Analysts Estimates
- 52-week high and low boundaries
- Vantagepoint A.I. Forecast
- Neural Network Forecast
- Daily Range Forecast
- Intermarket Analysis
- Our Suggestion
Wall Street Analysts Price Estimates
The 9 analysts offering 12-month price forecasts for International Seaways Inc have a median target of 60.00, with a high estimate of 65.00 and a low estimate of 50.00. The median estimate represents a +16.62% increase from the last price of 51.45.
Wall Street is quickly revising their estimates upwards on $INSW. The stock is slightly undervalued at present.
52-week High-Low Chart
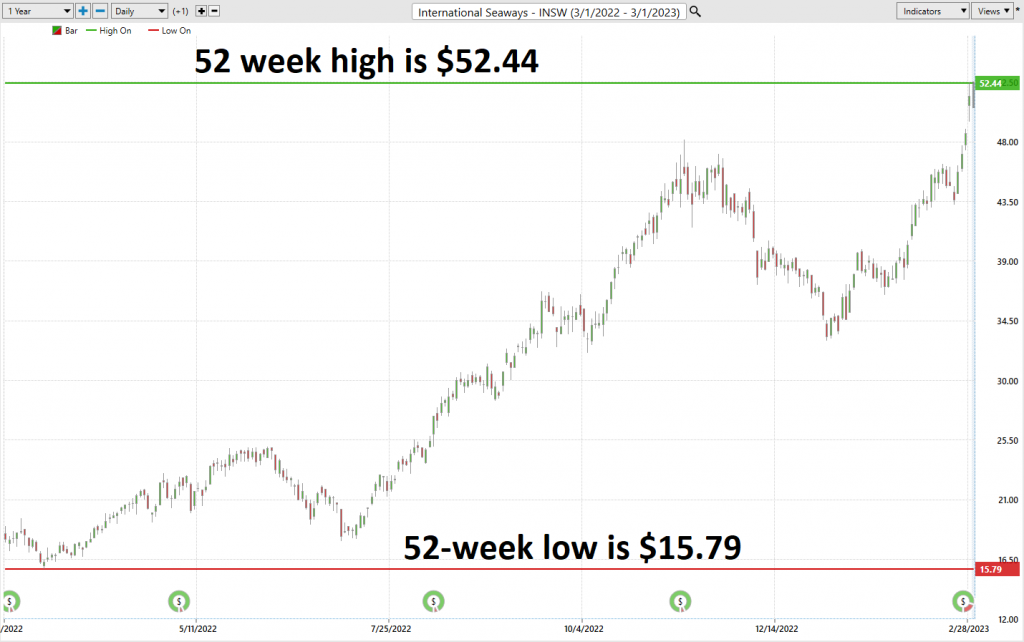
First, we want to see where we are trading in relation to the 52-week range.
Over the last 52 weeks, the stock has traded as high as $52.44 and as low as $15.78. The stock is trading at its 97th percentile of its annual range which clearly communicates massive strength.
We always pay attention to where we are in relation to the 52-week trading range. It’s very common to see the 52-week high provide very strong resistance to the market until it is breached. Often when the 52-week high is breached we will see the stock price explode higher very quickly over a very short period.
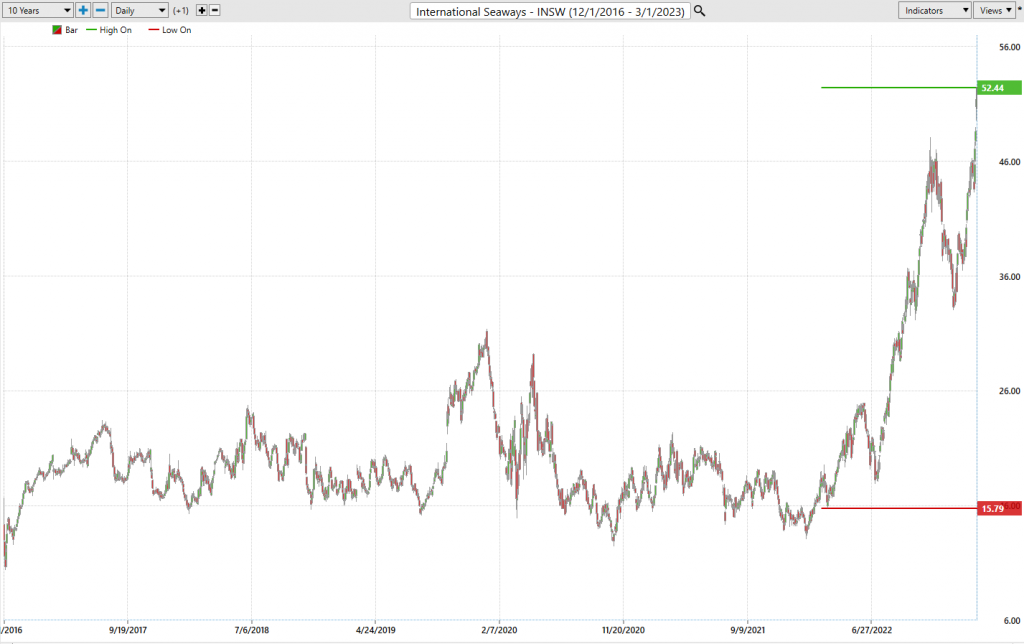
Secondly, observe how $INSW as it makes new 52-week highs is also making new 10-year highs.
What we also do with all stocks that we analyze is we calculate the statistical volatility. This is done by dividing the annual trading range of $36.66 by the current closing price $51.44. This value of 71.3% is the statistical volatility which informs us that it would be perfectly normal for $INSW to trade 71.3% higher or lower over the next year from its current price level.
In studying the 52 week chart as well as the 10 year chart we can easily see the massive uptrend that exists in $INSW. Our observation is that whenever a stock continues to make new 52-week highs and new 10-year highs it is communicating to the world that it is resilient. These trends are persistent while the assets continue to exhibit high levels of volatility.
Best Case – Worst-Case Scenarios
Risk analysis is an invaluable tool when making important decisions. Best-case and worst-case analysis helps us to prepare for and mitigate against any possible undesirable outcomes. By taking the time to consider all of the possible reactions to a given scenario, we can create a more complete plan by having all angles accounted for. Of course, this doesn’t guarantee a specific outcome, but it can help provide more knowledge of what kind of impact our decisions can have so that we can proceed with more confidence. It is also worth noting that best-case scenarios imply potentially valuable opportunities as well as risks so it just makes sense to engage in both during our analysis. Ultimately, risk assessment does not have to be complicated or time consuming – by looking at potential scenarios from different perspectives, decision makers gain a better understanding of the consequences of their choices and stand the best chance at success.
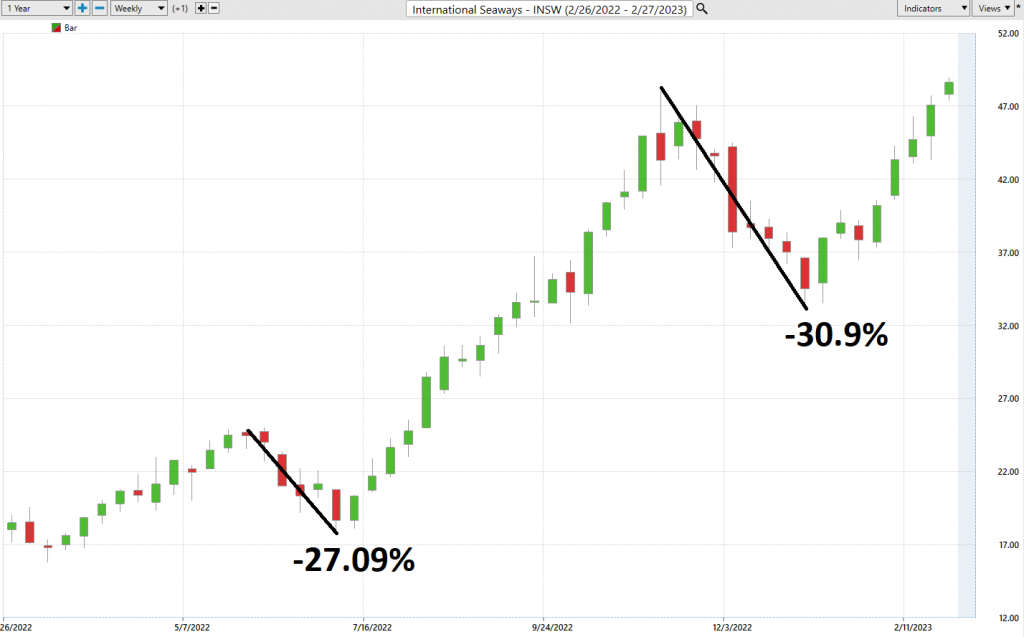
In creating this analysis we simply look at the largest possible rallies and declines from peak to trough so that we can understand the real world volatility implications involved in trading the asset. Here is the worst-case analysis:
It’s worth doing this type of baseline analysis because it allows you to quickly compare the performance of $INSW and to understand its risk and reward possibilities.
Here is the best case analysis which simply looks at the strength of the uninterrupted rallies.
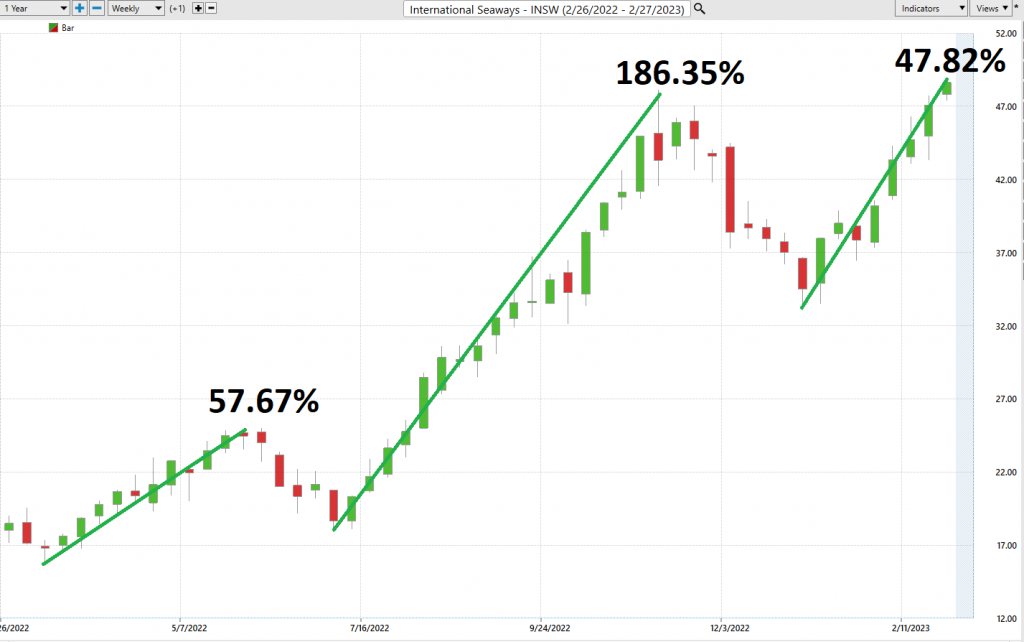
Clearly, the bulls had the advantage in this preliminary analysis. Equally as important is how both the downtrends and uptrends are very clear and distinct.
Next, we compare $INSW to the major broad market indexes. Over the past year.
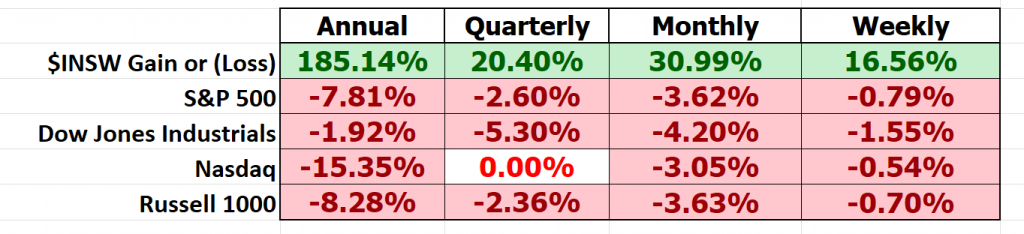
It is with this simple analysis where we see how resilient $INSW has been. It has moved completely in contrast and independently of the broader stock market indexes and has posted gains for the annual, quarterly, monthly and weekly time frames. It is this asymmetry that makes $INSW very attractive to traders and investors.
Asymmetric returns refer to investments that can yield significantly higher returns for a comparatively small amount of uncorrelated risk. This does not imply that $INSW is riskless, but that in comparison to any of the broader stock market indexes it has performed positively regardless of what the broader market has done.
The Vantagepoint A.I. Analysis
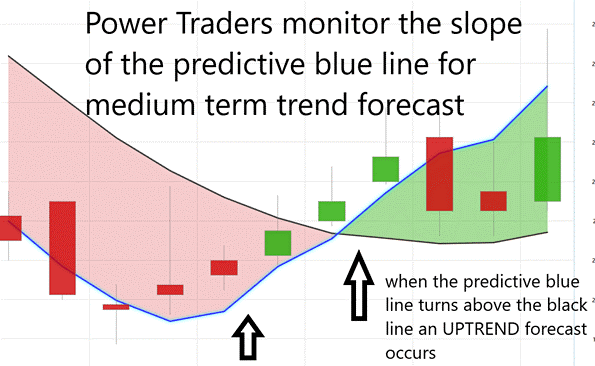
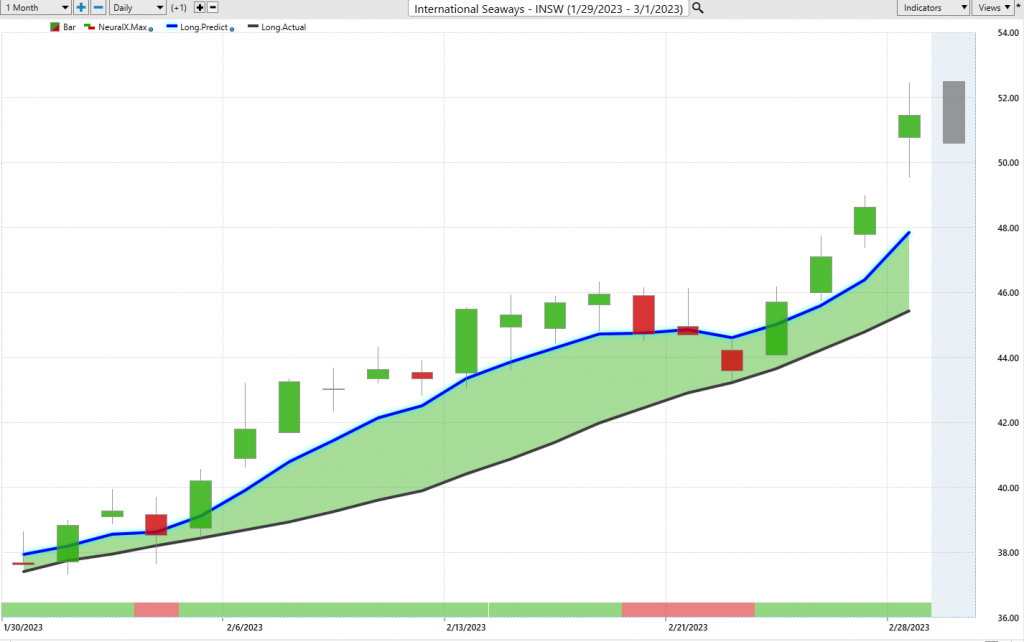
Using VantagePoint Software and the artificial intelligence, traders are alerted to trend forecasts by monitoring the slope of the predictive blue line. The black line is a simple 10 day moving average of price which simply tells you what has occurred in the market. The predictive blue line also acts as a value zone where in uptrends traders try to purchase the asset at or below the blue line.
In studying the chart below pay close attention to the slope of the blue line.
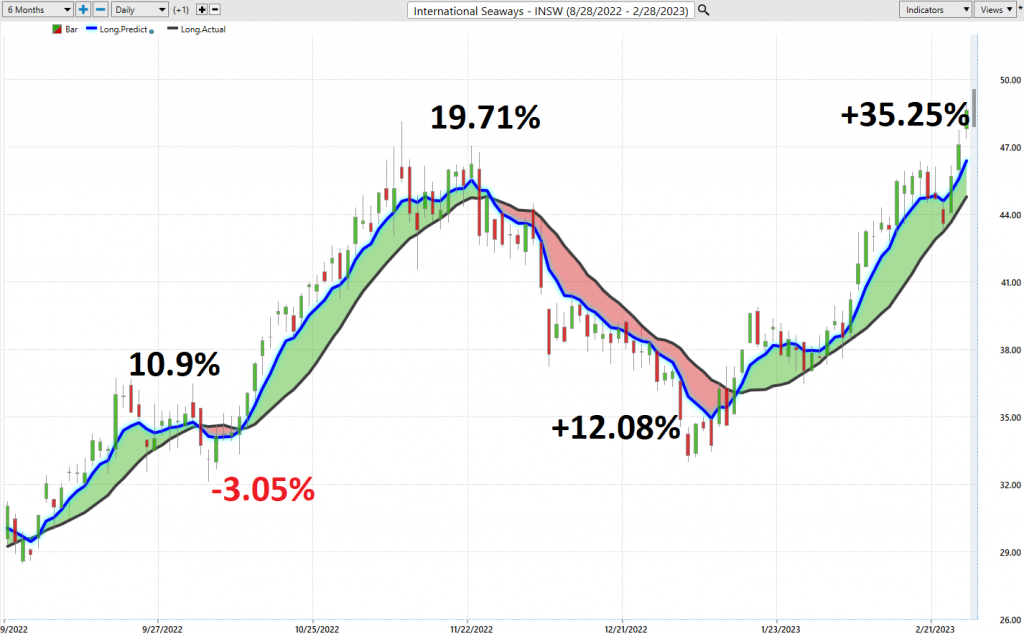
Over the last 6 months there were 5 a.i. trend forecasts in $INSW. Four of these forecasts were profitable. One was unprofitable.
The average profitable gain was 19.49% versus the unprofitable trade of –3.05%. That is an impressive win/loss ratio.
Power Traders pay close attention to the relationship between where price closes in relation to the slope of the predictive blue line.
Power traders use the predictive blue line to help to determine both the value zone as well as the trend direction. In other words, in an uptrend traders try to buy the asset at or below the predictive blue line.
Fine Tuning Entries with The Neural Net Indicator
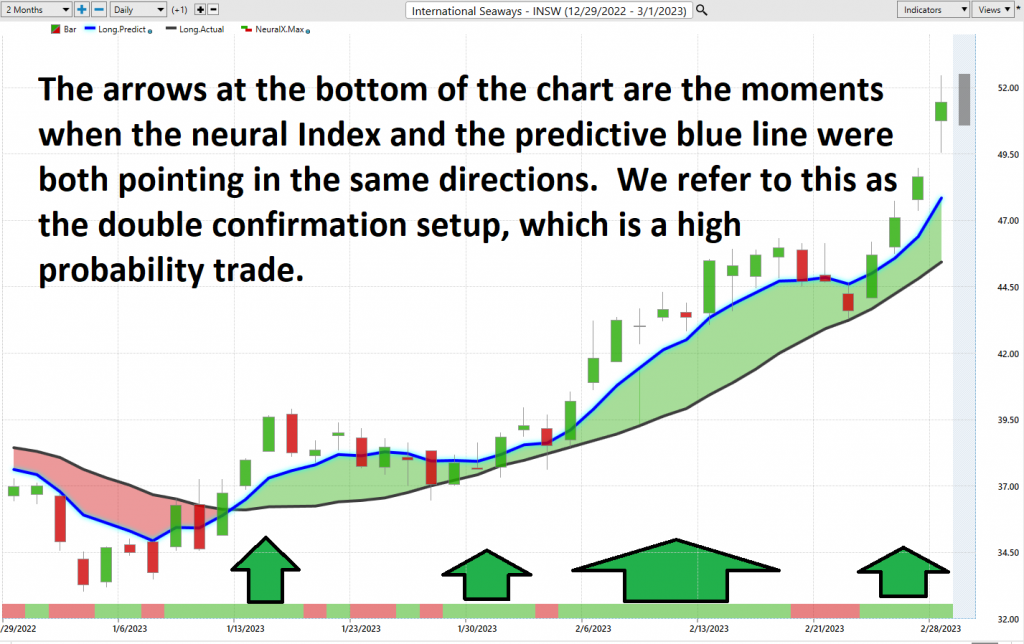
At the bottom of the chart is the Neural Network Indicator which predicts future strength and/or weakness in the market. When the Neural Net Indicator is green it communicates strength. When the Neural Net is Red it is forecasting short term weakness in the market.
A Neural Net is a computational learning system that uses a network of functions to understand and translate massive amounts of data into a desired output, consistently monitoring itself and improving its performance.
Whenever Power Traders are looking for statistically valid trading setups, they look for a DOUBLE confirmation signal. This signal occurs whenever the blue predictive line and the Neural Net at the bottom of the chart suggest the same future expected outcome.
Neural networks are big data tools used in trading to perform complex quantitative analysis. Neural networks process big amounts of data to find patterns and help traders make better decisions. Neural networks and pattern recognition is the business of algorithmic trading as it assists traders in monitoring millions of variables such as stock prices, currencies, financial statements and other crucial trading information. Neural networks can adapt quickly to changing market conditions or reveal unexpected patterns or trends which reduces the risk involved in making investing decisions.
We advocate that Power Traders cross reference the chart with the predictive blue line and neural network indicator to create optimal entry and exit points.
Power Traders are always looking to apply both the neural network and a.i. to the markets to find statistically sound trading opportunities.
We advise Power Traders to cross reference the predictive blue line with the Neural Net for the best entry opportunities.
Whenever Power Traders are looking for statistically valid trading setups, they look for a DOUBLE confirmation signal. This signal occurs whenever the blue predictive line and the Neural Net at the bottom of the chart suggest the same future expected outcome.
VantagePoint Software Daily Price Range Prediction
The purpose of all these indicators so far is to help traders stay on the right side of the right trend at the right time.
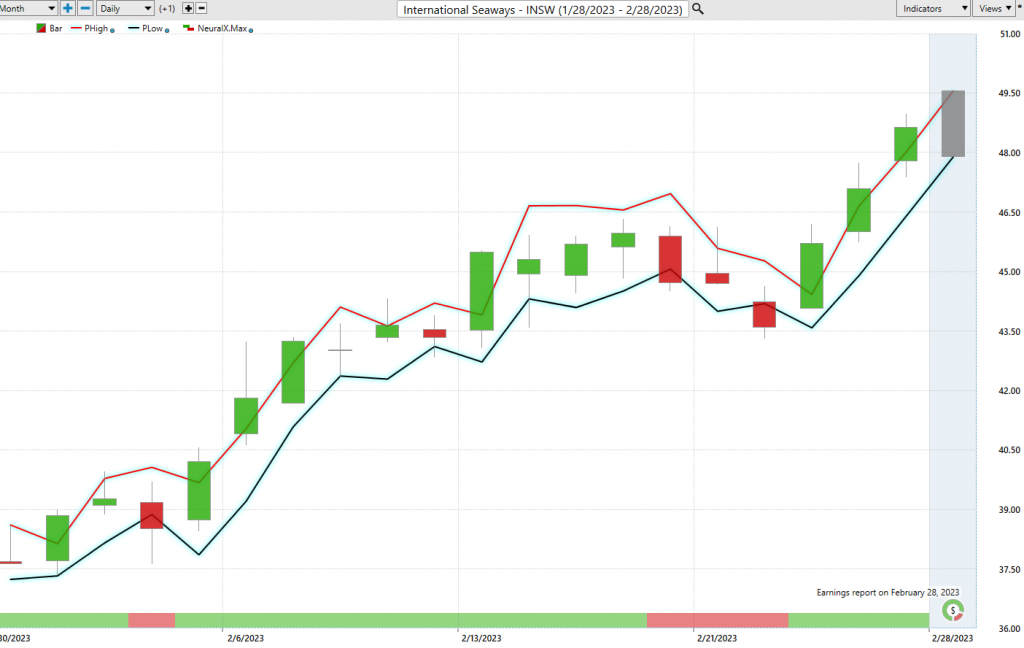
One of the powerful features in the Vantagepoint A.I. Software which Power Traders use daily is the Daily Price Range prediction forecast.
This forecast is what permits Power Traders to truly fine-tune their entries and exits into the market.
What is the most important feature that traders are concerned about? Traders need to know where to enter and exit a market. VantagePoint provides this answer with exacting precision. Every day the Daily Range forecast is updated to provide insight to anticipated price action.
Over the past year International Seaways ($INSW) has exhibited the following percentages in terms of daily, weekly, and monthly time frames.
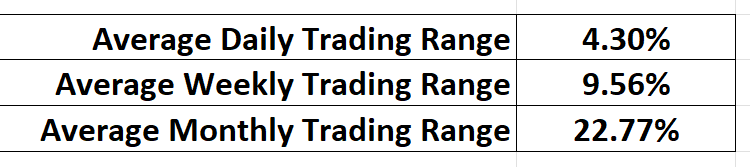
The volatility here is impressive. The challenge that all traders face is how to decide where they should get in and out of the market. The VantagePoint Daily Range Forecast provides the answer to this question with exacting precision.
AI combines historical data, predictive algorithms, and predictive analytics to calculate the most likely probability of a given price range while factoring in real-time market demand and supply dynamics. The predictive ranges created by AI offer traders an actionable advantage in forecasting trading ranges for the following day. The values of predictive high prices and predictive low prices are determined from the collective inputs of numerous models that use both hard and soft skills. These predictive techniques allow quantitative traders to make informed decisions about exactly when to enter and exit trades. The trend is ALWAYS very clearly delineated so no guesswork is ever involved.
Intermarket Analysis
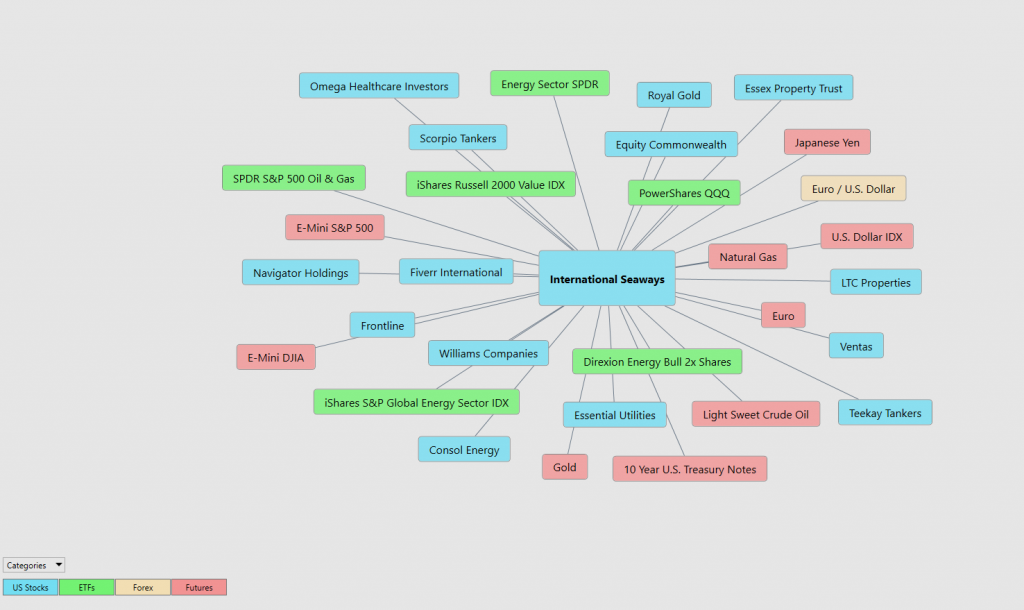
What makes the Vantagepoint Software truly unique is its ability to perform Intermarket analysis and to locate those assets which are most interconnected that are responsible for driving the price of $INSW higher or lower.
Studying the charts can always provide objective realities in terms of locating support and resistance levels which become very clear on a chart. But we live in a global marketplace. Everything is interconnected. The billion-dollar question for traders is always what are the key drivers of price for the underlying asset that I am trading?
These intangibles are invisible to the naked eye yet show extremely high statistical correlations.
Intermarket analysis is an approach to trading and investing that looks at price correlations between related assets in different asset classes. It evaluates the key drivers of price movements in a vast interconnected network of markets, making it especially valuable for quant traders. Many of the top hedge funds and investors use intermarket analysis techniques to gain a professional edge and make more informed decisions on their portfolios.
Slight changes in Interest rates, Crude Oil Prices, and the Volatility of the dollar amongst thousands of other variables affect the decisions companies must make to survive in these incredibly challenging times. Trying to determine what these factors are is one of the huge problems facing investors and traders.
Intermarket analysis is extremely important for traders to understand and utilize in the decision-making process. By understanding price correlations between different markets, they can gain a greater insight into what the key drivers of price are, allowing them to identify price patterns and correlations more quickly and accurately. This gives traders a significant advantage when managing their capital as it allows them to more effectively assess risk, time their trades better and have a more global perspective of price movements. Ultimately, intermarket analysis helps traders make better decisions that can identify opportunities and minimize risks.
There is immense value to be had in studying and understanding the key drivers of $INSW price action.
Our Suggestion
$INSW is making new 52-week highs as well as new 10 year highs. You could use pullbacks to time your trades. Volatility is high so always practice good money management.
We think that based upon the current trend buying weakness and selling strength should give ample opportunity to create 6% to 8% returns within 6-8 trading sessions.
Let the a.i. forecast guide your decisions and brace yourself for some wicked volatility.
$INSW should continue to perform exceptionally well in a stagflationary economic environment.
Let’s Be Careful Out There!
Remember, It’s Not Magic.
It’s Machine Learning.

IMPORTANT NOTICE!
THERE IS SUBSTANTIAL RISK OF LOSS ASSOCIATED WITH TRADING. ONLY RISK CAPITAL SHOULD BE USED TO TRADE. TRADING STOCKS, FUTURES, OPTIONS, FOREX, AND ETFs IS NOT SUITABLE FOR EVERYONE.
DISCLAIMER: STOCKS, FUTURES, OPTIONS, ETFs AND CURRENCY TRADING ALL HAVE LARGE POTENTIAL REWARDS, BUT THEY ALSO HAVE LARGE POTENTIAL RISK. YOU MUST BE AWARE OF THE RISKS AND BE WILLING TO ACCEPT THEM IN ORDER TO INVEST IN THESE MARKETS. DON’T TRADE WITH MONEY YOU CAN’T AFFORD TO LOSE. THIS ARTICLE AND WEBSITE IS NEITHER A SOLICITATION NOR AN OFFER TO BUY/SELL FUTURES, OPTIONS, STOCKS, OR CURRENCIES. NO REPRESENTATION IS BEING MADE THAT ANY ACCOUNT WILL OR IS LIKELY TO ACHIEVE PROFITS OR LOSSES SIMILAR TO THOSE DISCUSSED ON THIS ARTICLE OR WEBSITE. THE PAST PERFORMANCE OF ANY TRADING SYSTEM OR METHODOLOGY IS NOT NECESSARILY INDICATIVE OF FUTURE RESULTS. CFTC RULE 4.41 – HYPOTHETICAL OR SIMULATED PERFORMANCE RESULTS HAVE CERTAIN LIMITATIONS. UNLIKE AN ACTUAL PERFORMANCE RECORD, SIMULATED RESULTS DO NOT REPRESENT ACTUAL TRADING. ALSO, SINCE THE TRADES HAVE NOT BEEN EXECUTED, THE RESULTS MAY HAVE UNDER-OR-OVER COMPENSATED FOR THE IMPACT, IF ANY, OF CERTAIN MARKET FACTORS, SUCH AS LACK OF LIQUIDITY. SIMULATED TRADING PROGRAMS IN GENERAL ARE ALSO SUBJECT TO THE FACT THAT THEY ARE DESIGNED WITH THE BENEFIT OF HINDSIGHT. NO REPRESENTATION IS BEING MADE THAT ANY ACCOUNT WILL OR IS LIKELY TO ACHIEVE PROFIT OR LOSSES SIMILAR TO THOSE SHOWN.

