
Cinemark Holdings, Inc. is one of the largest movie theater chains in the United States. As of 2021, the company has 4,457 locations in 41 states and 63 countries. It is headquartered in Plano, Texas.
Cinemark was founded in 1984 by Lee Roy Mitchell. The company went public in 2007 and today has a market capitalization of over $2 billion. Pre-pandemic it had a market cap of $6 billion. In 2020, Cinemark generated revenue of $3.3 billion and employed 34,000 people worldwide. I could not locate what the company’s current employee count is post-pandemic, but it’s probably 50% less. What is notable to mention is that $CNK managed to navigate the economic lockdown and covid pandemic without having to restructure liabilities or file for bankruptcy.
Cinemark is known for its focus on customer service and innovation. The company was one of the first to offer reserved seating and stadium-style auditoriums, and it now offers premium experiences such as XD screens and D-Box motion seats.
There are several favorable fundamental trends for Cinemark. Firstly, the global box office is expected to grow at a compound annual growth rate (CAGR) of 3.5%. Secondly, e-ticketing, and reserved seating are driving higher average ticket prices and attendance rates. Finally, the company’s Movie Rewards loyalty program has over 20 million active members, providing a valuable database for marketing and sales purposes. However, there are some risks to consider when investing in Cinemark. These include intensifying competition from streaming services such as Netflix ($NFLX) and Amazon Prime Video ($AMZN), as well as potential disruptions to the theatrical business model from COVID-19.
Analysts have mixed opinions on whether Cinemark is a good stock to buy. Some argue that the company’s earnings growth potential is limited, particularly given the current pandemic, which has resulted in a significant decline in theaters revenues. However, others believe that Cinemark’s recent earnings prospects are strong, and that the company is well-positioned to rebound as the pandemic subsides.
Looking at the fundamental trends, it appears that Cinemark is facing some challenges. Revenues have been declining for the past several years, and the pandemic has exacerbated this trend. The company also has a large debt load, which could limit its ability to invest in future growth opportunities. However, Cinemark does have some strengths, including a strong brand, a diversified business model, and a loyal customer base.
According to earnings reports and analyst opinions, Cinemark’s main competitors are Regal Entertainment Group, AMC Theatres, and IMAX Corporation. All three companies have seen declining earnings in recent years, due in part to the rise of streaming services such as Netflix. However, there are also some fundamental trends that suggest that the movie theatre industry is in decline. For example, ticket sales have been steadily declining since 2002, and the average price of a movie ticket has also been slowly rising. This has led to fewer people going to the movies, and those who do go tend to be more selective about the films they see. As a result, all three companies face significant risks in the coming years.
According to a report from the National Association of Theatre Owners, the average cost of a movie ticket in the United States was $9.01 in 2019. This cost does not include the price of concessions such as popcorn and soda, which can add an additional $5-$7 to the cost of going to the movies. As prices for movie tickets have steadily risen over the past decade, many people are finding it increasingly difficult to justify the expense of going to see a film at the theater. In fact, some analysts believe that this cost barrier is one of the reasons why box office sales have been declining in recent years. While it is impossible to predict exactly how much movie tickets will be moving forward, in 2022 the average cost of a movie ticket was $12.09. It’s safe to say that they will continue to be a significant expense for most Americans. Many moviegoers have seen inflation affect all other forms of entertainment. Any increases in ticket prices have most analysts bearish on this sector of the entertainment industry. Competitors like Amazon Streaming and Netflix are positioned well should this occur.
As of 2022, Cinemark had $2.4 billion in long-term debt on its balance sheet. This amount of debt is not uncommon for a company in the entertainment industry. However, it is important to evaluate the liquidity and earnings of a company to assess the riskiness of its debt. Cinemark has a robust liquidity position, with $1.1 billion in cash and cash equivalents and no near-term maturities. In addition, the company’s earnings have been stable over the past few years. As a result, Cinemark’s debt is not particularly risky. However, it is worth monitoring the company’s debt to earnings ratio, as a sustained increase could indicate financial distress.
In this weekly stock study, we will look at and analyze the following indicators and metrics as are our guidelines which dictate our behavior in deciding whether to buy, sell, or stand aside on a particular stock.
- Wall Street Analysts’ Estimates
- 52-week high and low boundaries
- Best Case – Worst Case Analysis
- Vantagepoint A.I. Forecast (Predictive Blue Line)
- Neural Network Forecast
- Daily Range Forecast
- Intermarket Analysis
- Our Suggestion
We don’t base our decisions on things like earnings or fundamental cash flow valuations. However, we do look at them to better understand the financial landscape that a company is operating under.
Analysts Ratings
The first set of boundaries which we explore in our stock study is what do the professionals think who monitor the stock for a living. We can acquire this information by simply looking at the boundaries that the top Wall Street Analysts set for $CNK. This initial set of boundaries provides us with an idea of what is expensive, fairly valued, and cheap.
Based onWall Street analysts offering 12-month price targets for Cinemark in the last 3 months. The average price target is $22.00. The average price target represents a 16.83% change from the last price of $18.83.
From this simple analysis we can see that $CNK is undervalued at present time but some on Wall Street think that is has the potential to run to as high as at least 16% higher.
52-week High-Low Chart
Where the rubber meets the road as far as analysis is concerned is looking at the charts and evaluating where the asset stands in relation to its 52-week highs. As counterintuitive as it may sound, great stocks tend to consistently make new 52-week highs.
$CNK has traded as high as $23.15 and as low as $13.37 over the last 52 weeks. Its annual trading range has been $9.78 which means that its average weekly trading range has been .19.
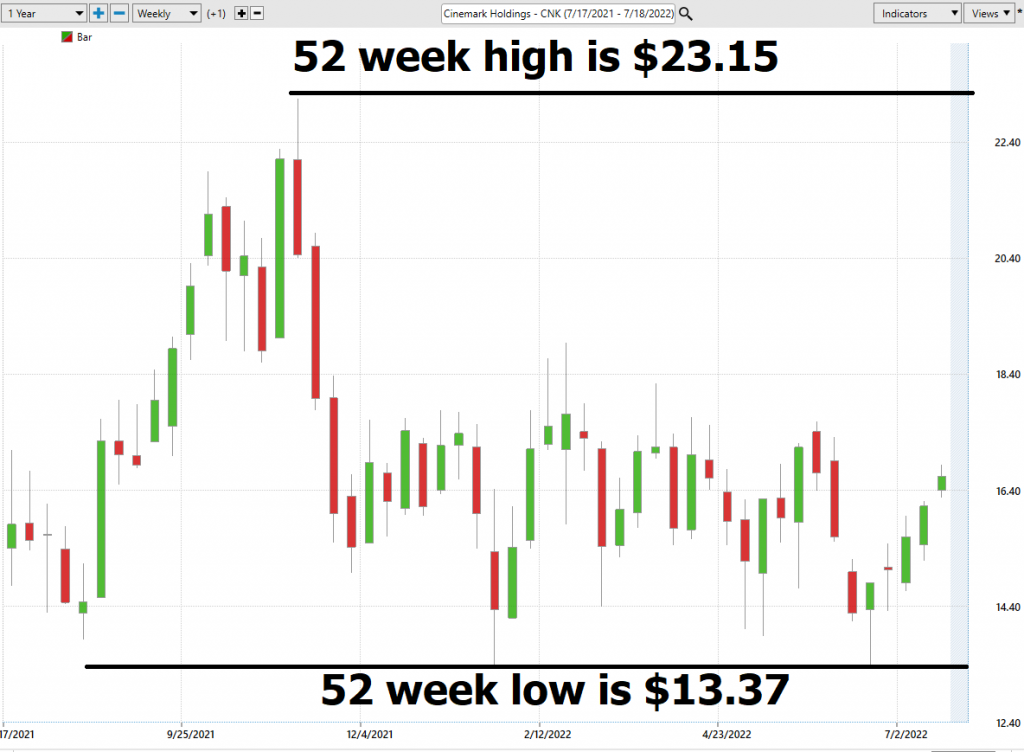
We also like to take the annual trading range of $9.78 and divide it by the current price of $18.83 to calculate a broad-based measure of volatility. This tells us that the current volatility is 51.9% which tells us that everything would be considered statistically normal in one year if $CNK was trading 51.9%% higher or lower from current levels according to this measure.
Be forewarned that the volatility on $CNK is high. It’s currently trading at its 56th percentile for the last years trading range.
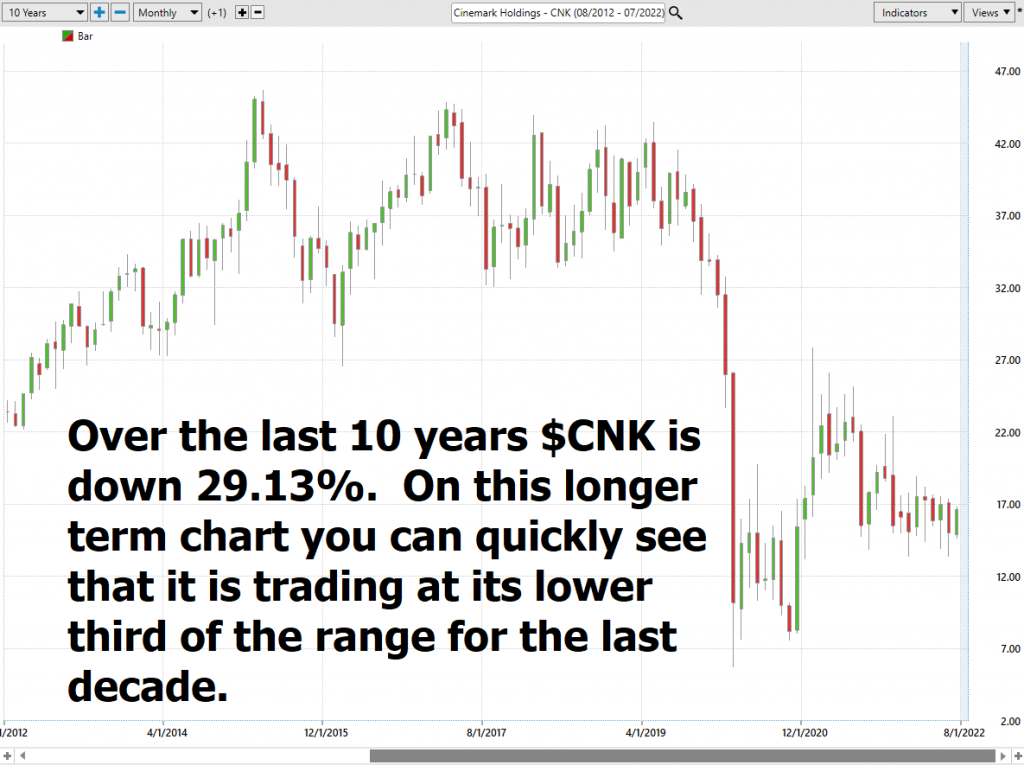
However, when you examine $CNK from a longer-term horizon you see that it has a more severe downtrend to contend with.
With this contrast we like to do a competitive analysis of just looking how it has performed over the past year.
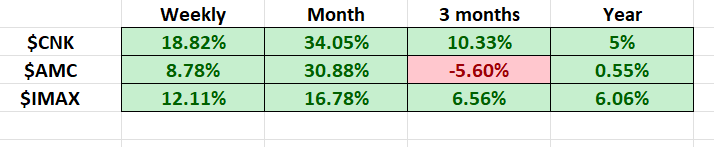
$CNK has outperformed its two largest competitors, but the majority of those gains have come over the past month.
Best Case – Worst Case Analysis
Next, we want to evaluate $CNK in comparison to the performance of the major stock market indexes which we have greater familiarity with and then look at the drawdowns of the stock over the past year to get a worst-case scenario idea for any conclusions that we might reach when we trade this asset.
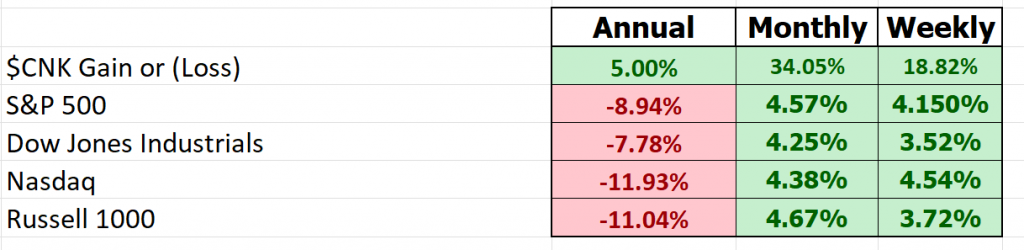
$CNK has outperformed the broader stock market indexes, but most of these gains have occurred in the past month.
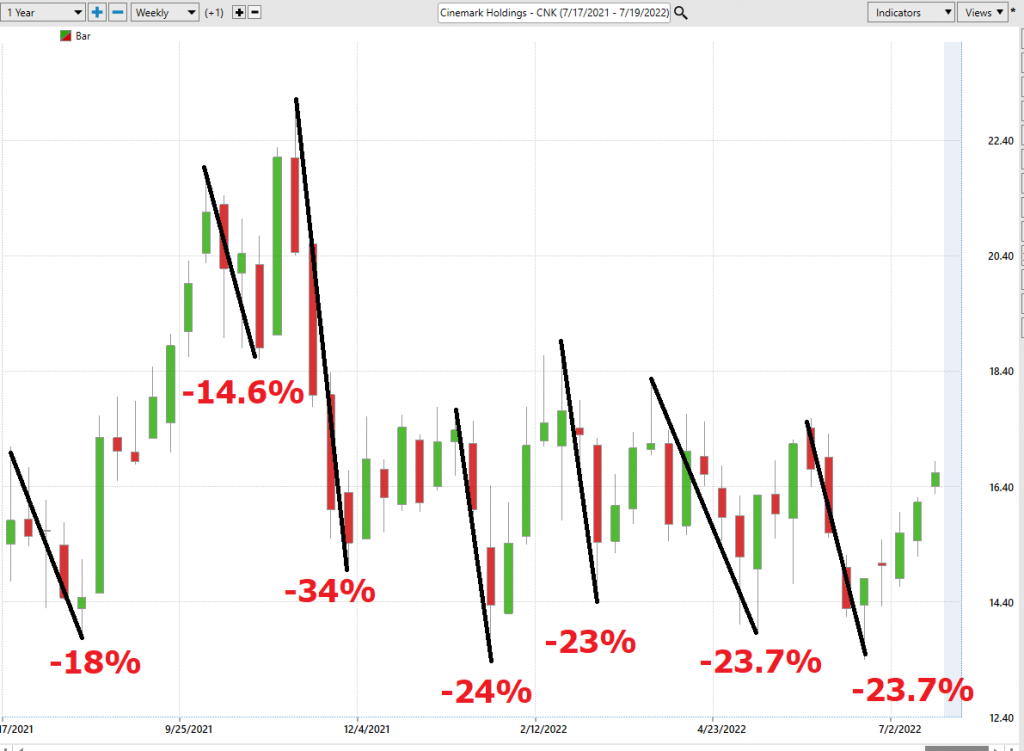
What were the worst-case drawdowns? The graphic above shows the bumpy ride. We like to contrast these drawdowns against the best-case scenario just to get a better idea of the volatility of the asset and how quickly circumstances change when trading this asset.
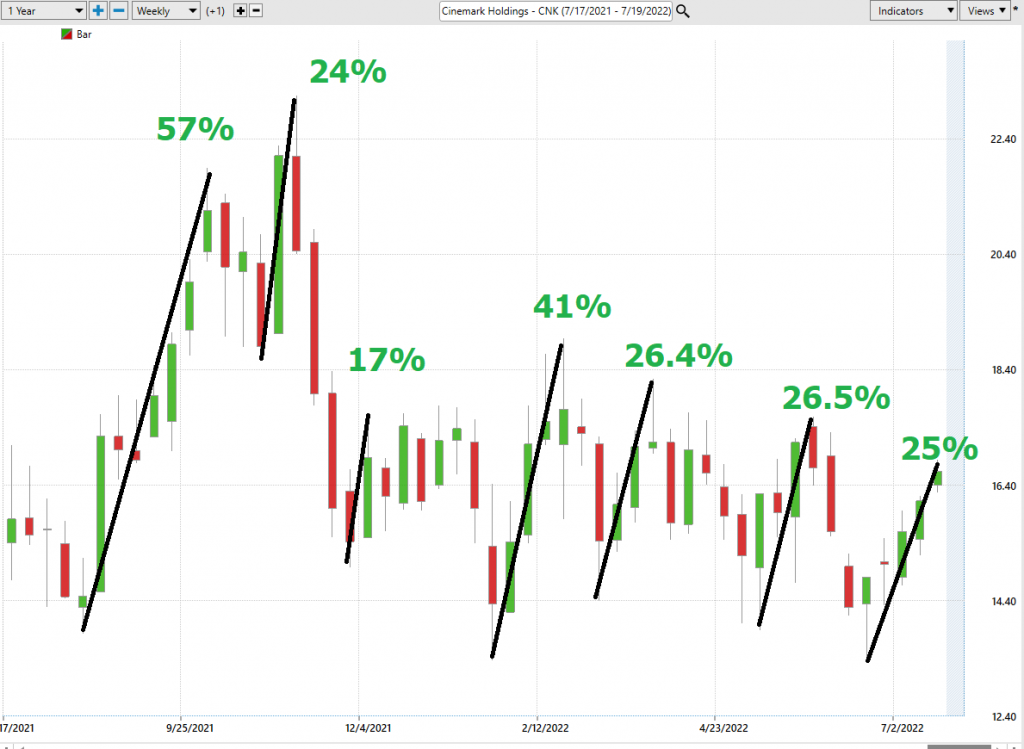
You can see that these gains and drawdowns came very quickly. Each bar on the chart represents one week. More importantly this may not be a buy and hold asset. Traders who have been successful in trading $CNK have had to be nimble and agile as the average holding period was only a few weeks whether you were long or short.
We expect this type of volatility to continue. This means that 20%+ drawdowns peak to trough should be considered very normal moving forward. Power Traders should have $CNK on their radar and pay attention when this occurs and look for guidance from the a.i. as to when you choose to enter.
The Vantagepoint A.I. Analysis
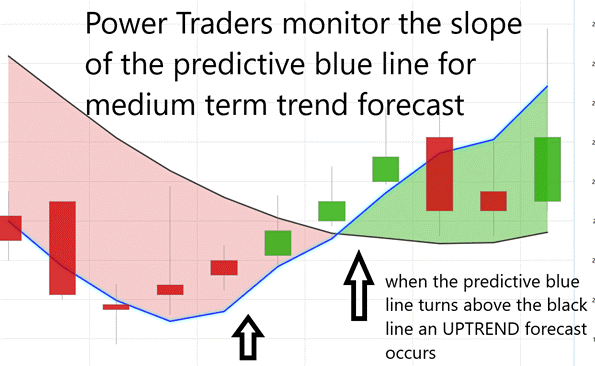
Using VantagePoint Software and the artificial intelligence, traders are alerted to trend forecasts by monitoring the slope of the predictive blue line. The black line is a simple 10 day moving average of price which simply tells you what has occurred in the market. The predictive blue line also acts as value zone where in uptrends traders try to purchase the asset at or below the blue line.
In studying the chart below, pay close attention to the relationship between the black line and predictive blue line. All that the black line tells you is what has occurred. It tells you where prices have been and what the average price over the last ten days is.
The predictive blue line, on the other hand utilizes that Vantagepoint patented Neural Network and Intermarket Analysis to arrive at its value. It looks at the strongest price drivers of an asset through artificial intelligence and statistical correlations to determine its value.
Whenever we see the predictive blue line move above the black line, we are presented wth an UP-forecast entry opportunity. These are highlighted by UP arrow on the chart.
Whenever the predictive blue line moves below the black line, we are presented with a DOWN forecast. More importantly, there is no guesswork involved. Traders know where the value zone and trend is at all times.
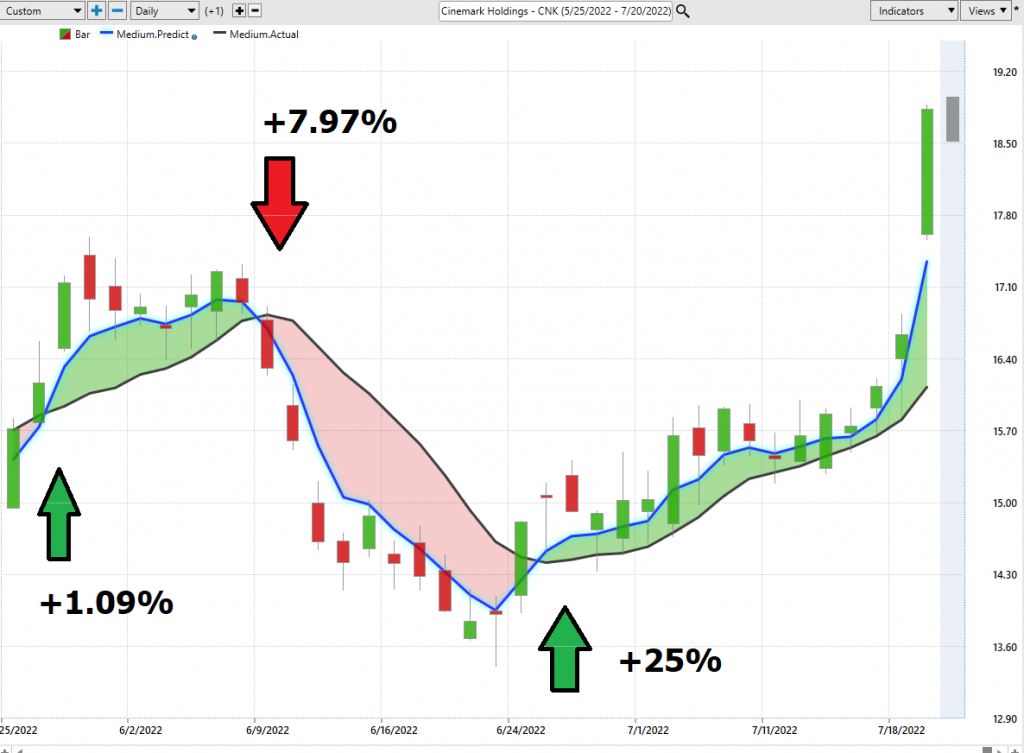
Using only the Vantagepoint Predictive Blue line as a trading guide there were three trading opportunities:
#1 – Long for 1.09%
#2 Short for 7.09%
#3 Long for 25%
These are the returns that would have been achieved by simply monitoring the Up and Down forecasts which were created by the artificial intelligence.
Fine Tuning Entries with The Neural Net Indicator
At the bottom of the chart is the Neural Network Indicator which predicts future strength and/or weakness in the market. When the Neural Net Indicator is green it communicates strength. When the Neural Net is red it’s forecasting short term weakness in the market.
We advocate that Power Traders cross reference the chart with the predictive blue line and neural network indicator to create optimal entry and exit points.
A Neural Net is a computational learning system that uses a network of functions to understand and translate massive amounts of data into a desired output, consistently monitoring itself and improving its performance.
Power Traders are always looking to apply both the neural network and A.I. to the markets to find statistically sound trading opportunities. We refer to this as a “double confirmation” setup and look for the predictive blue line to slope higher and to be confirmed by the Neural Net at the bottom of the chart.
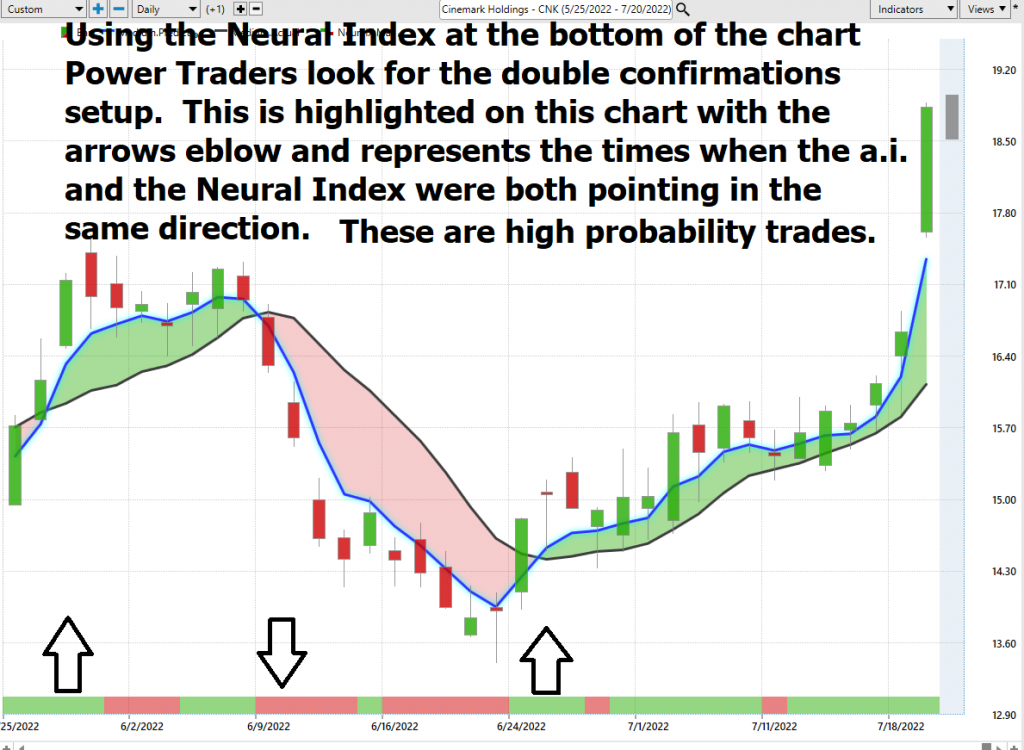
We advise Power Traders to cross reference the predictive blue line with the Neural Net for the best entry opportunities. Observe how the slope of the predictive blue line has remained positive from the time earnings were announced.
You can see in the chart above how the Neural Net offered several opportunities of double confirmation to Power Traders, when the predictive blue line and the Neural Net aligned with the same forecast. These instances provide very high probability trading opportunities to exploit the trend.
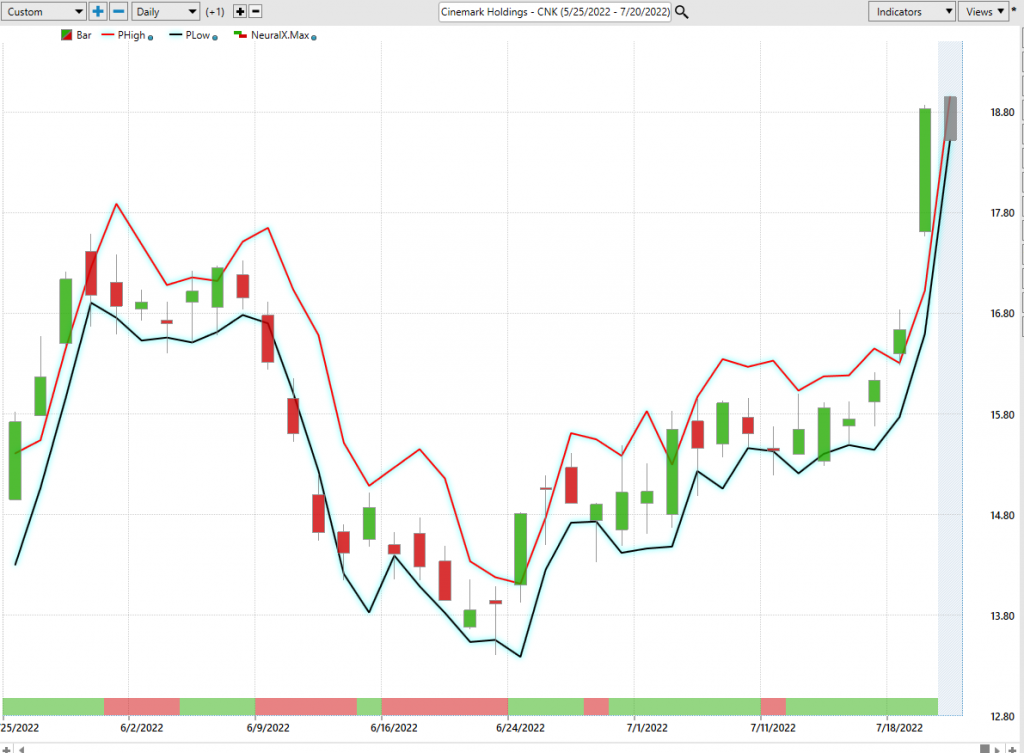
VantagePoint Software Daily Price Range Prediction
One of the powerful features in the Vantagepoint A.I. Software which Power Traders use daily is the Daily Price Range prediction forecast.
This forecast is what permits Power Traders to truly fine tune their entries and exits into the market.
What is the most important feature that traders are concerned about? Traders need to know where to enter and exit a market. VantagePoint provides this answer with exacting precision. Every day the Daily Range forecast is updated to provide insight to anticipated price action.
The average weekly trading range for $CNK over the last two year is 12% of the weekly closing price. Despite this very volatile weekly range, you can easily see how effective the Vantagepoint A.I. Daily Range forecast is im anticipating the trading range for the following trading day.
Intermarket Analysis
What makes the Vantagepoint Software extraordinary is its capacity to perform Intermarket analysis and to find those assets which are most statistically interconnected and are the key drivers of price.
Studying the charts can always provide objective realities in terms of locating support and resistance levels which become clear on a chart. But we live in a global marketplace. Everything is interconnected. The billion-dollar question for traders is always what are the key drivers of price for the underlying asset that I am trading?
These intangibles are invisible to the naked eye yet show very high statistical correlations.
Minor changes in Interest rates, Crude Oil Prices, and the Volatility of the dollar amongst thousands of other variables affect the decisions companies must make to survive in these very challenging times. Trying to determine what these factors are is one of the huge problems facing investors and traders.
Intermarket analysis is a powerful tool that can help traders pick better stocks to trade. By understanding how different markets are interconnected, traders can get a better sense of what is driving price action and identify potential trading opportunities. Intermarket analysis can also be used to manage risk by identifying potential sources of correlation. By understanding the relationships between different markets, traders can make more informed decisions about stock selection and position sizing. Ultimately, intermarket analysis can help traders improve their risk/reward profile and pick better stocks to trade.
There is immense value to be had in studying and understanding the key drivers of $CNK’s price action. In general, assets that are highly correlated tend to move in the same direction, while those that are not as strongly correlated may move in opposite directions. By understanding the correlations between different asset classes, investors can assess the risk/reward tradeoff and make decisions accordingly.
By doing so you can often see which ETFs are most likely acquiring $CNK as well as uncovering other industries which affect $CNK price movement.
Suggestion
The performance metrics tell the entire story.

$CNK is outperforming its major competitors but the majority of the gains for this asset have come in the last month.

We like the idea of looking for buying opportunities of $CNK on dips and breaks which we expect to occur on a regular basis.
Trade selection is a process that involves considering a variety of factors, including the overall market conditions, and your own personal risk tolerance. With that said, $CNK stock may be a good option for investors who are looking to profit from the eventual return to normalcy following the Covid-19 pandemic. The stock is currently trading at a relatively low price, which could provide an attractive risk/reward proposition for patient traders. But as we have shown in this analysis, this asset is a hit and run type of trading vehicle.
Our advice: Follow the a.i. trend analysis and practice good money management on all your trades.
It will be interesting to see if $CNK can sustain its gains in a prolonged trend or whether it will continue its very choppy trading over the coming weeks and months. We anticipate the latter.
We will re-evaluate this analysis based upon:
- Wall Street Analysts’ Estimates
- 52-week high and low boundaries
- Vantagepoint A.I. Forecast (Predictive Blue Line)
- Neural Network Forecast
- Daily Range Forecast
- Bollinger Band analysis
- Intermarket Analysis
Let’s Be Careful Out There!
Remember, It’s Not Magic.
It’s Machine Learning.

IMPORTANT NOTICE!
THERE IS SUBSTANTIAL RISK OF LOSS ASSOCIATED WITH TRADING. ONLY RISK CAPITAL SHOULD BE USED TO TRADE. TRADING STOCKS, FUTURES, OPTIONS, FOREX, AND ETFs IS NOT SUITABLE FOR EVERYONE.
DISCLAIMER: STOCKS, FUTURES, OPTIONS, ETFs AND CURRENCY TRADING ALL HAVE LARGE POTENTIAL REWARDS, BUT THEY ALSO HAVE LARGE POTENTIAL RISK. YOU MUST BE AWARE OF THE RISKS AND BE WILLING TO ACCEPT THEM IN ORDER TO INVEST IN THESE MARKETS. DON’T TRADE WITH MONEY YOU CAN’T AFFORD TO LOSE. THIS ARTICLE AND WEBSITE IS NEITHER A SOLICITATION NOR AN OFFER TO BUY/SELL FUTURES, OPTIONS, STOCKS, OR CURRENCIES. NO REPRESENTATION IS BEING MADE THAT ANY ACCOUNT WILL OR IS LIKELY TO ACHIEVE PROFITS OR LOSSES SIMILAR TO THOSE DISCUSSED ON THIS ARTICLE OR WEBSITE. THE PAST PERFORMANCE OF ANY TRADING SYSTEM OR METHODOLOGY IS NOT NECESSARILY INDICATIVE OF FUTURE RESULTS. CFTC RULE 4.41 – HYPOTHETICAL OR SIMULATED PERFORMANCE RESULTS HAVE CERTAIN LIMITATIONS. UNLIKE AN ACTUAL PERFORMANCE RECORD, SIMULATED RESULTS DO NOT REPRESENT ACTUAL TRADING. ALSO, SINCE THE TRADES HAVE NOT BEEN EXECUTED, THE RESULTS MAY HAVE UNDER-OR-OVER COMPENSATED FOR THE IMPACT, IF ANY, OF CERTAIN MARKET FACTORS, SUCH AS LACK OF LIQUIDITY. SIMULATED TRADING PROGRAMS IN GENERAL ARE ALSO SUBJECT TO THE FACT THAT THEY ARE DESIGNED WITH THE BENEFIT OF HINDSIGHT. NO REPRESENTATION IS BEING MADE THAT ANY ACCOUNT WILL OR IS LIKELY TO ACHIEVE PROFIT OR LOSSES SIMILAR TO THOSE SHOWN.

